
nsprph
@t_nsprph

What symbols does the trader recommend buying?
Purchase History
پیام های تریدر
Filter
nsprph
بیت کوین به ۸۳ هزار دلار سقوط میکند؟ پیشبینی عجیب پایان صعود و کف جدید خرسی!
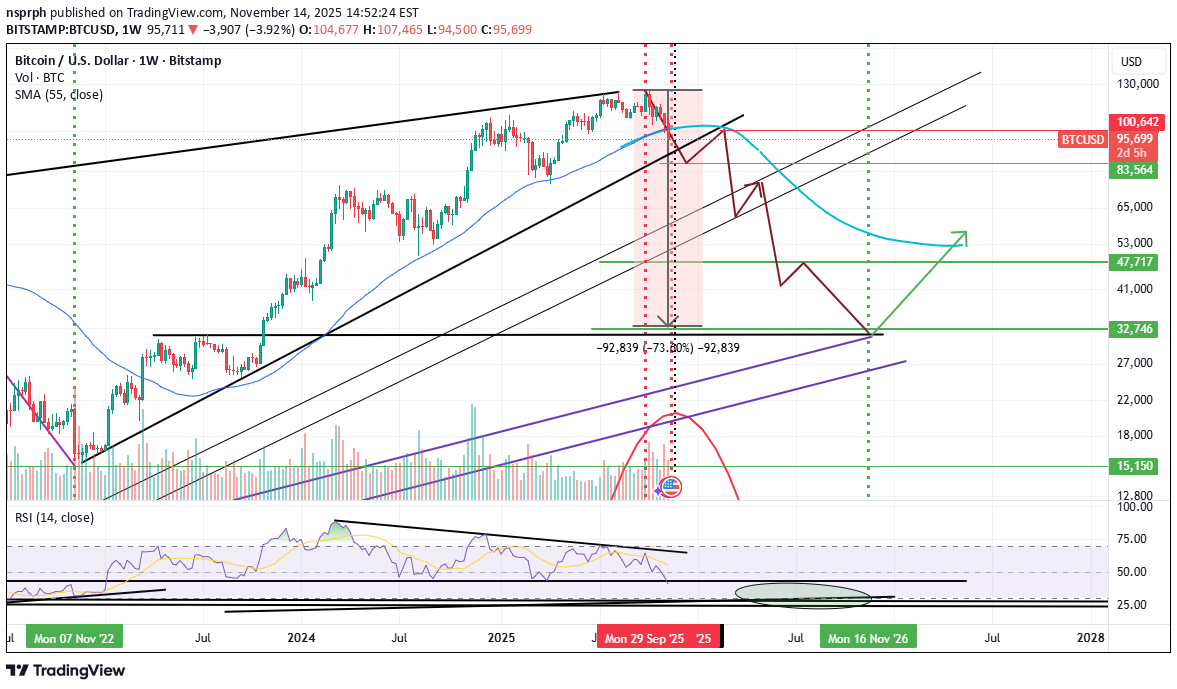
We should make to about 83k area then bounce to about 100l and get rejected. Every time in the bull run if BTC closes below 55 WMA the run is over. The close today should give us that info. This will be the second confirmation the cycle at the end of Oct of 2025 and the bear low should come in Nov of 2026 between 50k to 30k. The sine wave (red wave) for top predicted when the bull cycle would end and then the sine wave (green wave) predicts when the bear would end. Not trading advise.
nsprph
سقوط آزاد مايکرو استراتژی (MSTR) به زیر ۶۰ دلار: پایان چرخه بیت کوین؟
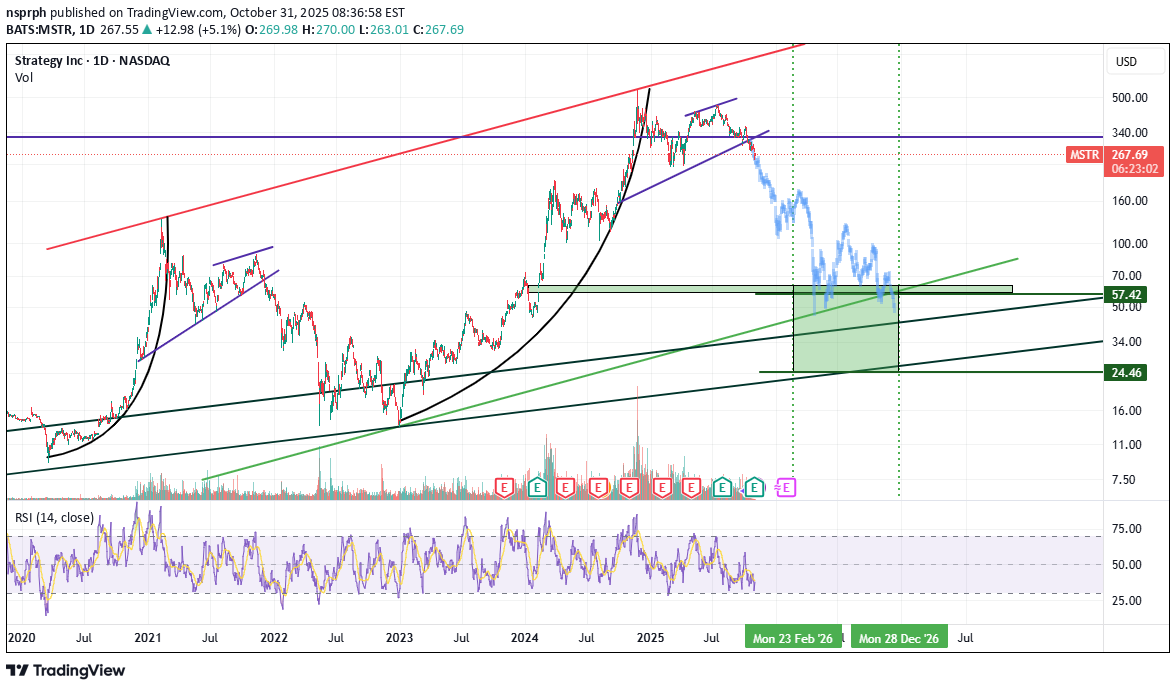
BTC cycle is over or almost over - may not get the blow off top everyone is expecting. If that is the case MSTR will go to min 50-60 area if not lower.
nsprph
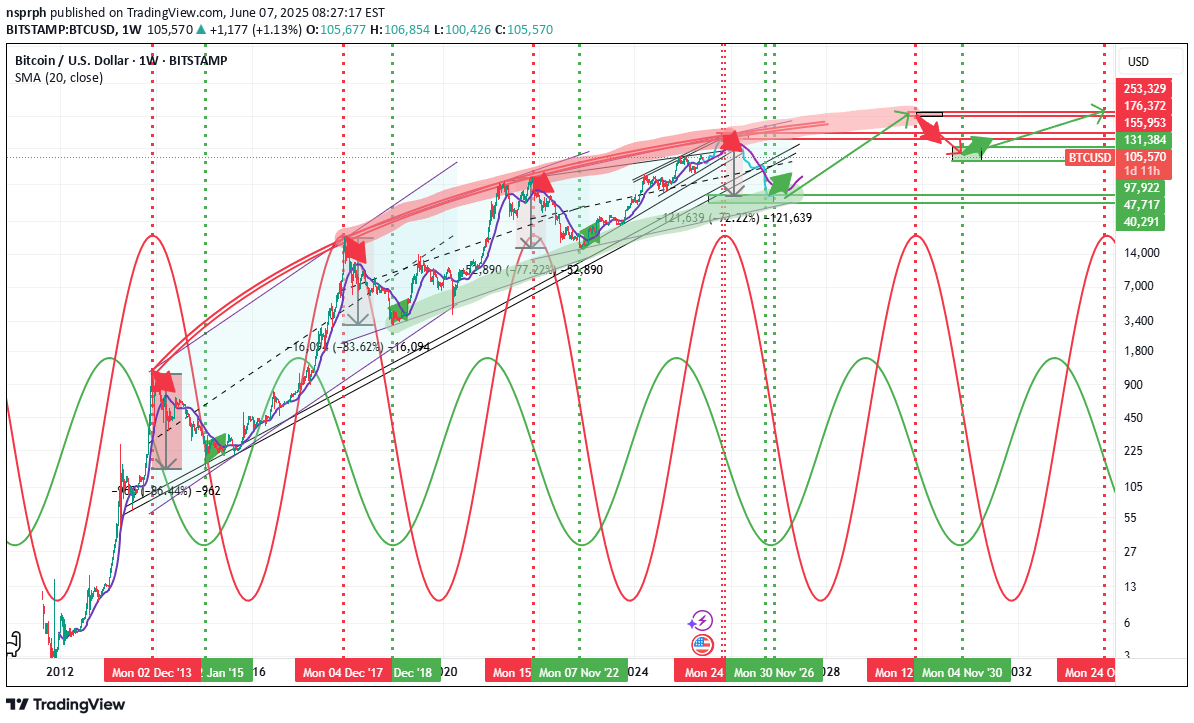
بیت کوین: آیا زمان فروش فرارسیده است؟ (آماده سقوط به ۳۰-۵۰ هزار دلار؟)
We are entering the time frame to sell. There is still a little room left for a rally but the clock is ticking. No matter the new says with adoption the bear is coming or here. Then it will be time to buy at 30-50k depending or the high we make. The highs are lower in percentage. Not trading advise.
nsprph
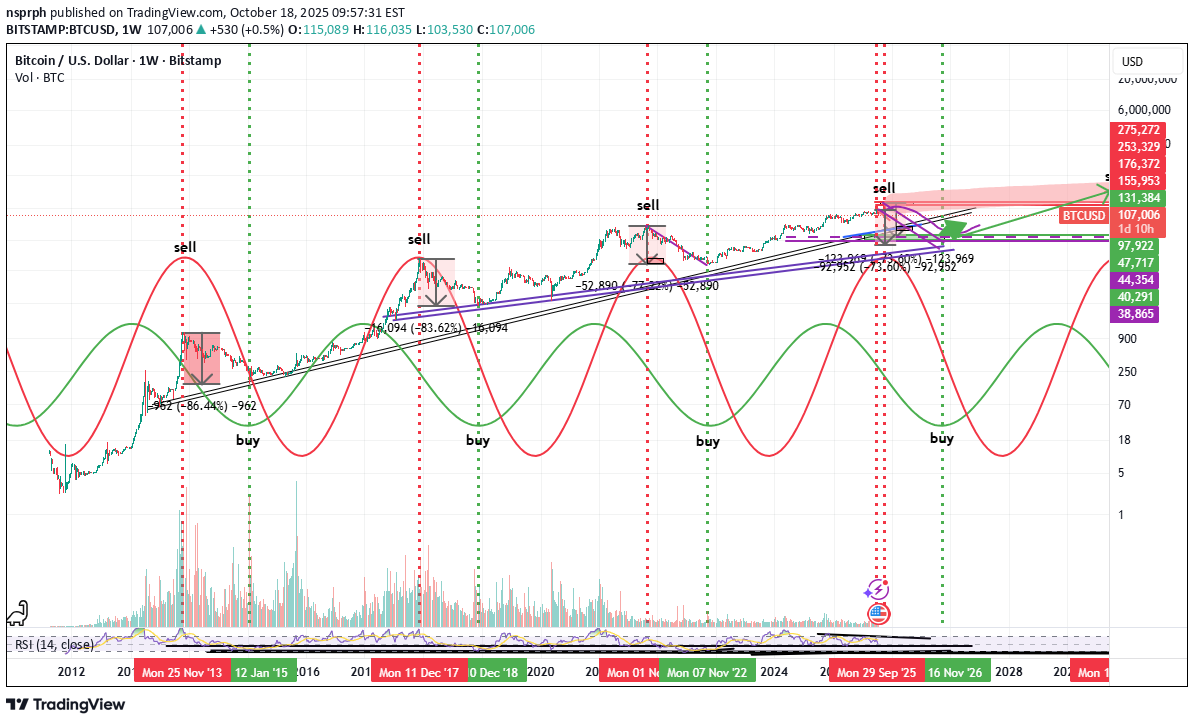
BTC cycles and levels long term
The highs and lows are shrinking in percentage terms. The cycles are still about the same. Here are the estimated cycles and levels of high and lows of those cycles. Not trading advise.
nsprph
The 10x gold rule?

The major lows and high and the bull market high and bear market lows 10x give the projections for the highs and lows of the following major bull market. Found it interesting. People say they for gold to go above 5k the world would be in serious trouble. But in the 70s to 80s it went from 35 to 850 so I think this type of move is possible again. Just some thoughts. Very simple analysis. Not trading advice.
nsprph
BTC back in the sell zone

Very close top topping here and then a correction, possible path.
nsprph
BTC TOUCHED SELL ZONE

This part of the move might be coming to an end then a correction then new high
nsprph
Long term SPX
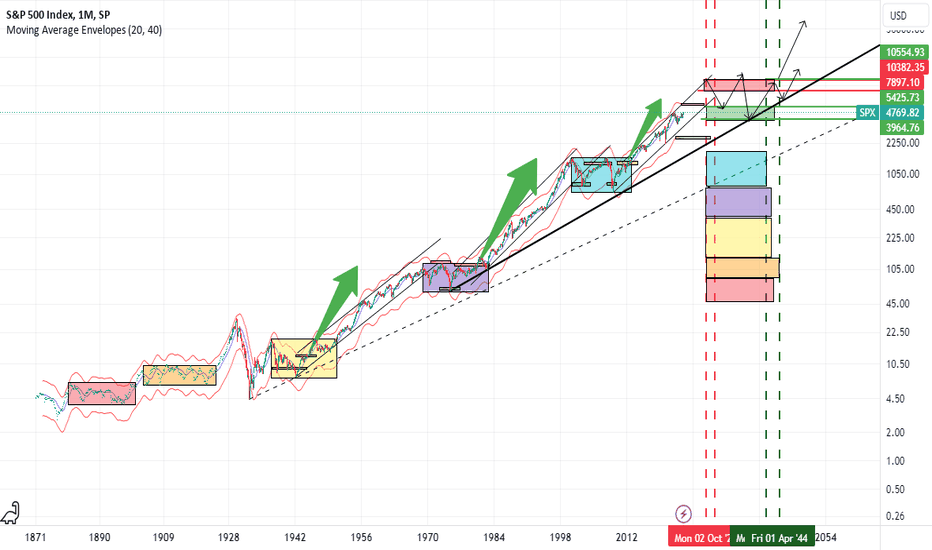
Still in channel but the envelope is starting to go side ways ( current sell and buy area ). If we continue up in the channel then we could reach the time frame where we go side ways for about 10yrs. In the 10 year side ways movement there is also area for selling and buying. and once we break out of the long term consolidation we will be a the next big bull move- if the pattern continues.
nsprph
BTC long term - updated

Note to myself. Don't have to look for the exact bottom 1. Buy the break of the RSI down trend line. ( red vertical line) 2. Buy the weekly close above 20 WMA after the break is confirmed. ( blue oval) 3. Buy the test of the black curve line ( green oval - happened after every major bottom) but after break if RSI down trend line is broken and a close above the 20 WMA.2. buy the weekly close above 20 WMA after break is confirmed for RSI.
nsprph
S&P Long Term chart
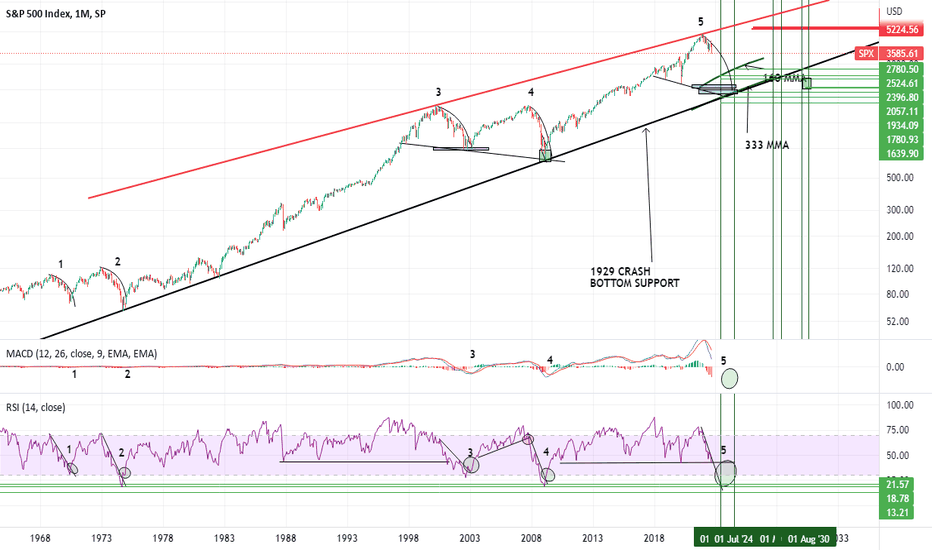
If we follow the other 4 times. I should buy once the monthly RSI down trend is broken and look for support at the 1929 crash bottom trend line. Use Fibs to target possible bottoming levels. Fingers crossed.
Disclaimer
Any content and materials included in Sahmeto's website and official communication channels are a compilation of personal opinions and analyses and are not binding. They do not constitute any recommendation for buying, selling, entering or exiting the stock market and cryptocurrency market. Also, all news and analyses included in the website and channels are merely republished information from official and unofficial domestic and foreign sources, and it is obvious that users of the said content are responsible for following up and ensuring the authenticity and accuracy of the materials. Therefore, while disclaiming responsibility, it is declared that the responsibility for any decision-making, action, and potential profit and loss in the capital market and cryptocurrency market lies with the trader.