
noble1ones
@t_noble1ones

What symbols does the trader recommend buying?
Purchase History
پیام های تریدر
Filter
noble1ones
Double Top & Inverse Bearish Exotic Pattern
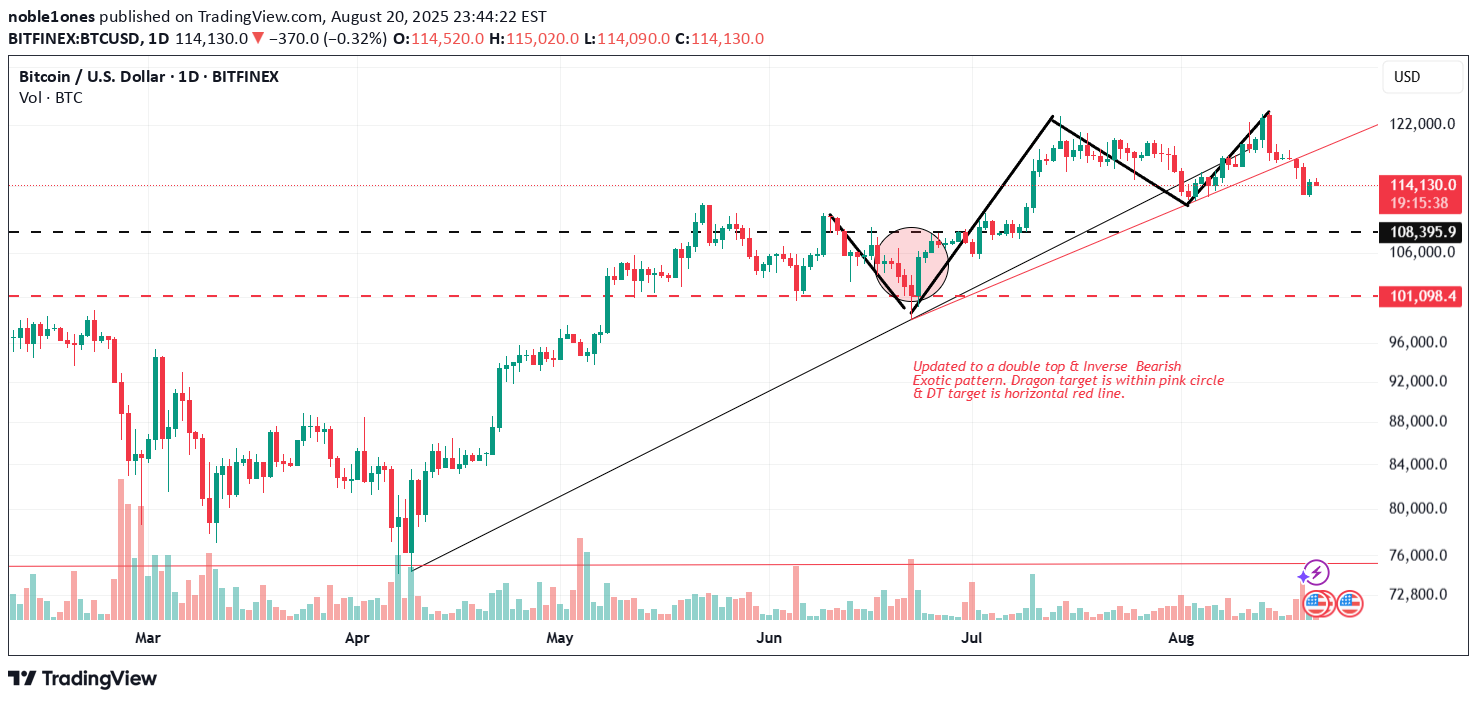
Updated to a potential double top pattern within an inverse exotic dragon pattern with short term potential targets.
noble1ones
Potential BITCOIN HUGE BEARISH PATTERN PRINTING OUT
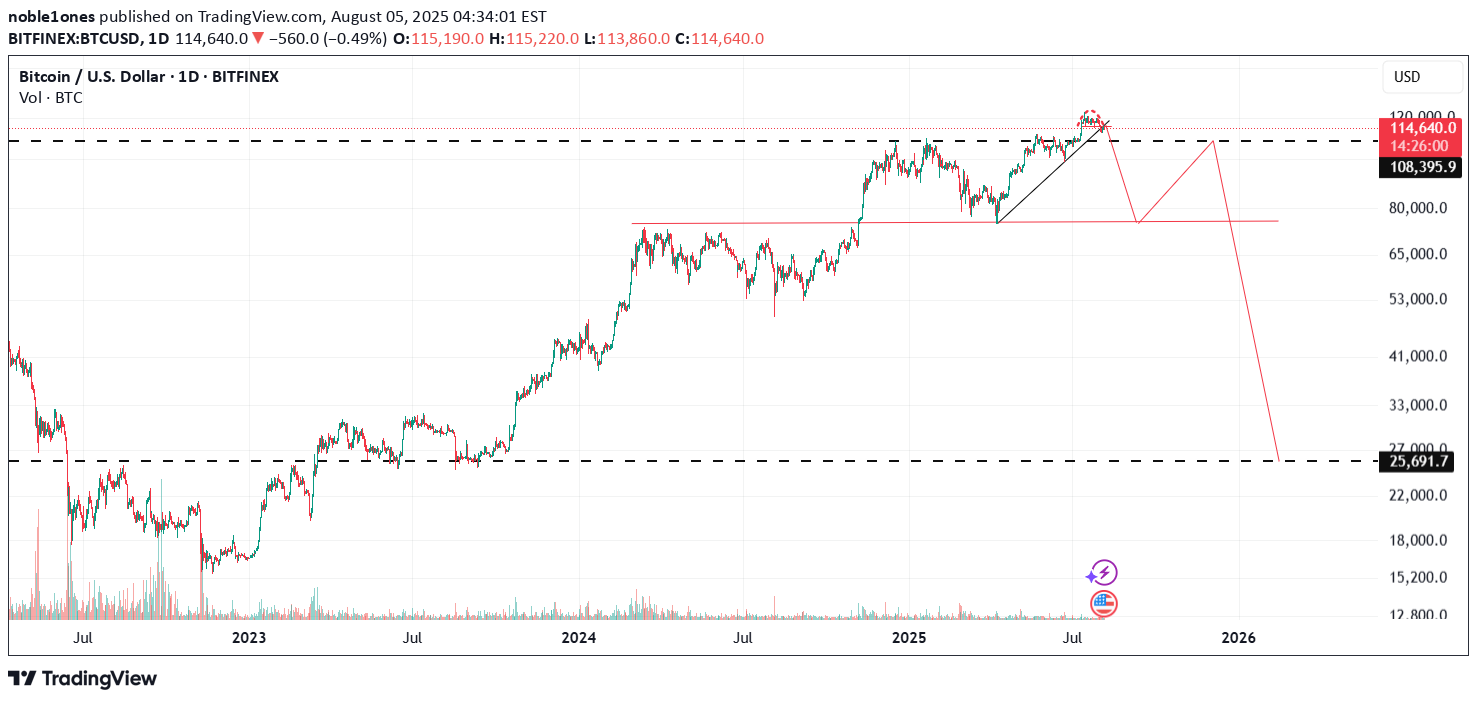
It certainly fits from my perspective. A nice overdue correction that fits its approximate prior trough corrective range level. As above so below. In Nov 2022 the classical TA bottom pattern was an inverted head & shoulders.Inverted cup & handle pattern with approximate potential target...Potential huge bearish pattern still in play. The inverted cup & handle failed. EW impulse wasn't completed, however, it appears to be now from my perspective... Here's an update.
noble1ones
Bitcoin Rounding Top & April's Uptrend Line Breach
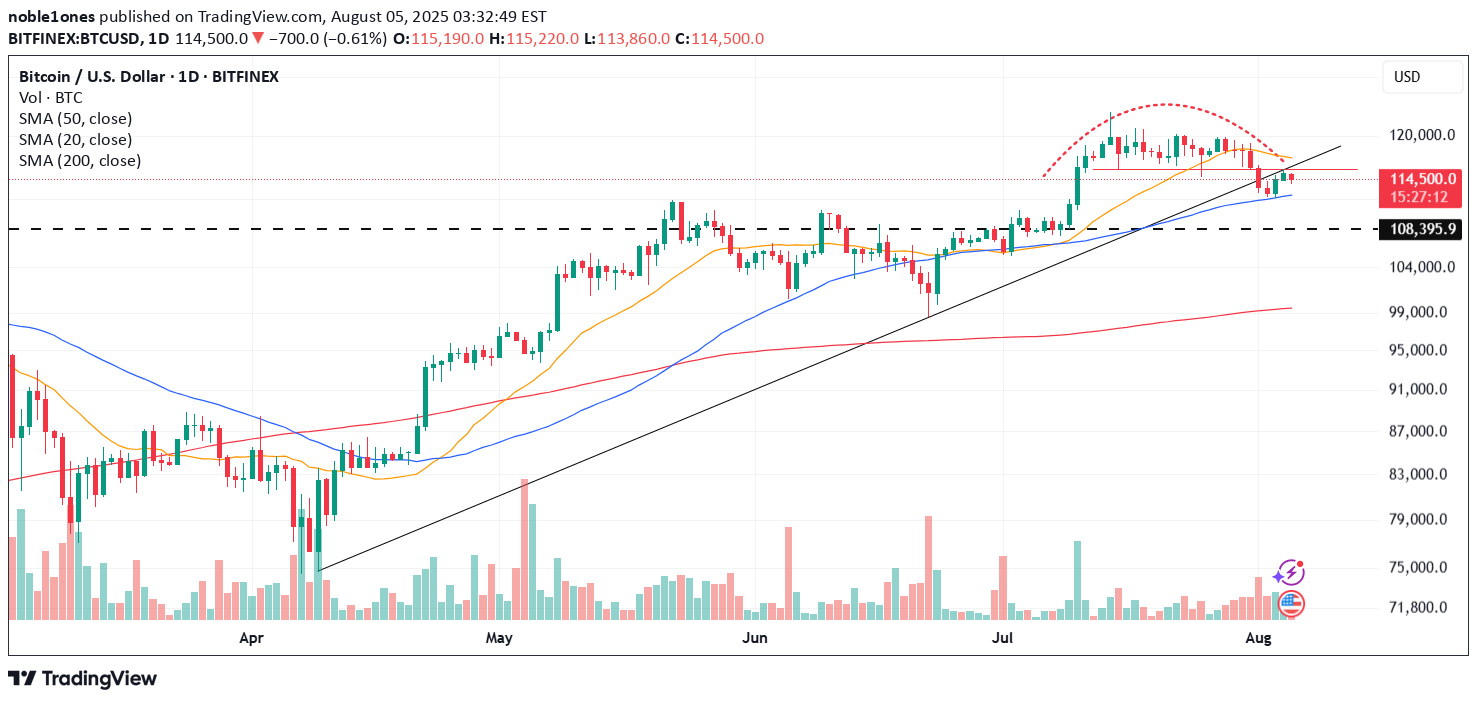
As an update to one of my prior ideas. The prior idea had mentioned that what may have appeared to be a bullish pattern on a lower time frame may have been misleading. I had pointed out why on higher time frames. Here is an update: A Rounding top appears to have formed along with a breach of the April low's uptrend. The breach found support on the 50dma, then snapped back and retested the breached uptrend line. A downward continuation would be the most probable direction for price to trend within this scenario, in my humble opinion.Still in play and retested the uptrend line breach, in my humble opinion. What am I looking at now. A head & shoulders top breakout after reaching the potential peak target of a proregressive dragon pattern.
noble1ones
Nice Bitcoin Bullish Set Up On The Hourly
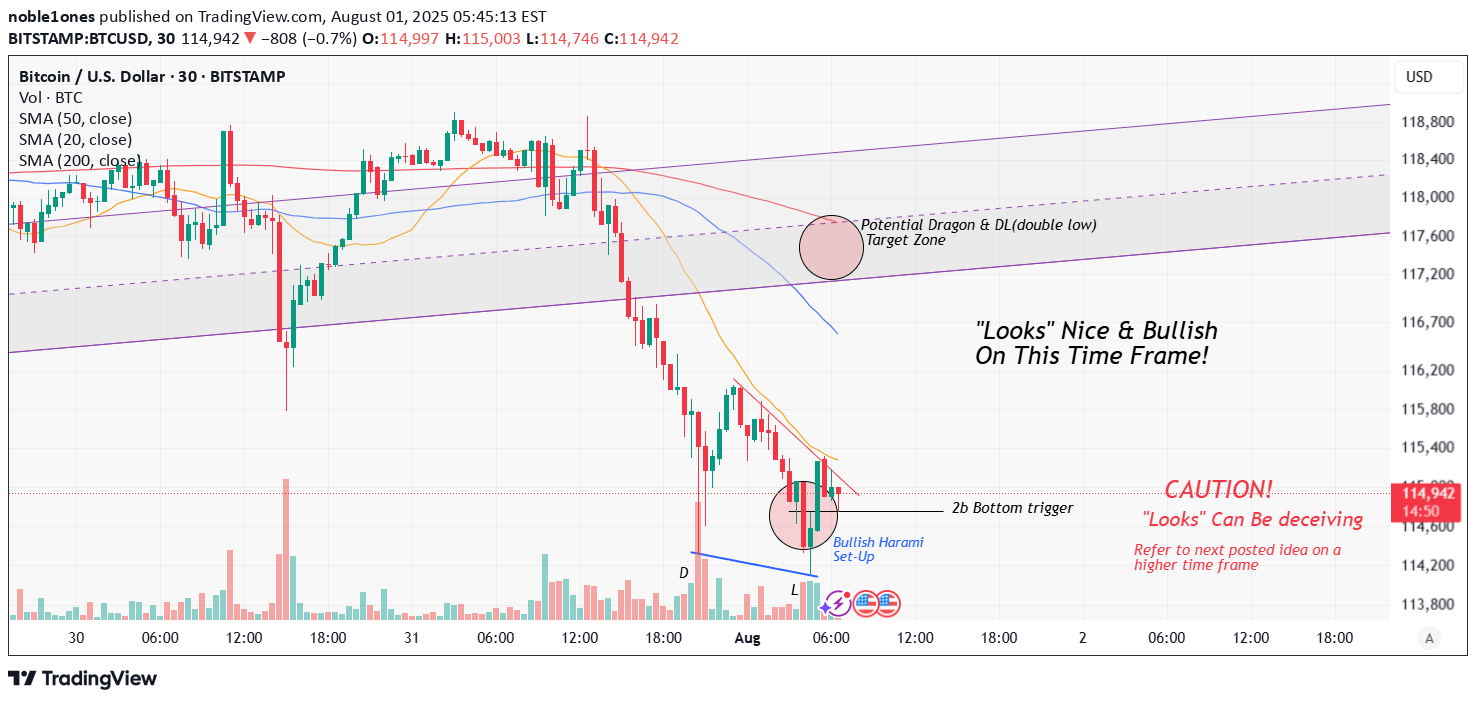
I noticed something that may look interesting on the hourly time frame. So here's a little heads up!
noble1ones
Bitcoin PRICE COLLAPSE Suggests Potential $38k Target

The 38k approximate target was first suggested based on the BARR pattern posted on April 16 2024. Furthermore a nice inverted dragon pattern has shaped and printed suggesting a target zone within the pink circle and the 2 dashed horizontal red lines. Today's plunge in price nearly clipped the top horizontal dashed red line. Stay tuned. This is becoming quite interesting on its potential way to a 4k dramatic selloff from within what appears to be a historical expanded flat wave B peak. In my humble opinion............ All The Best!
noble1ones
PEPE Bull Flag Breakout

Exactly as the headline indicates, PEPE appears to be breaking out of a Bull Flag pattern. In my humble opinion..........
noble1ones
BARR Suggests Potential Bitcoin Collapse To $38k

Following my prior idea on a Potential Massive Bitcoin Expanded Flat Correction Around $4k: I thought this idea to be interesting enough to share with the general public. It's referred to as the Bump-and-Run Reversal Top. The pattern was discovered by Thomas Bulkowski in 1996. What is even more fascinating is the fact that aside from the author's pattern website giving a thorough description along with guidelines & tips, it also provides an example of a Bump-and-Run Reversal Top using a chart that also has an outlined "Triangular Top"(Shabacker description of TTR's/Triangular Top Reversals). What are the odds of that "synchronicity" just being happenstance? Wait, to push this synchronicity recognition a little further, what are the odds that the year that the chart example given on the site would have the same vibration as the current one at the time of my idea being presented to you today? Look at the date inscribed on the author's chart on the author's website. 2006 =8 & 2024 =8. BARR pattern. A supposed Triangular Top and the vibration 8. Happenstance or synchronicity? I'll let you decide..... But before you do, Quote: " Psychiatrist Carl Jung had a term for meaningful coincidences: synchronicity. He wasn't just talking about interesting surprises, like getting a lottery number that matches your birth date. Synchronicity is what happens when seemingly unrelated events coincide in improbable ways that have some sort of significance for you. Jung believed synchronicities were evidence of a unifying consciousness at play in the universe, creating physical manifestations of what's happening in our psyche. We can use these synchronicities to better understand ourselves " Back to the idea. The bold black trend lines are the BARR pattern. The red diagonal lines are 'lead-in' channels/Sell Lines placed according to the measure rule. A(The start of the pattern) being the target, would suggest approximately $38,5ish where I drew the black dashed horizontal line on the chart. As for the potential symmetrical triangle that was first perceived to be, whether one still wants to believe such a pattern ever was, price would be considered to be at the undershoot point at the time of this writing. That undershoot point would also be the 'Run' phase in the BARR pattern. Typically a cascading effect tends to follow. One could also apply a Donchian Channel to the chart and or Trader Vic's 1-2-3 method. In my humble opinion..............At this juncture false breakouts tend to occur. I took the liberty to add a potential alternate count labeled as a potential flat, Wave C being equal to wave A in distance(measured move). Technically price did breach prior support and would be in the midst of activating a 1-2-3 method due to being in the midst of breaking beneath point 2. I'm paying attention to the volume on this particular break. So far there doesn't appear to be much of it which adds suspicion to the authenticity of this breakout along oversold signals intraday. It could be a bear trap. That said, the uptrend has snapped per the lead-in trend line price breach until proven otherwise, in my humble opinion........... Be Vigilant! Updated chart posted below.Update on a completed mini intraday BARR bottom pattern that had developed yesterday while failing the bearish breakout has been posted below for your entertainment, in my humble opinion.Update: A little Heads up on sentiment. I had mentioned that a H&S Top had appeared to have formed in a prior idea. Using the Crypto Fear & Greed Index graph on alternative.me on a 1 year setting. From the low reading on January 24 2024 at 48 up to the high reading of 90 on March 5 2024 an EW cycle appeared to have completed. The following drop from 90 to 75 on March 6 formed the next trough to draw the neckline diagonally from the February low 72 reading, extended to the right is where it got tested on March 27 at a reading of 83 once it broke down the NL after forming the right shoulder on March 14 at a reading of 88. The projected target was estimated to be at an approximate reading of 58. Yesterday's sentiment reading dropped to 57 from 67 and bounced to a current reading of 66. Therefore the head & shoulders pattern call's target has been reached. Speaking of H&S's, I posted an update down below earlier. In my humble opinion............Updated chart below.Another updated chart has been posted below.Heikin-Ashi Chart update on daily time frame below.Here's another update on a smaller time frame . Chart posted below.Update posted below. C&H breakout failed to hold and became a bull trap, in my humble opinion.......Updated twice below.Another update has been posted below. It's a simple heads up based on a particular candlestick pattern. Then I think I'll stop updating here because the thread is becoming long.
noble1ones
Potential Top Symmetrical BITCOIN BULL TRAP Pattern!

I took the liberty to draw up something that may appear as a "bullish" pattern to most. However, it may be an illusion. Perhaps it appears to look like something that isn't quite right. According to Edwards & Magee 9th Edition chapter 8 page 99, triangles can behave "properly" 66% of the time and they don't 1/3 of the time. Therefore I need to keep that in mind especially since it occurred in bitcoin in the prior month at the top. In my humble opinion.Now perhaps some will understand why I like to reserve my ideas/space for my follow ups in the comment section. People are more than welcome to post comments, but not their ideas(charts) without asking me first. It makes it simpler to comprehend without posting mile long updates, in my opinion...... I thank you for your support and understanding..... All The Best!Ok that's enough for now. Below I posted patterns along with follow ups. All The Best!Below I had marked: What appears to look like a ST will also experience an undershoot. Price appears to be at the "undershoot" stage at the moment, in my humble opinion..........So how is that "bullish symmetrical triangle/continuation pattern" doing? Not well I see. Distinguishing the subtle differences within pattern structures is key. Price pulled and closed beneath the 50 DMA(daily chart), then tested it and got rejected as well. Perhaps the "Devine" is teaching MS a lesson for trying to market his enthusiasm by crossing the line and calling bitcoin Devine. You can check out my comments on the subject under the idea title: MICROSTRATEGY On The Verge Of A Potential Price Collapse? Stay tuned............ In my humble opinion............Here is another potential pattern that may be in the works rather than what appeared to be a symmetrical pattern. It's called a Bump-and-Run Reversal. I'll post it down below in order to manage the space in this section.I would like to update this idea simply by quoting a part and or parts of an article that has been published today. "Thielen responded, “Actually, no. We have been cautious since March 8, and when the triangle breakout failed, we worked with the $68,300 stop loss." April 16 2024 : ‘We Sold Everything Last Night’, Reveals Crypto Research Firm "Markus Thielen of 10x Research unveiled a significant shift in his crypto strategy in response to mounting financial pressures and market instability, as detailed in an investor note released earlier today. Thielen, an influential figure in the analysis sector, cited a concerning outlook on risk assets, which encompasses both technology stocks and cryptocurrencies, primarily driven by unanticipated and ongoing inflation rates." “Our growing concern is that risk assets are teetering on the edge of a significant price correction,” Thielen stated in the note. “We sold all our tech stocks last night as the Nasdaq is trading very poorly and reacting to the higher bond yield. We only hold a few high-conviction crypto coins. Overall, we are bearish on risk assets.” In a notable exchange with Matthew Graham of Ryze Labs, Thielen defended his firm’s trading strategy amid criticism for what was described as erratic decision-making. Graham pointed to recent fluctuations in 10x Research’s stance on Bitcoin, citing a research note from early April that predicted a potential rally to $80,000, followed by a more cautious view and the recent sell-off. Thielen responded, “Actually, no. We have been cautious since March 8, and when the triangle breakout failed, we worked with the $68,300 stop loss. This is simply risk-reward trading.” This defense highlights the volatile nature of crypto trading and the necessity for agile strategies in response to rapidly changing market conditions." end quote. REQUOTE: "Thielen responded, “Actually, no. We have been cautious since March 8, and when the triangle breakout failed, we worked with the $68,300 stop loss." BINGO! What??? You read it, I didn't invent it. Requote: "when the triangle breakout failed" There you have it, a quant checking out "triangles" and apparently making decisions based upon it! Quote: "Markus Thielen is the Head of Research at 10x Research. He also writes Research for Matrixport, a leading digital-asset investment firm. Before joining Matrixport, Markus was the Chief Investment Officer for IDEG Asset Management, and prior to that he was the founder and Chief Investment Officer at Jomon Investment Management. Previously Markus was a Portfolio Manager at Millennium Capital Partners and at JP Morgan's Investment Group. He started his career at Morgan Stanley, where he set up and ran the Quant & Derivatives Strategies Group in Asia. Markus has a degree from the ESCP Business School in Paris and a Certificate in Sustainable Finance from the University of Cambridge." " In my humble opinion.............
noble1ones
MICROSTRATEGY On The Verge Of A Potential Price Collapse?
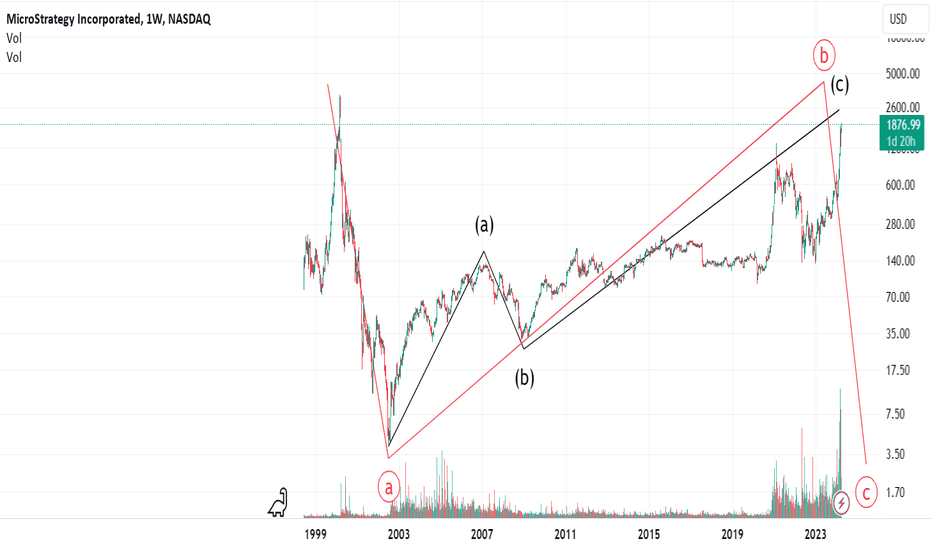
I took the liberty of charting this one since it's related to Bitcoin & listed on the Nasdaq Exchange. Not much to point out aside from the potential major corrective(proregressive) pattern it appears to be in. Looks like it's time to be vigilant, in my humble opinion....... All The Best!Interesting article on the subject: MicroStrategy is trading at an ‘unjustifiable premium’ to Bitcoin: AnalystI posted a disturbing marketing tactic below. In my humble opinion. All The Best!
noble1ones
Potential S&P 500 Millennium Cycle Complete,HUGE Correction Soon
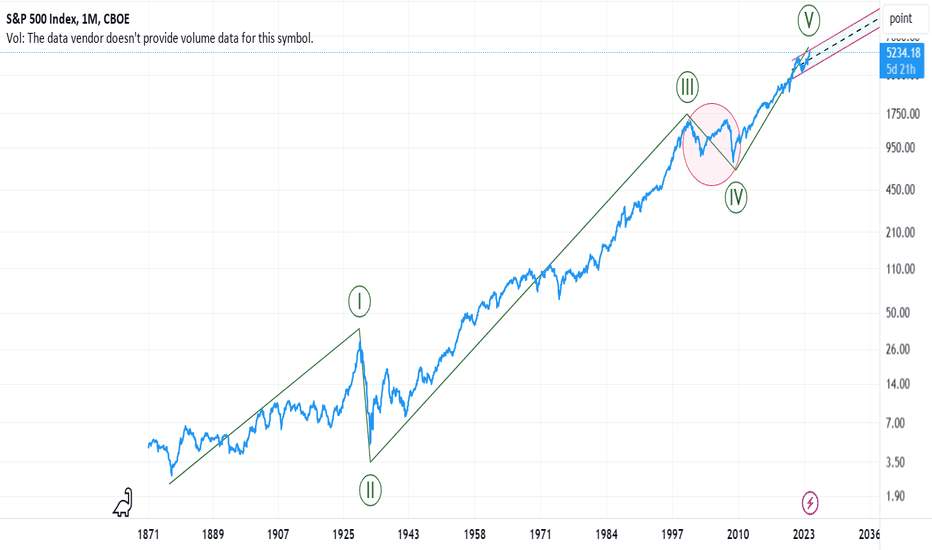
I took the liberty to chart the path of the S&P 500 since the debut that this site would allow, starting from since 1871.Potential target would be in the proximity of the pink circle/prior wave 4. It appears that if correct then the top is very very near, in my humble opinion........ All The Best!NEWS! April 4 2024 S&P 500 sectors all fall Thursday afternoon Quote: "All of the S&P 500 index’s sectors were trading lower in late-afternoon trading on Thursday, with declines led by information technology. The S&P 500’s tech sector was down 1.5%, according to FactSet data, at last check. The index’s healthcare, financials, communication-services, materials and industrials sectors were also seeing sharp drops of more than 1% late-afternoon Thursday. The U.S. stock market was broadly down, with the S&P 500 falling 1.2%, the Dow Jones Industrial Average sliding 1.4% and the Nasdaq Composite dropping 1.3%, according to FactSet data, at last check. The S&P 500 sector with the smallest losses Thursday afternoon was energy, with a modest 0.3% decline." News April 3 2024 Short Sellers’ Activity Surges in US Stocks, Goldman Data Show "Data signal hedge funds are starting to fight S&P 500 rally Short selling on individual US-listed stocks is at its highest level in six months, with shares in the tech, telecom and media sector among the most targeted, according to Goldman Sachs Inc. data." All The Best!
Disclaimer
Any content and materials included in Sahmeto's website and official communication channels are a compilation of personal opinions and analyses and are not binding. They do not constitute any recommendation for buying, selling, entering or exiting the stock market and cryptocurrency market. Also, all news and analyses included in the website and channels are merely republished information from official and unofficial domestic and foreign sources, and it is obvious that users of the said content are responsible for following up and ensuring the authenticity and accuracy of the materials. Therefore, while disclaiming responsibility, it is declared that the responsibility for any decision-making, action, and potential profit and loss in the capital market and cryptocurrency market lies with the trader.