
nakreko
@t_nakreko

What symbols does the trader recommend buying?
Purchase History
پیام های تریدر
Filter
BTC; TARİH TEKERRÜR EDERMİ ?

The upper chart is BTC's daily chart in 2018. The lower chart is BTC's current daily chart. The blue line is the 21-day EMA, the red line is the 55-day EMA. The green filled line below is the average of the Magicma indicator. The movement that BTC made with the 21 and 55 EMAs in 2018 (i.e. from 1 to 6) is very similar to the movement it made today. Of course, it is not exactly the same, but the dance it made with the EMAs and the shape formed by the EMAs are very similar. The 7th and 8th movements are ahead of us. If these continue in the same way, BTC should show an increase up to the 21 EMA (approximately 95-96k) and from there it should show a decrease down to the Magicma indicator (approximately 79-81k). Of course, there is no certainty that it will be like this. Let's all see together if history will repeat itself. What is explained here is not investment advice. It is completely my personal opinion. Good luck.
BTC, Gene mi Aynı Numaralar?
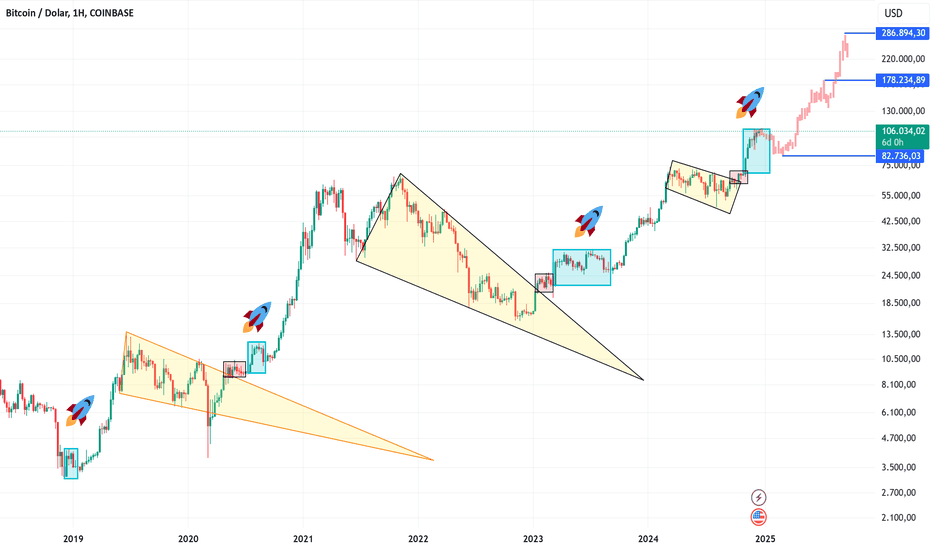
If you get caught up in the idea that the market did this in the past and that it is doing this now, you will start to see similar structures in the graphs. So what kind of structure do I see? Let me explain: 1. BLUE BOX: After accumulating inside the box, a 21-22% drop from the box ceiling. Outside the box, horizontal binding with small volumes for 2-5 weeks. 2. Bull run. 3. YELLOW FLAG/PENNIAL: Living the bear to our core with the pennant/flag formation that falls after the end of the bull. 4. PINK BOX: When this pennant/flag breaks upwards, everyone goes into a flying and running away mode, so that things are not that easy. 5. BLUE BOX again. If the same structure occurs again, a drop to 86-82k in the blue box, then a horizontal process by playing dead for 2-6 weeks and then maybe going to 178k or 286k. If you ask how you determined these targets, I copied the previous bull run candles and posted them. The characters, institutions and events described in this story are completely imaginary and have no relation to real people, institutions and events. Especially, they have nothing to do with investment advice. They are things written and drawn in a manner that says let's see what the future will bring. Stay healthy.
BTC YOL HARİTAM

I placed this candlestick chart like this (thinking) that the path Bitcoin followed in the past was very similar to the structure we are in now. In fact, this candlestick structure also matched very well with the channel structure we are currently in (shown in blue). Especially the channel upper band movements are mostly similar. I love taking old candlesticks and making comparisons like this. However, what I mostly see is that the chart does not progress exactly. I still think it can be an example of the breakouts that the price can make. I hope I did not expose the plan of the market makers by publishing this chart. Because if the plan is exposed, they may implement another plan. :=)) Nothing described is investment advice, it is prepared for entertainment purposes only.
TİA; YÖNÜNE KARAR VER ARTIK

It went to the upper band of the Regression Channel in which it has been moving for 120 days and settled there. There are two possibilities in front of it, either it will escape from this channel by going upwards or it will re-enter the channel and target downwards. When we examine which possibility is stronger; • It is currently above the 200-day moving average (EMA) and has also re-tested, • It is above the Magicma indicator and has also re-tested, • It has climbed above the Gaussian indicator and has maintained its permanence (for now), • It has cut the Shell line of the super trend upwards and has lit the Buy signal. Although all these are positive situations, the risk continues because it has not yet been able to move upwards from the upper band of the channel and is currently inside the channel. It would be more correct for those who approach the event as a guarantor to wait for the price to rise above 6.3569. Those who want to make money from this parity should follow this chart closely for a few days. What I have explained here is not investment advice. Good earnings to everyone.
BRETT, ÇOK GÜZEL ÇALIŞAN DÜŞEN TREND İLE VEDALAŞIYOR.
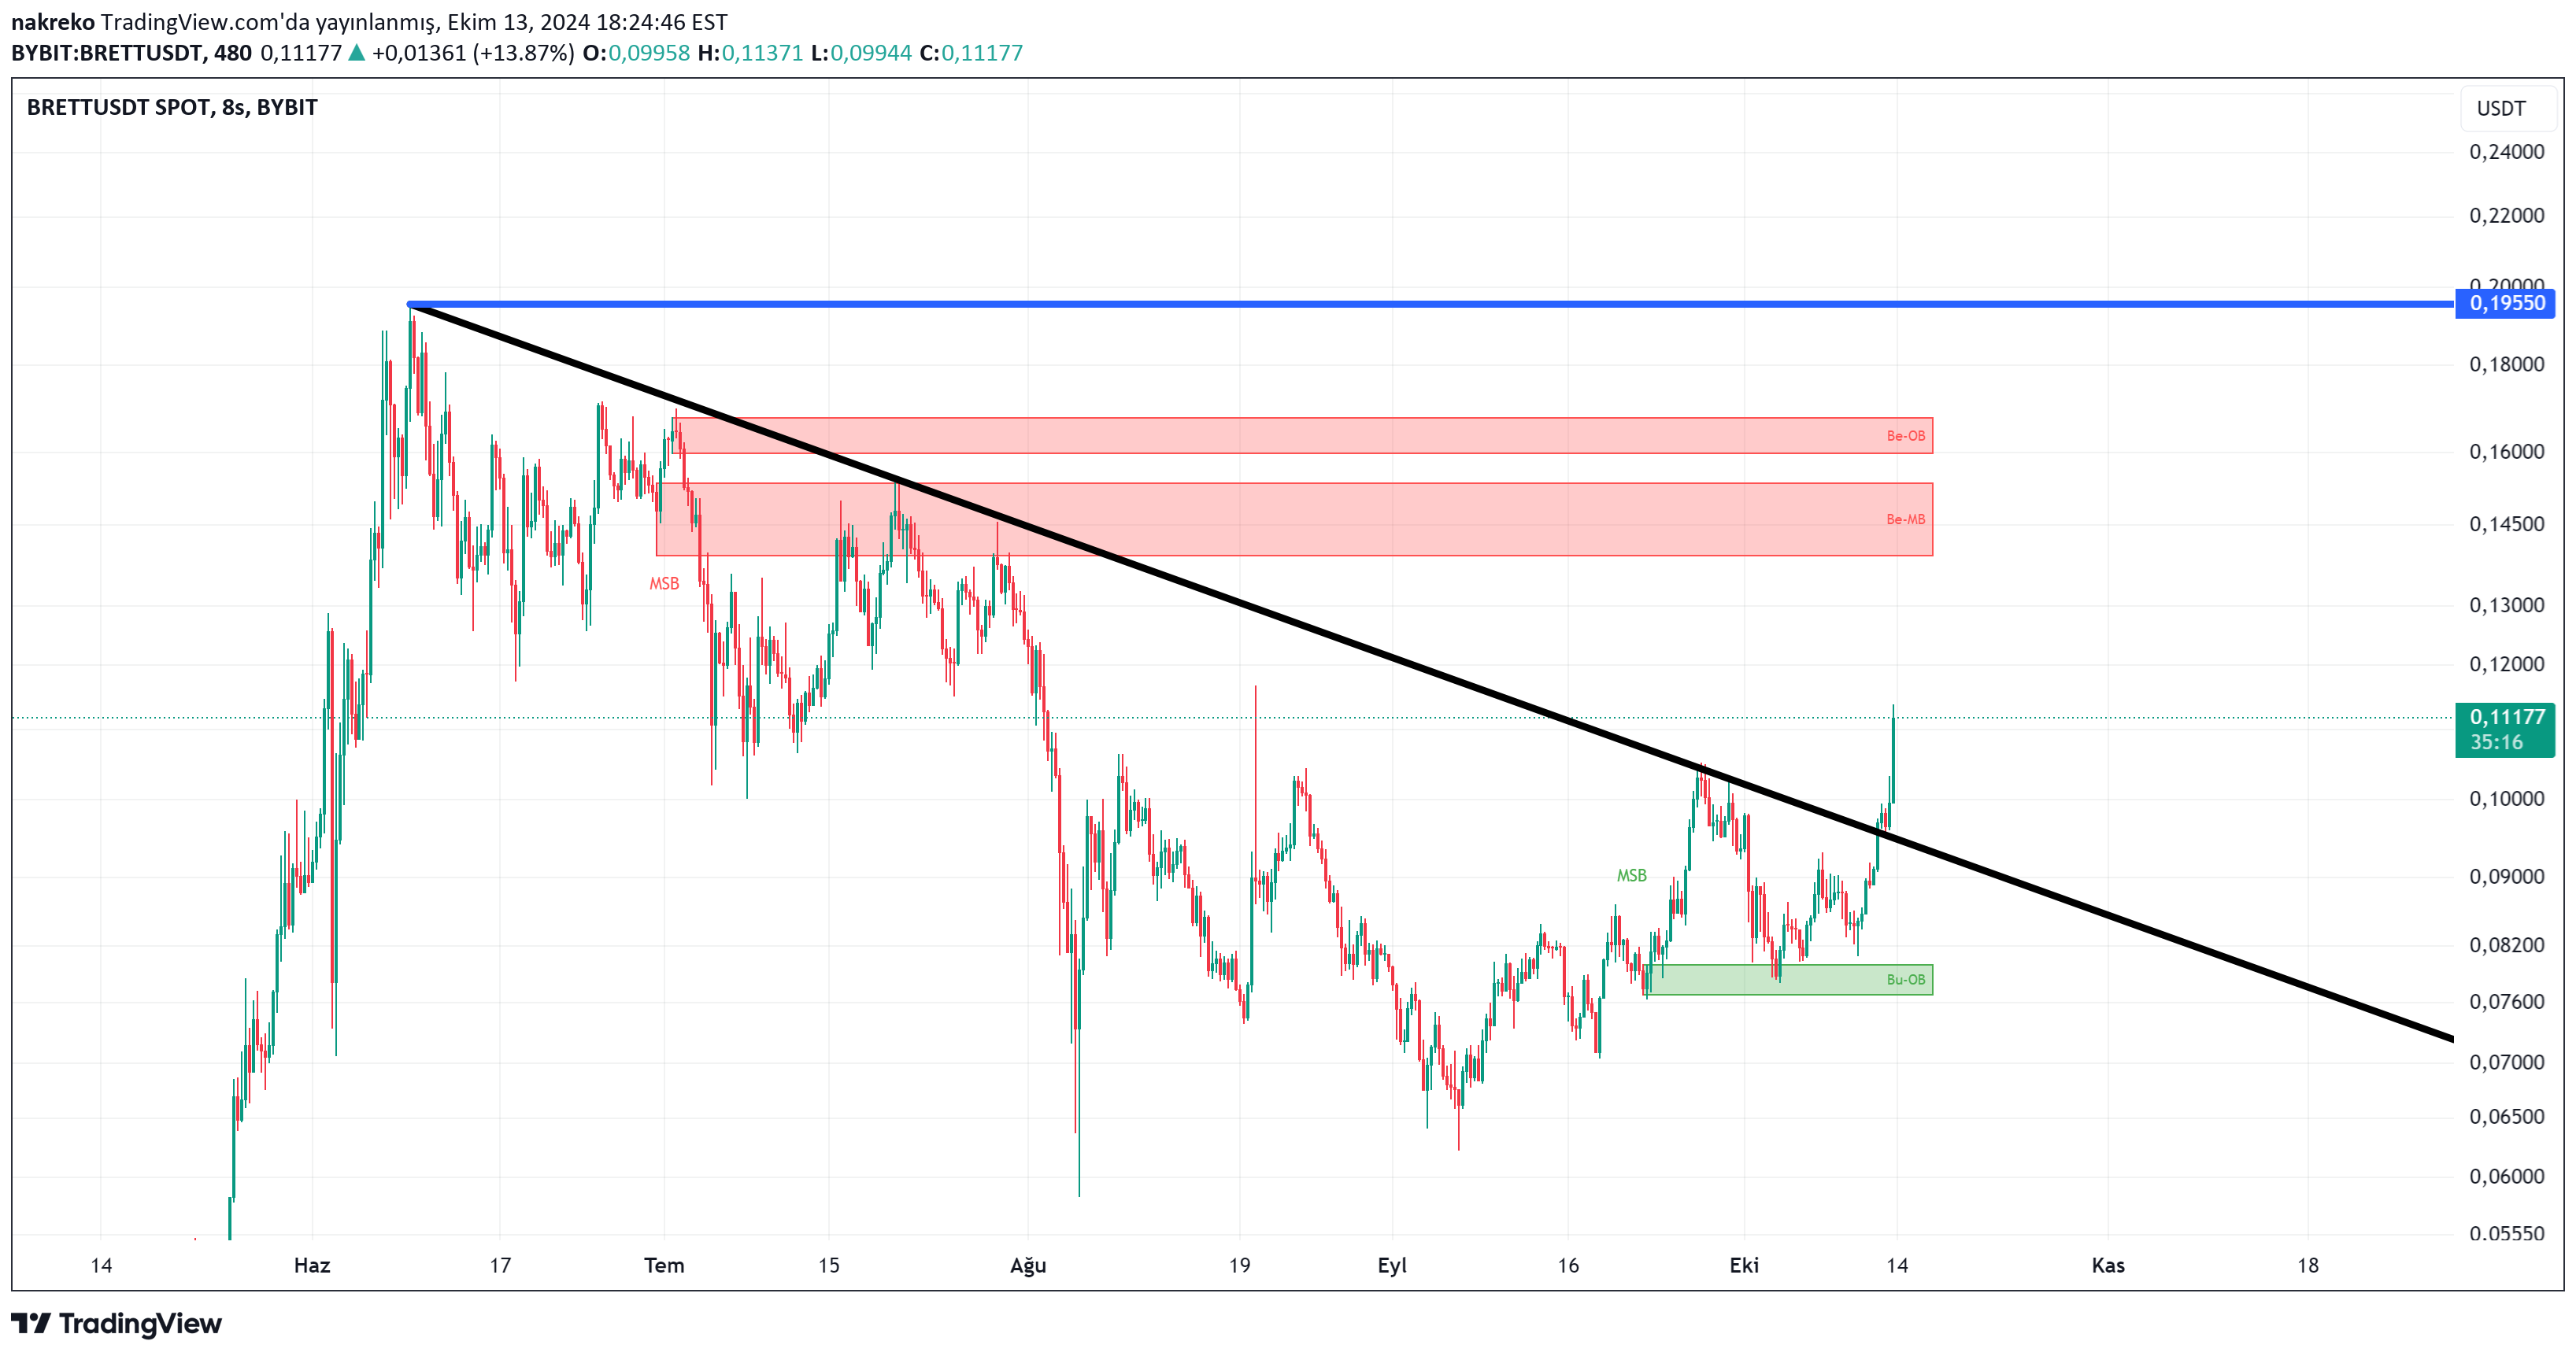
A downtrend that had been working very well so far had been broken upwards, but it was eagerly awaited whether this movement would remain fake or not. With voluminous and long green candles, this trend was broken and it was confirmed for now that the target was up. If it is asked where the target would be, the red OBs above would be the first target areas. What is being said is not investment advice. Good luck.
TURBO. FİNCAN NEREDEYSE HAZIR, KULPUNUDA TAKARLAR MI?

The flash name of recent months, TURBO, is very close to surpassing its all-time high (ATH). When we look at TURBO from a distance, a huge cup is almost complete. If the Cup/Handle formation, which is one of the classic formations, works, a decline can be expected to form the handle. I have put the graphical explanation of the Cup-Handle formation on the right side as a figure. Those who do not know the formation can examine it from there. If this formation works and the formation reaches its target, I have stated its probable target above. Of course, there is no such thing as 100% certainty in the formation of any formation or in reaching its determined target. Time will decide whether this will happen or not. Let's wait and see. Nothing explained is investment advice. Good luck.
BTC, DÜŞEN KANAL YİNE YAPTI YAPACAĞINI
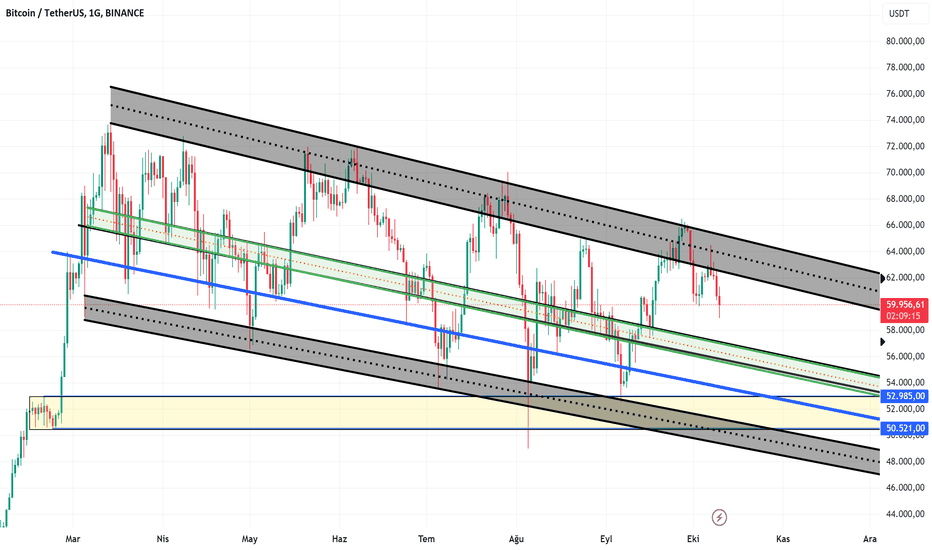
Let's look at BTC in the daily timeframe. We have a falling channel that has worked wonderfully for 210 days. You can see how well the upper and alt bands work as resistance and support. When we take a photo and look at the situation; - We see that BTC has been slapped for the second time by the upper band that it tried to break with a weak attack, - The intermediate uptrend that started from the channel alt band has been broken downwards. If it is going to do what it always does, the first thing that comes to mind is that it should visit the channel alt band again. I THINK that BTC will fall further from here and start its rise from here, it will not touch the channel alt band that everyone expects. Instead, the channel middle band (Green Channel) will be a nice support level. If it cannot stop the fall here, it will touch a alt band (Blue line) that has worked perfectly before and start its rise from here. The bottom prices will change depending on when it touches these bands. Of course, there is no guarantee of this. Maybe it will make another small drop and break the upper band again. Instead of gambling about whether it will happen this way or that way, it is necessary to take precautions according to possible situations and play the game according to the rules. What I said is not investment advice. Good luck to everyone.
BTC Çok Kritik Destekte. Dikkatli Olunacak Zamanlardayız.

Let's examine the Bitcoin chart in the daily time frame. As can be seen, we seem to be holding on to a (blue area) that has worked very well as a support/resistance area since the past. When looked at carefully, this area also coincides exactly with the Supertrend buy line and the Gaussian Channel middle band at the moment. In other words, this is an important support. If the support does not break and BTC continues upwards, there is no problem. However, if this support is broken on the daily, it may turn upwards from the alt support around 59200 and give a retest. If the blue area, which is support, is not broken upwards, the downward decline continues and we may visit the painted areas below in order. If BTC decides to fall, there will be an important support between 54-56k. Although the RSI seems to have turned upwards, it is still below 50. If the decline continues, it can be expected that the RSI will reach values of 20-30. Look, I am not saying that we will fall from here. If the supports are broken, I say follow these areas. What I say is my personal opinion and does not contain investment advice. Stay healthy. Lots of profit.
Enzyme MLN ; BİR FİTİLDE BİZİM İÇİN AT.

We examine the chart on a weekly time frame. It has moved in a constantly falling channel for almost 2 years. Recently, the channel has moved closer to its upper band. Although the price constantly decreased, RSI and MACD, on the contrary, increased and gave a positive divergence. It should not be forgotten that this positive discrepancy has continued for a period of weeks and for almost 2 years. It is a very positive situation that the price is above EMA 21 (Blue line). However, the second average EMA that needs to pass is 55 (Red line). The fact that EMA 55 matches the channel upper band exactly shows that this will be a strong resistance. When we look at the price chart, we see that MLN likes to pump upwards. Coins like this often break trend lines with very high candles. So, you wait for it to break the trend and then retest the trend so you can buy it, but you wait in vain. I mean, even before approaching the trend line, pump candles may appear like the previous ones. If this happens again, it may rise to 41.18. A coin not to be missed by those who say they like risk. HOWEVER; If the upper band of the channel is not broken, there may be a movement towards the lower band of the channel. The first resistance seems to be around 14.80. Of course, what I say here is entirely my thoughts. There is no such thing as necessarily going to happen. It is not investment advice. Abundant Profits.
AAVE Kopta Gel Aslanım
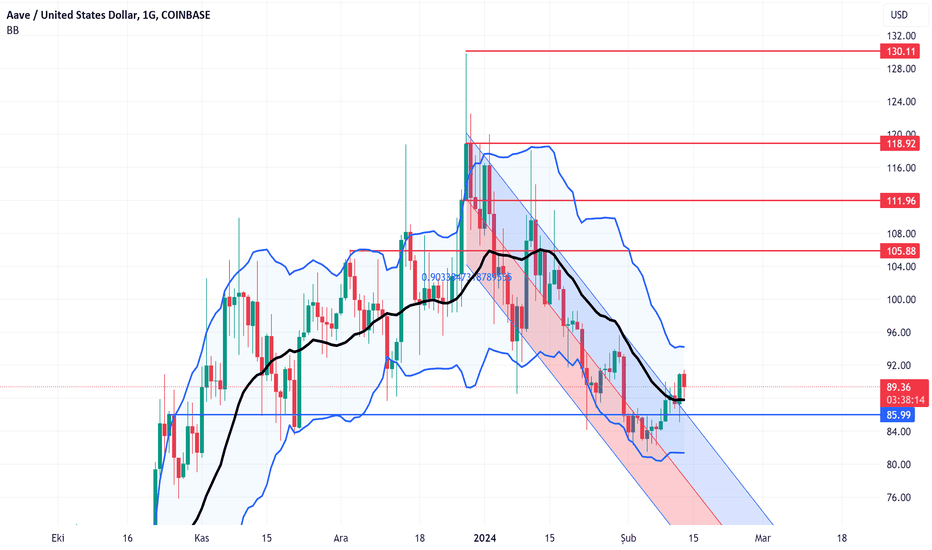
Let's examine the chart in the daily time frame. It broke the regression trend and Bollinger middle band with a voluminous and enthusiastic candle. Now he is giving a nice retest to what he broke. If the market allows and the price advances, I have indicated the TP points with a red line. This scenario will be valid unless the day is closed below 85.99. Of course, nothing is 100% valid. So make your own decisions. What is described here is not investment advice. abundant profits.
Disclaimer
Any content and materials included in Sahmeto's website and official communication channels are a compilation of personal opinions and analyses and are not binding. They do not constitute any recommendation for buying, selling, entering or exiting the stock market and cryptocurrency market. Also, all news and analyses included in the website and channels are merely republished information from official and unofficial domestic and foreign sources, and it is obvious that users of the said content are responsible for following up and ensuring the authenticity and accuracy of the materials. Therefore, while disclaiming responsibility, it is declared that the responsibility for any decision-making, action, and potential profit and loss in the capital market and cryptocurrency market lies with the trader.