
mrnikofrench
@t_mrnikofrench

What symbols does the trader recommend buying?
Purchase History
پیام های تریدر
Filter
mrnikofrench
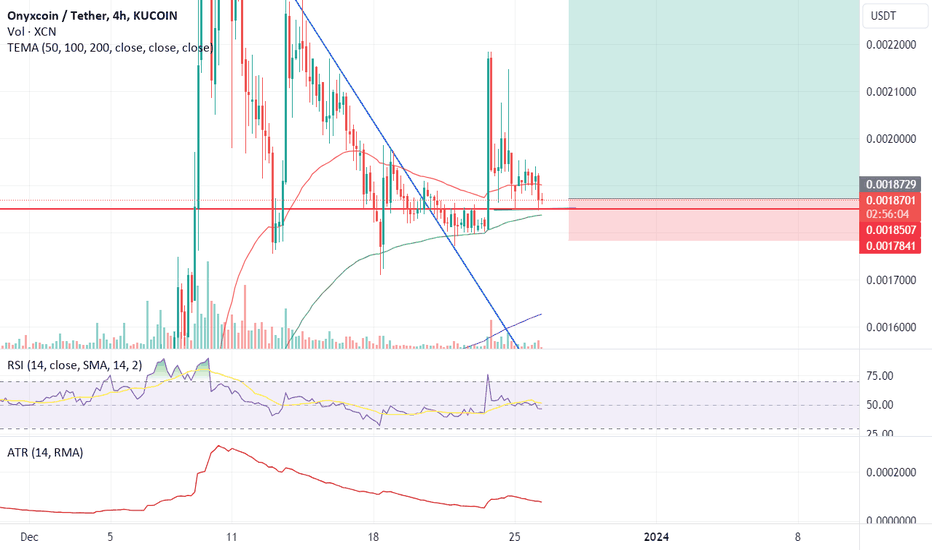
Buy Zone

This coin is def in the buy zone. It looks juicy in the daily and the weekly. Great opportunity to load up the bag for the next run up. Also so many other alts are on the buy zone. Mind you the time frame is here is daily and weekly, so, good returns will be around dec 2024 or 2025. Not a financial advice.
mrnikofrench
Correction

This dip might look intimidating, but it looks like it is still within the range on the daily macros since we are still bouncing back and forth in the .2618 and .3618 fib levels. I am seeing three scenarios here that could play out. 1- It could be a reverse head and shoulder where the shoulders sit at the $60,900 to 62,900 range. This would be a local floor on how far the price can dip. 2- This correction could be more extreme and we could see a price movement all the way to 56,800 to form a double bottom before taking off to new all time high. If this plays out, it would take a little bit longer to recoup back to higher prince range. This also means there is more time to accumulate and dollar cost average. 3- The last scenario is very bearish and we could see a price decline all the way to $44,400, but thus far, this is unlikely to happen since we still don't have evident signs of going there. In summary, the proffered scenario is the first one. We'll most likely see bitcoin forming a bull flag or a pennant before continuing to 80k range.Not a financial advice.
mrnikofrench
On Track

I know alts are flying up in value and this one is taking a little bit longer, but I suggest you give it some time to catch up to other alts. It'll eventually get to 30S range.
mrnikofrench
Bullish Pennant on the 4H chart.

It looks like there is a bullish set up on UMA coin which might translate to a price increase to the upward. My initial target would be at the 100 fib channel line around the $6.10 range. The confirmation for the price to continue upward is the 4hours long red candle that was followed by a short green candle which form a Piercing pattern (Bullish). Stop loss should be below the wick of the green candle around the $4.28 price mark. Not a financial advice.Stop loss was reached. But there is a better entrance around the $4.06 range since the red horizontal line is acting as a support. Same take profit target. Trade is closed.
mrnikofrench
Chart Setup Looks Good for Longing

This chart looks like it has a good setting for trading and longing this coin. There is a bullish divergence on the 3D chart. Preferably, an entry point should be at the place of liquidity (Green box at the bottom) especially for leverage trading so stop loss can be set below, but it is not a big deal if this takes off as there would be multiple entry points along the way for scalping and making a profit as the price increases. It is easy to trade a coin when you know the destination and it looks like the destination of this is the red box at the top. Let's see how this plays out. Not a financial advice.
mrnikofrench
20 percent drop coming

It looks like Mina is topping with a double top and bearish divergence on the 4H chart. A 4H bearish candle also closed below the channel lower support as shown in the chart. A short entry at the retest might be a good option to play this out .The target will be a 20 percent drop/ profit at the $.97 price area. Not a financial advice.It is getting closer and closer to the target.It hit the target. Now waiting for and entry to the upside. This trade is closed.
mrnikofrench
Showing Weakness

Tia coin's price action and RSI is showing weakness on the chart. High chances it might go to the $15 range if it cannot close above $19.8 to $20 on the hourly candle. It is also throwing spinning top candles which are bearish. Be careful of a liquidity grab spinning top candle to intend to to trigger your stop loss before dumping. Let's see how this plays out. Not a financial advice.The trade is going in the direction discussed at the beginning with a target of $15. Also this target range might be a good point to long TIA coin since it touches on the 100 fib extension level.I Closed the position with less profit than expected because I spotted a hidden bullish divergence on the 1H chart. The Price might reverse to the upside with a target of $21.10. Risk management is key to survive in this market. So, it is better to exit with less profit than no profit at all or even losing money. It is ok if the price continues down. A new point of reentry will be found. Safe trading.
mrnikofrench
Bearish

Mina is looking bearish on the daily by forming a bearish divergence. RSI is at the overbought zone. It is almost time for a price action reversal with a target in the early .9s. Not a financial advice.It touched the .95 cents level and bounced back up. Target reached.
mrnikofrench
4 Hours Chart Indicate a Price Action Reversal to the Upside.
Keep an eye on this chart. It looks like it is making a bullish hidden divergence on the 4 hour chart. If the horizontal red line drawn holds true, then there is a potential of a reversal price action to the upside.Not a financial advice.I think it is better to trade this coin using spot only because It moves slowly.
mrnikofrench
Short term bullish

Bullish short term as shiba is making a bullish hidden divergence as shown on the chart.Not a financial advice.This was a short term, so some profit was locked before it dumped following bitcoin.
Disclaimer
Any content and materials included in Sahmeto's website and official communication channels are a compilation of personal opinions and analyses and are not binding. They do not constitute any recommendation for buying, selling, entering or exiting the stock market and cryptocurrency market. Also, all news and analyses included in the website and channels are merely republished information from official and unofficial domestic and foreign sources, and it is obvious that users of the said content are responsible for following up and ensuring the authenticity and accuracy of the materials. Therefore, while disclaiming responsibility, it is declared that the responsibility for any decision-making, action, and potential profit and loss in the capital market and cryptocurrency market lies with the trader.