
moneyflow_trader
@t_moneyflow_trader

What symbols does the trader recommend buying?
Purchase History
پیام های تریدر
Filter
moneyflow_trader
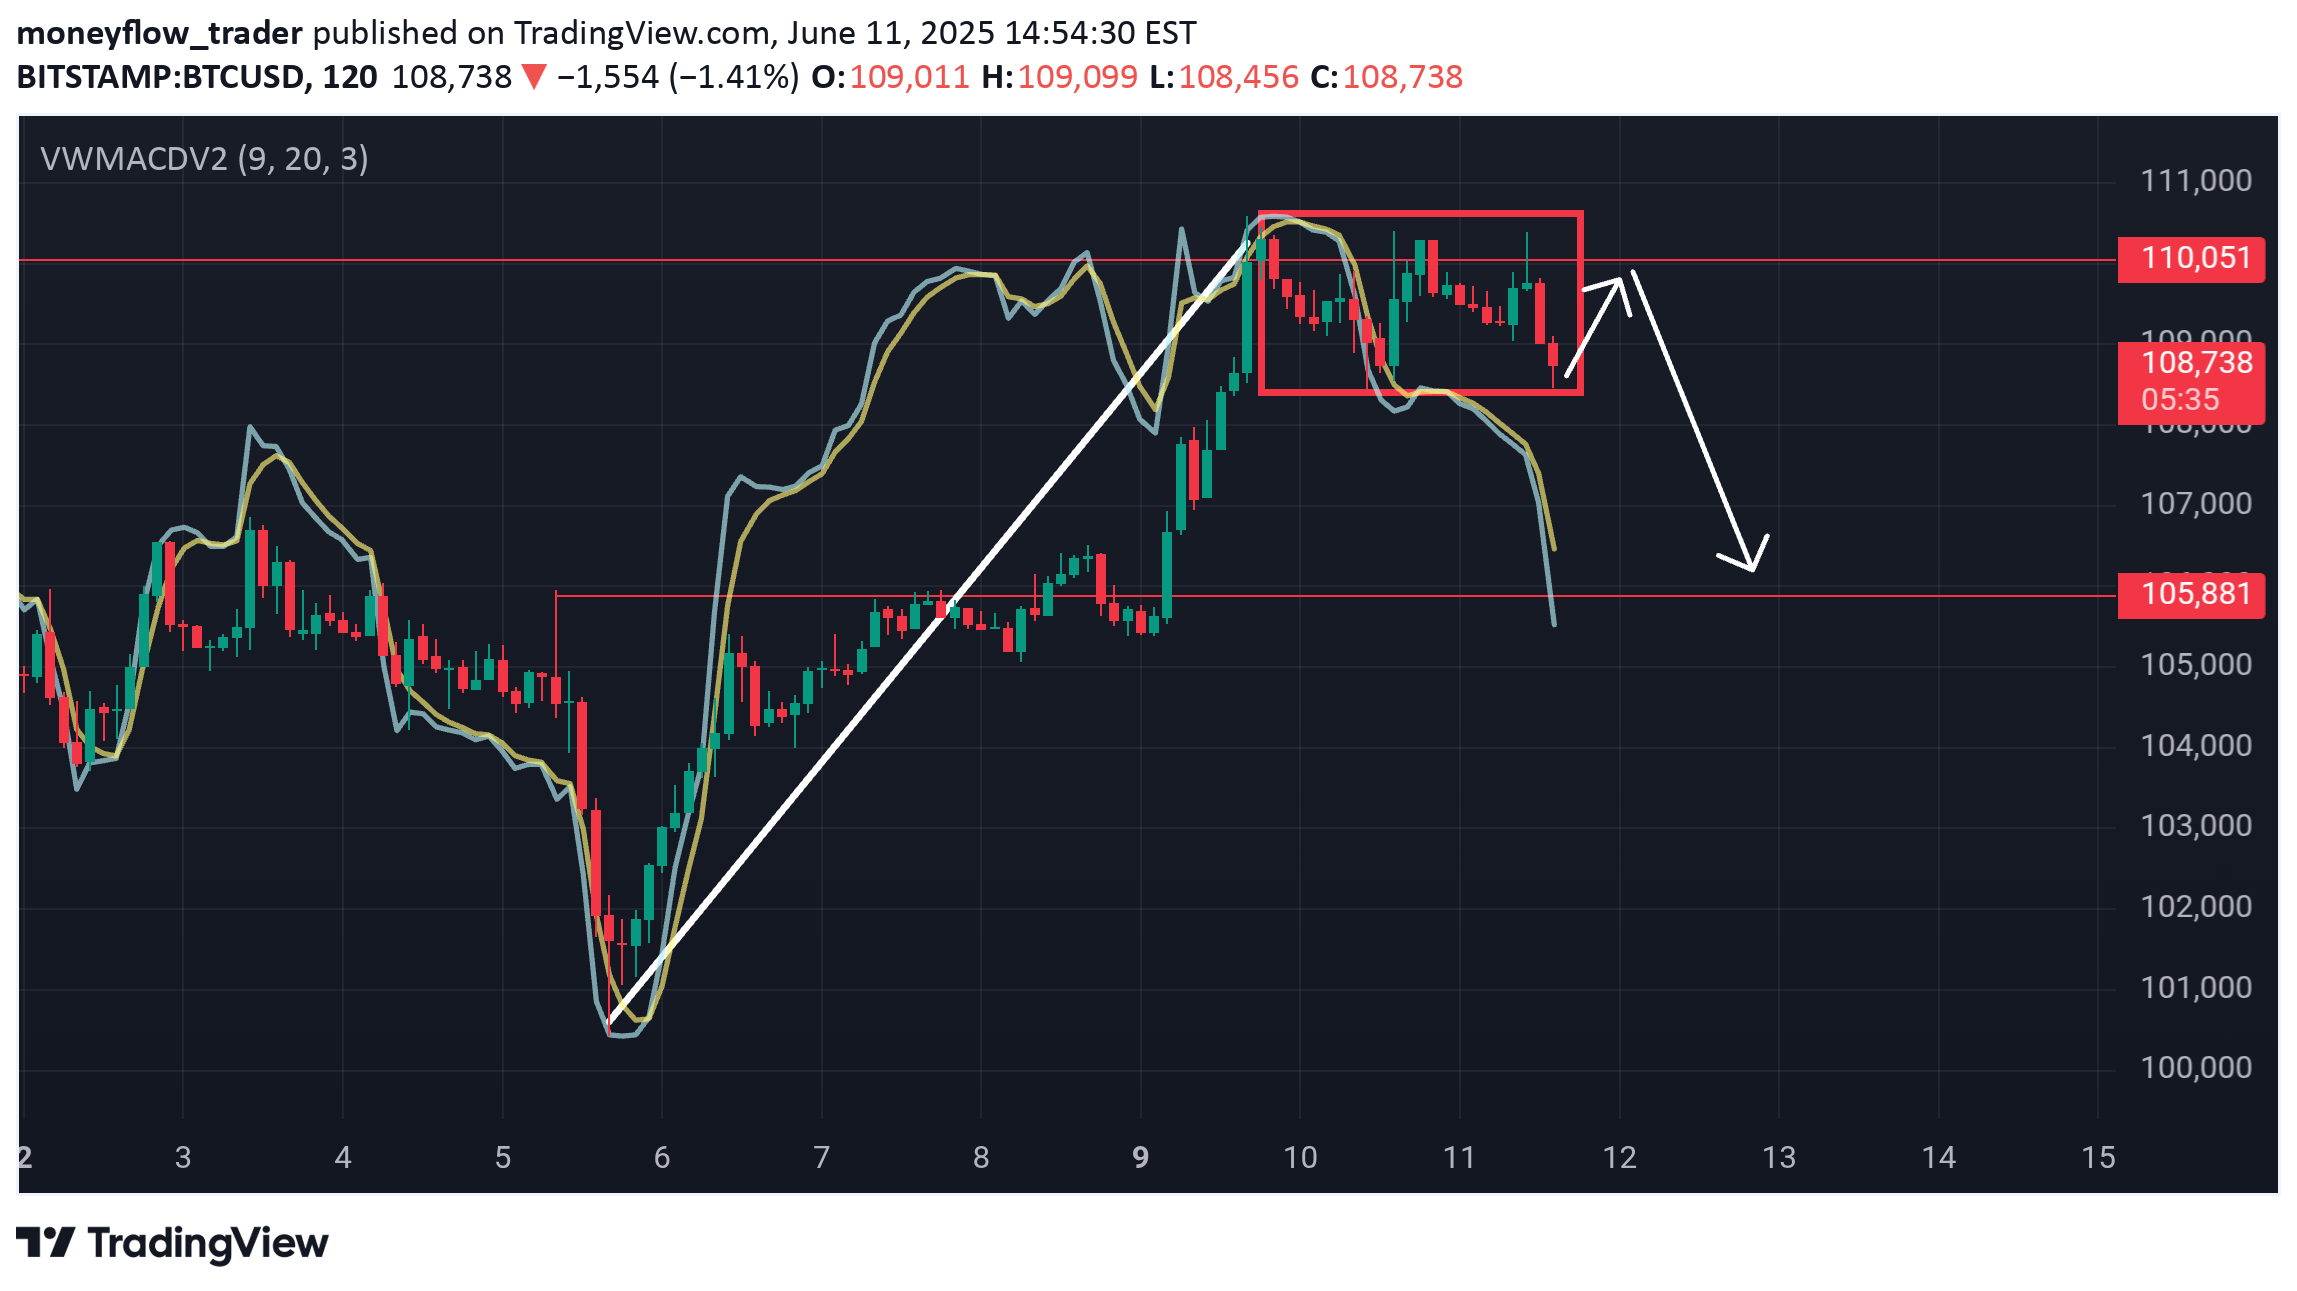
Bearish Money Flow looking for 101k
Per 2hr chart I can see a bearish divergence as smart money is unloading. This is is a liquidity grab by the whales. I eventually see Bitcoin retracing back to 98k. I will layered my charts gradually for you to review... disclosure I do have a short position active.
moneyflow_trader
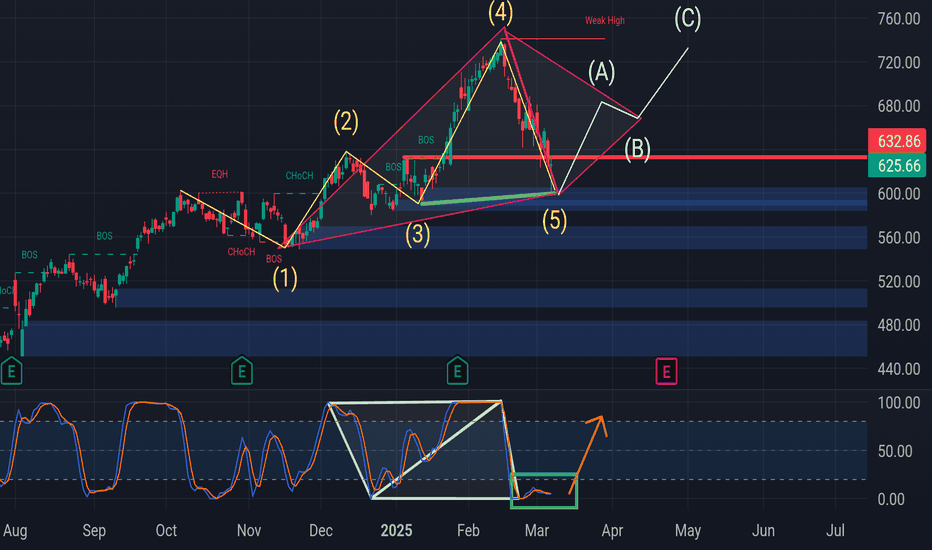
Bearish Elliot Triangle Wave $250 target
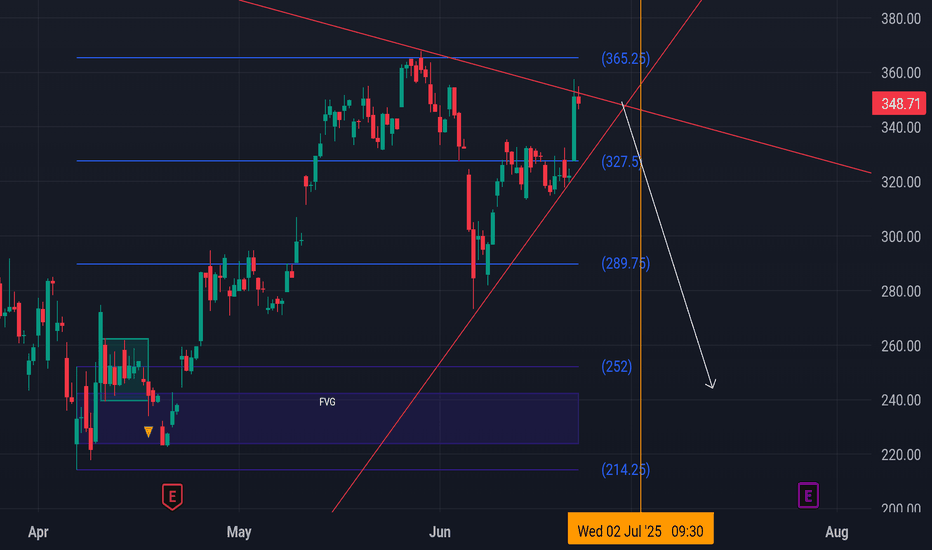
Observing Tesla Chart, I noticed a bearish 4hr Elliot Wave A-E. The flow is also bearish and lines up with the bear sentiment. Looking for a bearish Apex Breakout..
moneyflow_trader
108k retest
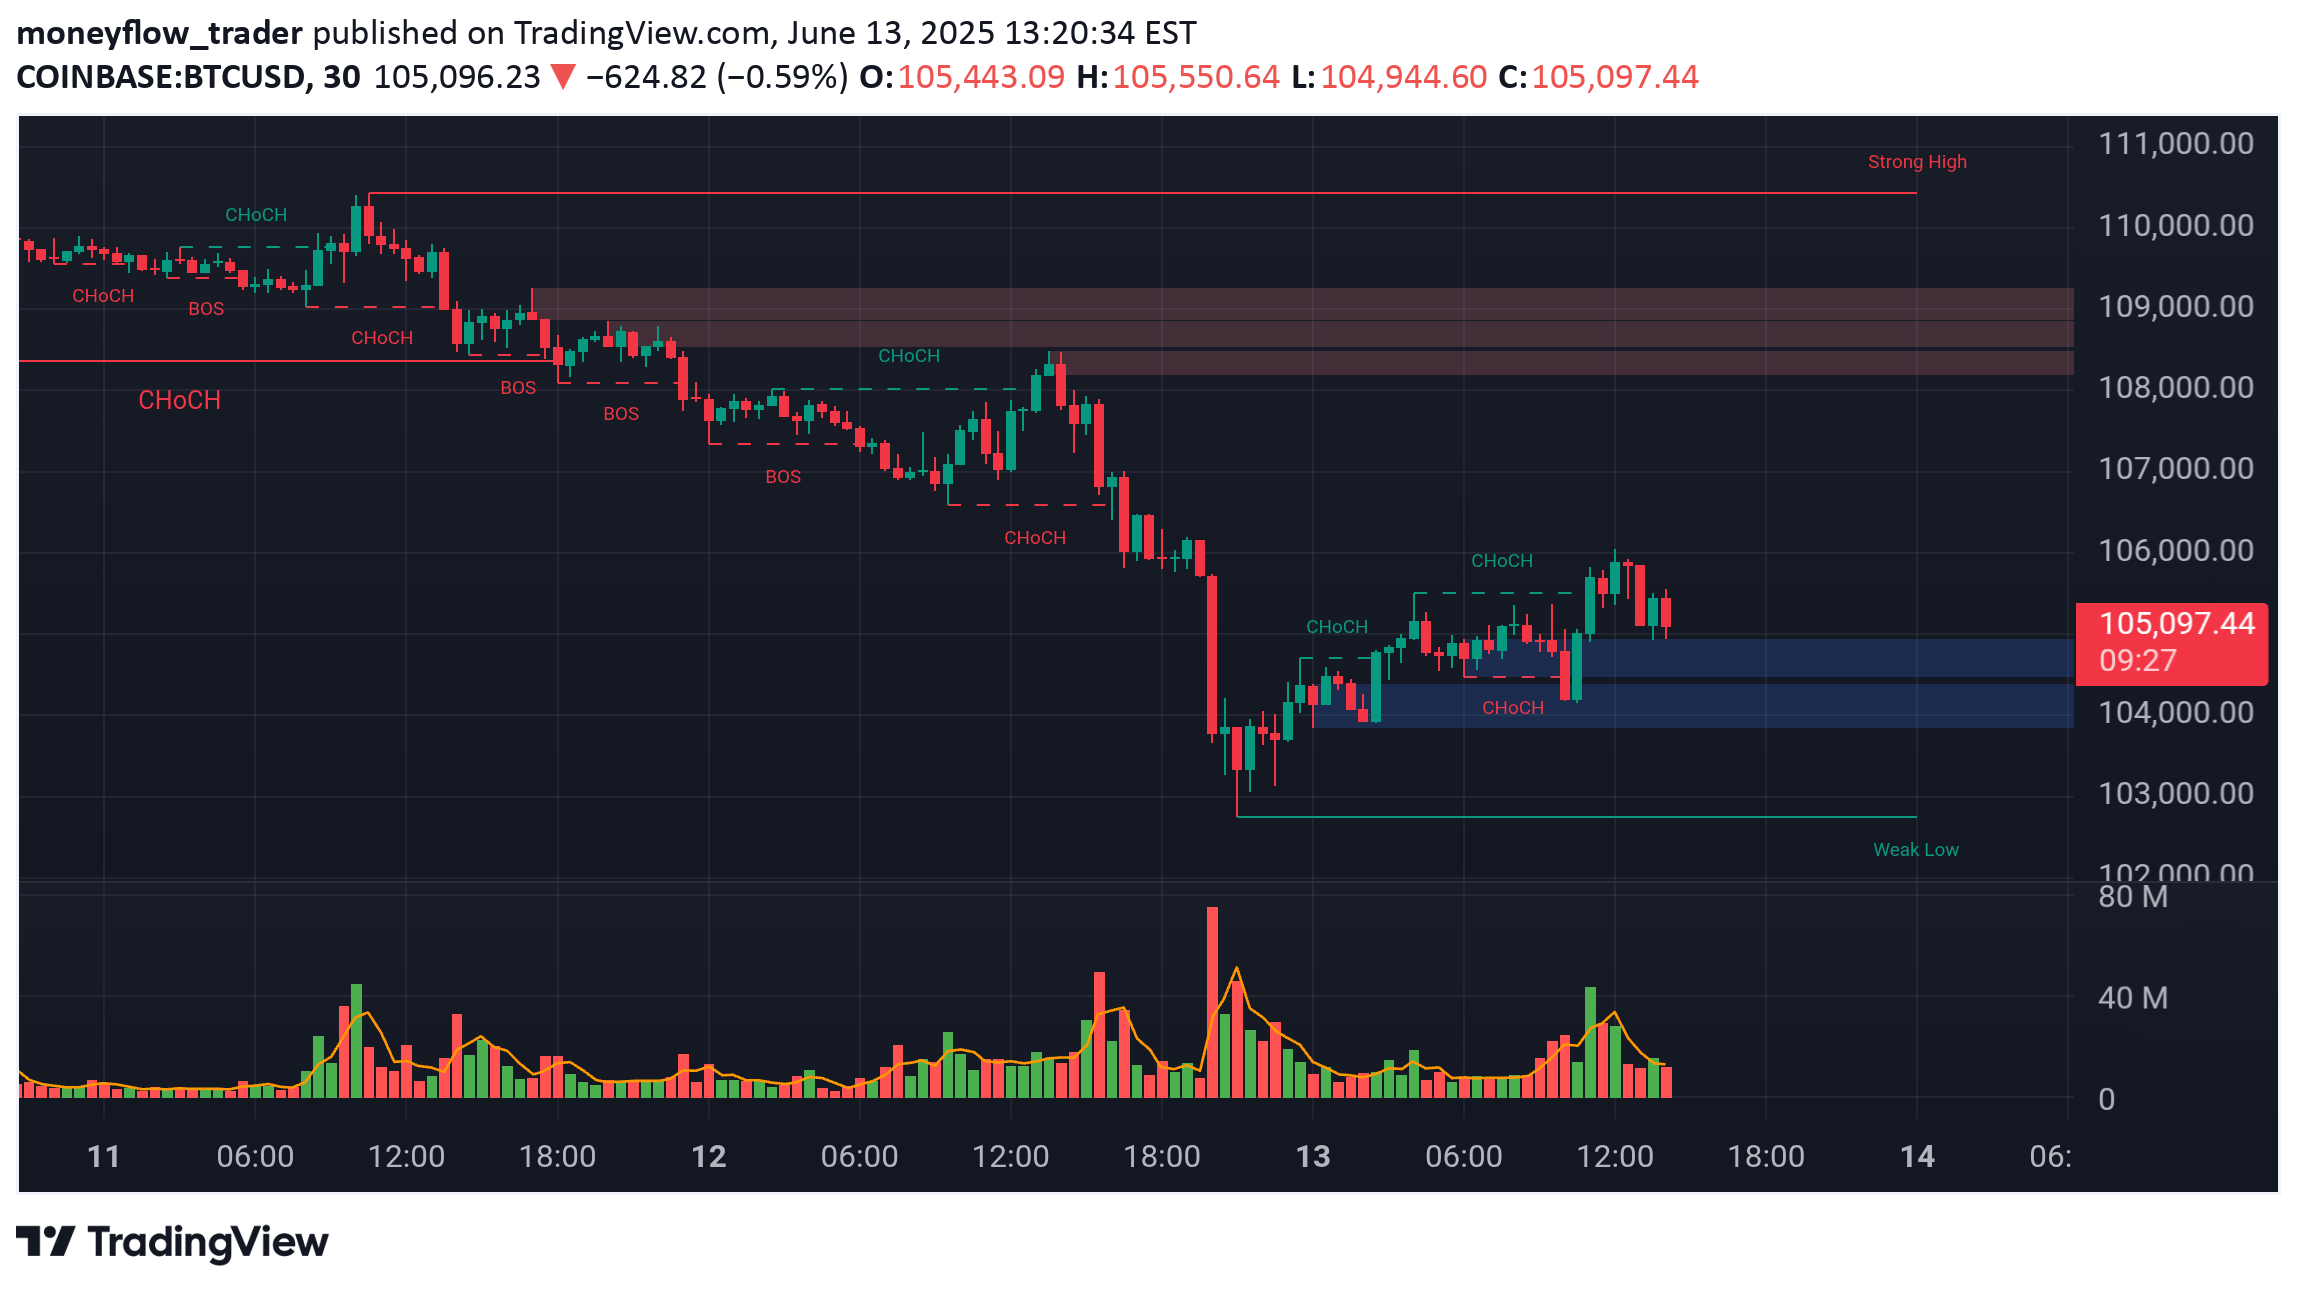
PA below AD, and Flow volume.. looking for buyers to retest sell off levels
moneyflow_trader
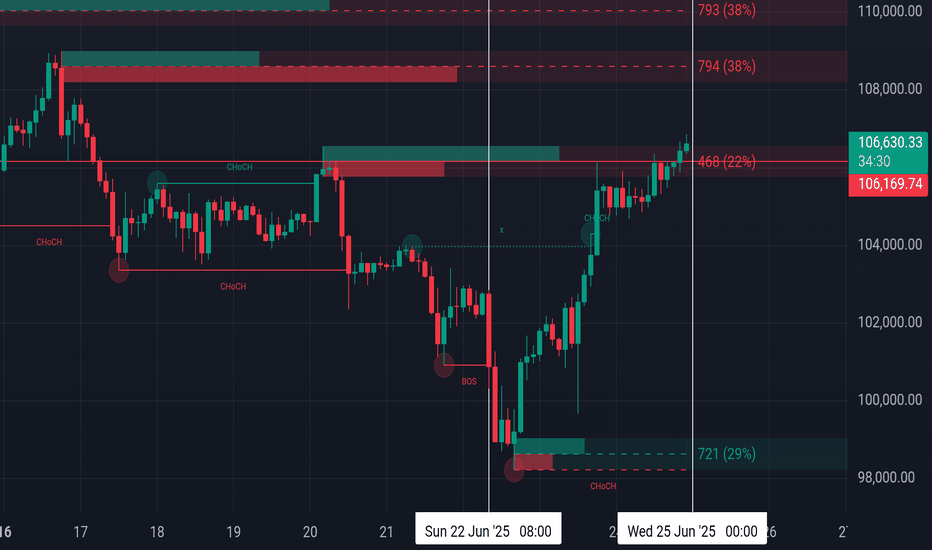
False bull flag breakout
Looking for a lower retest 105k. Target 103k.. also see a hidden bear flag on the flow.
moneyflow_trader
Bullish abcd set up
I see meta starting an uptick from the 5th Elliot Wave. This appears to be an impulse buying wave, which appears to be inside a bullish abcd set up, which is also correlating by the stoch rsi (abcd) set up
moneyflow_trader
BTD to 3200

Whale MFI shows an AD showing an ascending triangle to 2960. Gold will look to breakout to 3200 and likely peak. Buyers from 1600 will look to exit.. will breakdown analysis further. 4hr ascending whale mfi index/AD will continue to daily time frame.. however smart money exit due to liquidity and fomo, from bitcoin drop.. charts will follow. Not financial advice or trading advice. Just sharing my analysis. Thanks for viewing
moneyflow_trader
Short to box target 2390

Gold failed retrace to breakout on 1hr, showing overbought conditions. Long bear flag set up, will be a repeat set up
moneyflow_trader
Short above orange level

Gold facing a c wave sell off. Shorting above orange level. Bear flag compete with br3ak of 2364. 2294 long short target
moneyflow_trader
Lowering my target to 2300 Gold

We're still short from D leg with a 2340 Target. Which is right at thr .618 fib for the E leg. You could get s bounce from 2340 at the .618 fib, I will revaluate Gold st that level. Additionally a bounce from 2340/.618 fib level could create a buy opportunity which leads to a greater short entry. Gold is far too extended, and I can see folks are buying gold at the top of a wedge. The stoch rsi is oversold on the monthly. Imho Gold needs to continue to retrace to 2300.. Wait for confirmation and see if 2340 holds for bounce before shorting to 2300, that bounce could provide great entry. More updates coming
moneyflow_trader
Retrace to 2340 set up

1. Stoch rsi oversold 2. Bearish wave count (current D leg, looking for retrace to E leg at minimum) 3. Bearish AB=CD pattern set up at bottom of the chart by Stoch RSI & VWMACD 4. 2360 was my sell zone from 2325-2360. This level must hold as support, or gold flushes to 2300.. Also gold bear etfs supports a gold retrace, along with bearish sentiment on GLD in which I have a sell set up for $210
Disclaimer
Any content and materials included in Sahmeto's website and official communication channels are a compilation of personal opinions and analyses and are not binding. They do not constitute any recommendation for buying, selling, entering or exiting the stock market and cryptocurrency market. Also, all news and analyses included in the website and channels are merely republished information from official and unofficial domestic and foreign sources, and it is obvious that users of the said content are responsible for following up and ensuring the authenticity and accuracy of the materials. Therefore, while disclaiming responsibility, it is declared that the responsibility for any decision-making, action, and potential profit and loss in the capital market and cryptocurrency market lies with the trader.