
mmulutug
@t_mmulutug

What symbols does the trader recommend buying?
Purchase History
پیام های تریدر
Filter
ADAUSDT | Kırmızı Liste Özeti

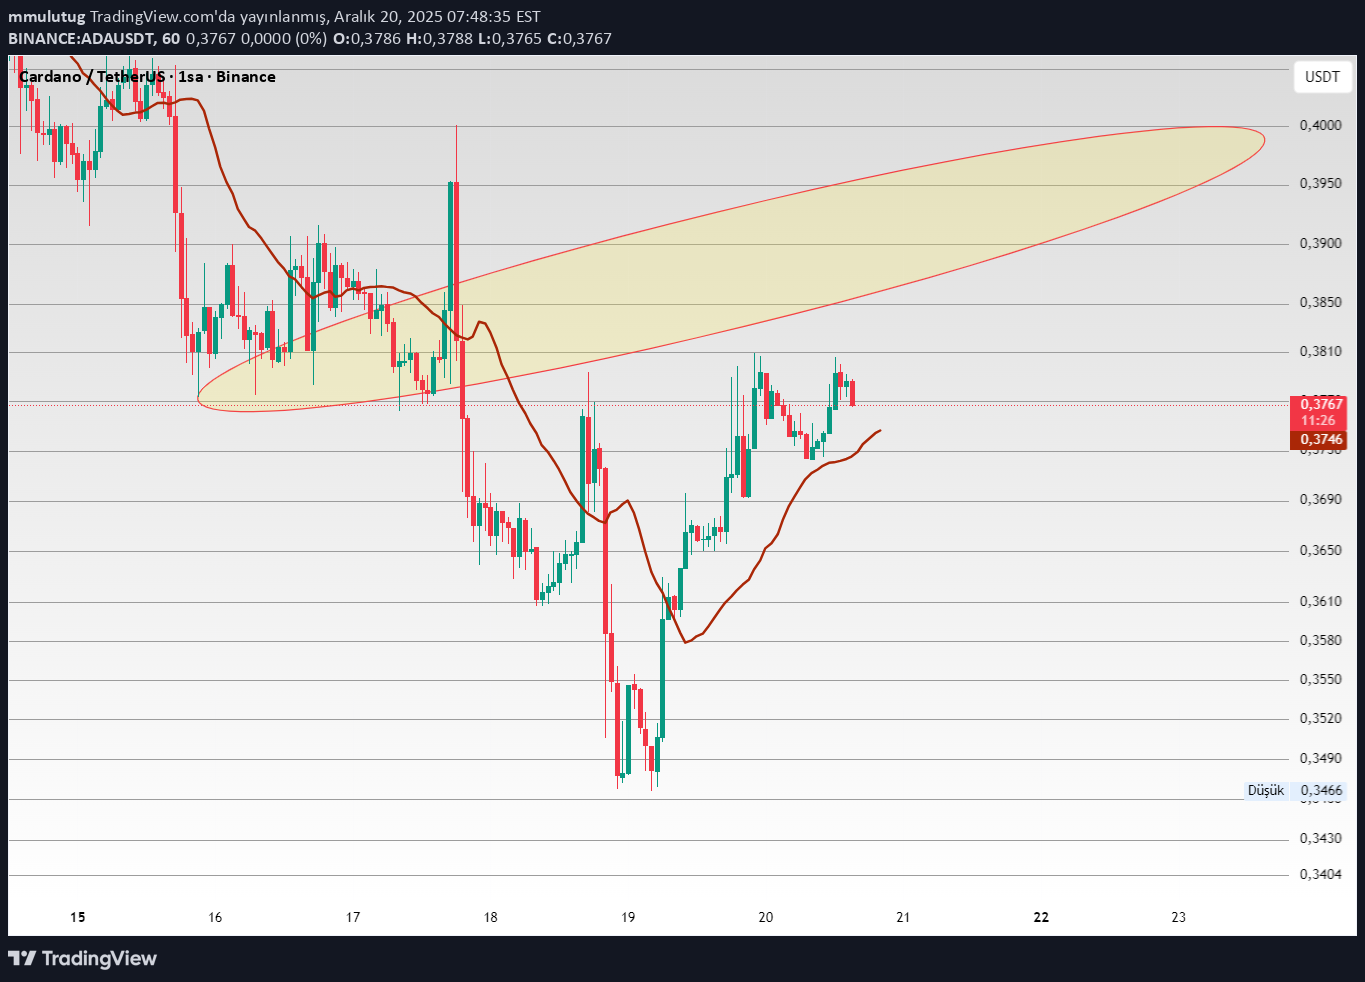
🔴 ADAUSDT | Red List Summary On the ADA side, the structure carries two possibilities at the same time. 🔸 Low probability: The current arc is not yet completely closed. So the possibility of trying a alt remains on the table. This is not weakness; need for completion. 🔸 Holding power: On the other hand, the price does not leave it easy in its region. This shows that there is a desire to hold on rather than sell. So even if it sags down, it is unlikely to be permanent. 🔸 Balance sentence in Sagittarius: ADA he is neither running away nor attacking at the moment; He's testing his place. 📌 Red list note: This structure is not a sudden decision It requires patient monitoring. It will be lower, but it is not necessary to deteriorate. As an idea. Followed, not rushed. If you want, do this in the next step Brief comparison with ETH or we can open it as ADA-XRP balance difference.
BTC | Kırmızı Liste Notu (2026 Ana, 2029 İma)

🔴 BTC | Red List Note (2026 Main, 2029 Implied) The structure visible in this study is the main arc until 2026. All readings and time signatures on the chart are deliberately limited to this maturity. 🔸 But this should be noted: The geometry of this main spring is linked to a family of longer springs. So the action that appears here is an interlude, not the final story. 🔸 Remarkable detail in the spring language: There are some springs, It looks like it's finished on the chart, but it doesn't completely drain its energy. This building is one of them. 🔸 Sentence in red list style: As much as what is said in this graph, There is also an unspoken continuation. 📌 Note (intentionally closed): A further forecast line was excluded from this study. The reason is not that it is missing, but that the time has not come. 🔴 Red List principle: What is seen is spoken, invisible note is taken. If you're ready, next: 👉 ETH Shall we continue? Or ADA–XRP pair?
Yay la Gold 8 1

((Yayla Gold 8 1 (Idea, give interesting information about gold, but don't let it be keel, if there is a question about it, I will send you a message, other red list server is in the mood,, )) Ok 👍 For **“Yay'la Gold 8/1”**; I'm leaving a text below that is **full of information, down-to-earth**, but **like a red list server**. If a question arises, we can walk through it easily. --- ### **Gold with Yay | 08.01 – Idea** On the gold side, **time-curvature relationship** is more prominent than classical lines. In this arc, we look at **at what speed and with what rhythm** the price is moving, rather than "where" it is. 🔸 **Noteworthy point:** In recent movements, gold is making an energy-accumulating spring oscillation instead of moving in a harsh direction. This type of structure generally indicates two things: * What a strong continuation * Or a shorter than expected but clear reversal move 🔸 **Spreaded reading:** * Current spring copies the **internal tension** of previous main springs * As long as the candles remain in the arc, it does not mean "indecision", but **controlled waiting** * If it extends beyond the arc, the movement will be **accelerated**, not smooth. 🔸 **Technical but understated information:** These types of springs in gold often react **not on the same day as the dollar index**, but with a delay** of 1–2 days. That's why the "it happened immediately/it didn't happen" comment is misleading. 🔸 **Red list note (server taste):** This structure is **not for transaction chasing**, > “not to be late when the movement starts” > is an arc followed for. 📌 **Summary:** Gold isn't looking for direction right now, it's **running its time**. Harsh comments that come before the arc is completed are usually premature. > I share it as an idea. > If there is a question, we will open it one by one via the spring. --- If you want, also this * **shorter (TradingView description)** * or **I can also make a version suitable for video narration**.
yaylarla Kırmızı liste 2026 01 02 /2

Red List with Springs – 02.01.2026 /2 In this section, BTC, ETH, XRP, ADA and AVA It was discussed from a long-term – live broadcast perspective. In each product: The great arc that carries the cardinal direction, Intermediate springs that force the process, Movement areas that narrowed or widened over time were read together. This study: not a short term reaction, It is about understanding the long-term portable aspect. 📌 Red List = area where risk + opportunity exist simultaneously 📌 Sagittarius = process that unfolds patiently 📌 Live analysis = continuous reading, not instantaneous BTC taken as the main reference, Other products were evaluated on spring compliance and separation. This is a work of thought. It's not the level, it's the path that tells.
yaylarla Kırmızı liste 2026 01 02

with springs Red list 2026 01 02 I interpreted until btc gold silver oil dxy Red List with Springs – 02.01.2026 In this study, within the scope of the Red List I covered Gold, Silver, Oil and DXY arcs in the main frame. Directional pressure, spring jams and possible transition zones were processed individually for each product. The section up to BTC, It was used as a reference to read the overall risk appetite and cross-over effects. No separate evaluation was made for after BTC. This is a work of thought. Springs; for reading time, speed and direction together. It does not tell the exact level, but the range of action. 🎯 Red list = attention 🎯 Arc = process 🎯 Reaction = becomes clear over time
BTC – Idea Only | Yay Perspective (Test)

BTC – Idea Only | Yay Perspective (Test) This is not a trading signal or financial advice. This is a personal observation based on price behavior over time. Instead of sharp levels, I focus on how price stretches, pauses, and compresses. At the current zone, BTC is not showing urgency. Pullbacks are absorbed quickly, while upward attempts remain controlled. This suggests a phase of balance rather than direction. What matters here is not the move itself, but how long price chooses to stay in this area. I am watching the quiet before expansion, not the expansion after it happens. Idea shared for observation purposes only.
تحلیل تکنیکال کوتاه: BTC، ETH، ADA در گامهای نوسانی!
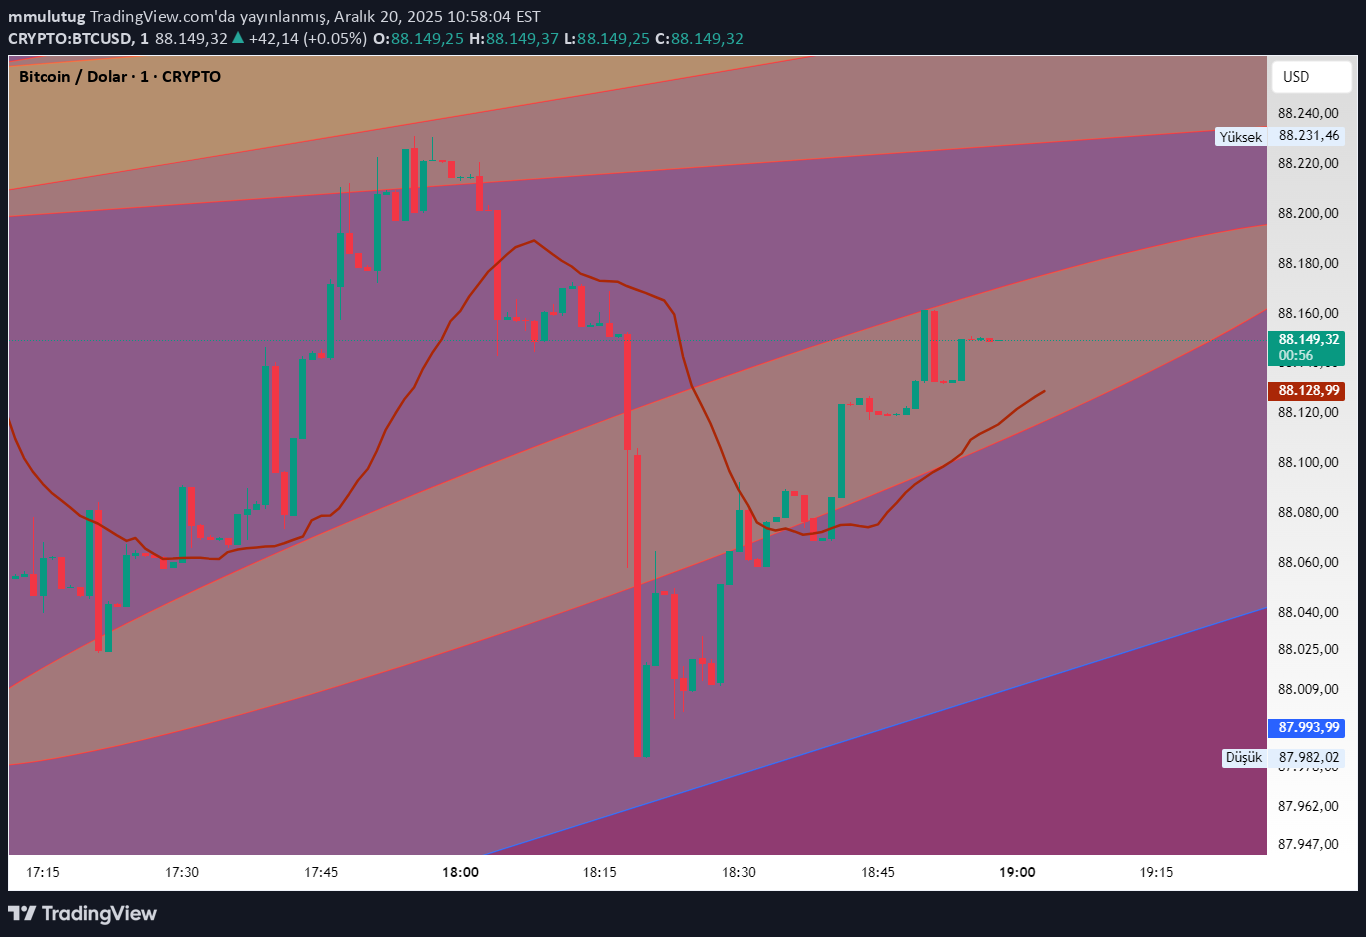
🎯 Short Technical Reading with Yay (BTC – ETH – ADA) BTC Ana yay hâlâ yönü tutuyor. Yay içi mumlar sıkışık ama kopuk değil. This represents an ongoing overflow rather than a finished movement. If it enters the black arc, the decision is read, and if it remains in the green arc, the decision is read. ETH BTC’ye göre daha içe basan bir yay var. Hareket hızlı değil ama daha dengeli. Yay içi doluluk artıyor; This generally means the price is not looking for direction, but digesting its direction. ADA Daha kısa yaylarla ilerliyor. Not harsh, reactive. This structure is generally seen in products that spend time in small springs before joining the main spring. Sabırsız değil, gecikmeli. 🔎 Kısa Not (tek satır) BTC carries the direction, ETH balances in the arc, ADA is prepared in small arcs. If you want, I can also add a one-sentence fixed closing, for example: “This is not a result, it is an in-arc observation record.”
تست استراتژی دنبال کردن روند با "یاَی": نگاهی به بیت کوین، اتریوم و کاردانو
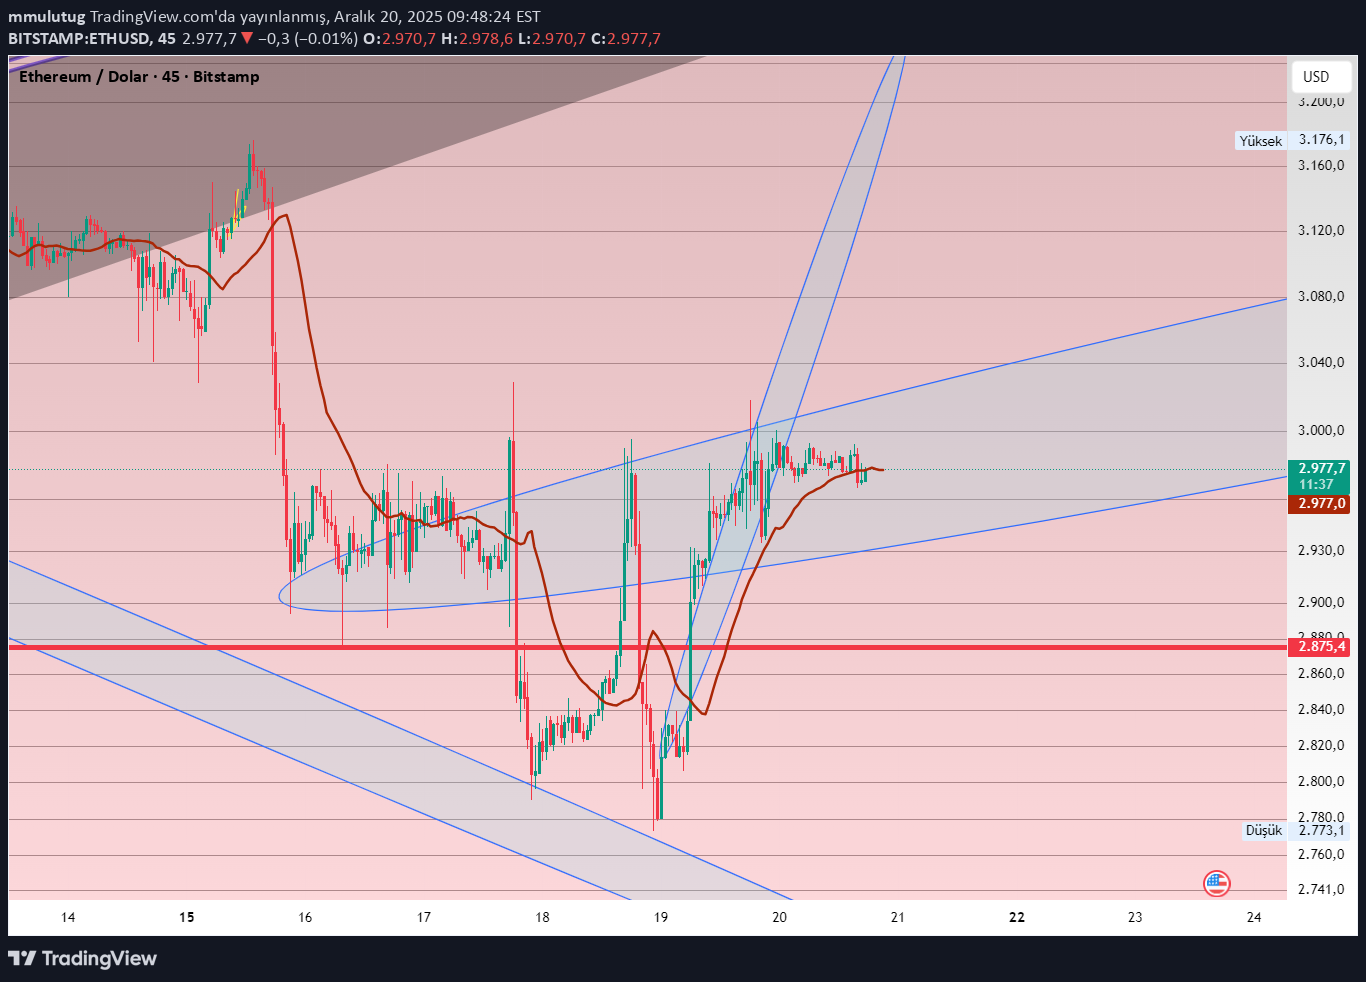
🎥 Video Title (Main) 20.12.25 | Trend Following Experiment with Yay – 2 BTC • ETH • ADA | Trade & Position Trial 🔁 Alternative Title (one click simpler) Trend Following with Yay – Essay 2 | BTC ETH ADA (Transaction and Position Observation) 📝 Video Description (YouTube / TradingView compatible) In this study, trend following experiment – 2 was conducted with the Spring approach. BTC on ETH and ADA According to the spring structure, trend continuation - pause - search for direction Real-time trading and position experiments Structure that follows the arc of the movement instead of lines This video is not a results video, It is an attempt to read and follow. Purpose: Rather than telling where the price will go, to see how it flows. 🎯 Arc = direction 🎯 Inside the arc = duration 🎯 Overflow is monitored, not breakage. 📌 It is not investment advice. 📌 This is a working record in which I tested my own method.
20 12 2025 yay denemeleri 1
trend tracking and usage testing on transactions 1
تحلیل طلای ۱۸ دسامبر: زمان انفجار یا ریزش؛ انتشار زنده آغاز میشود!
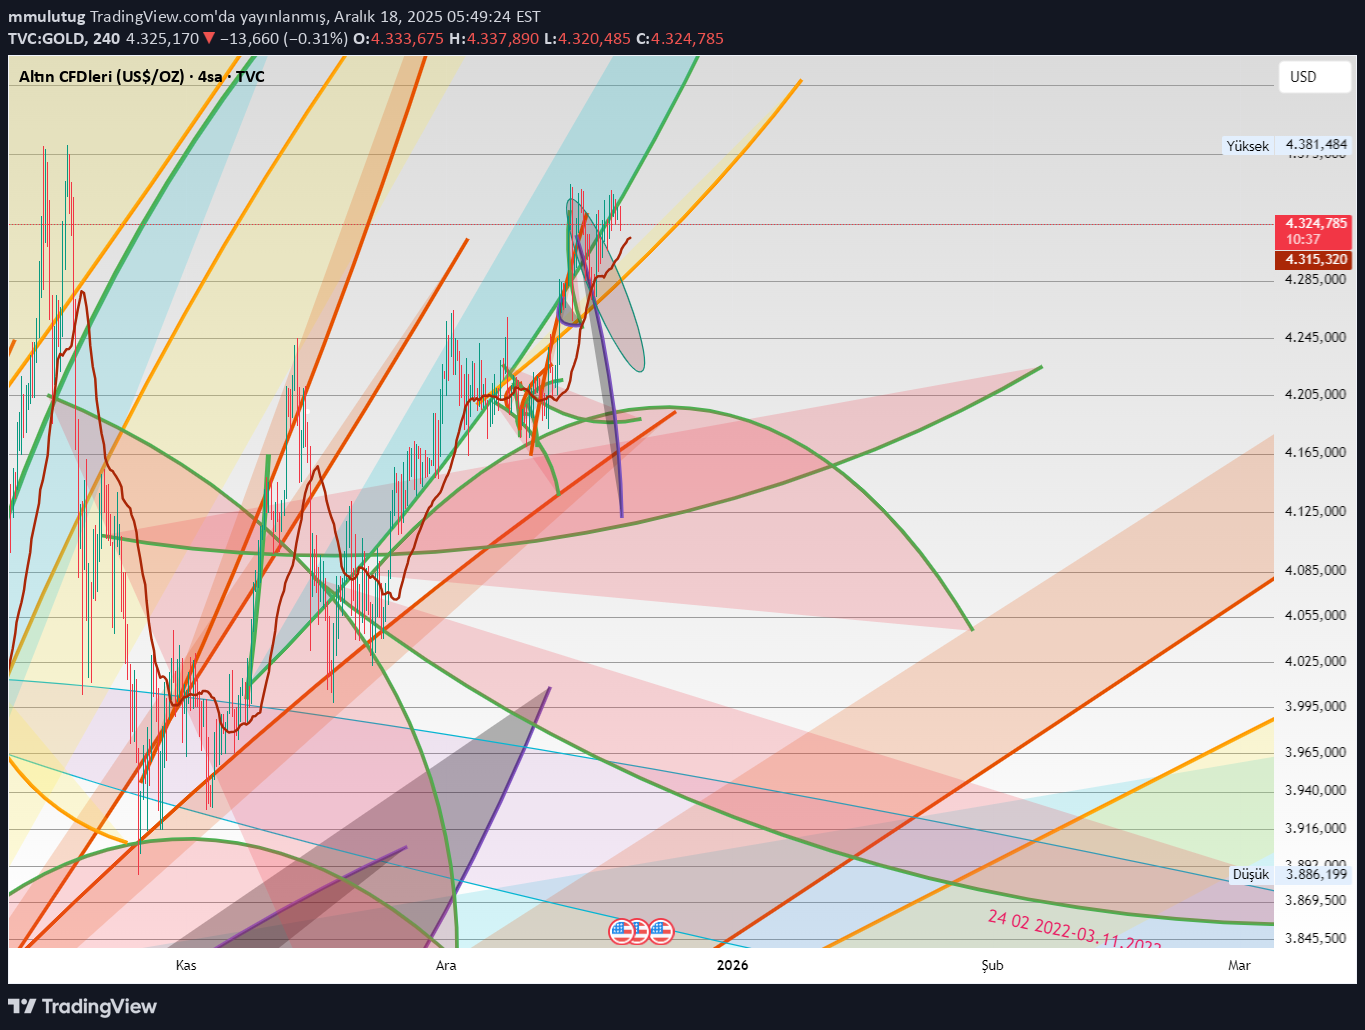
Sagittarius Gold | 18.12 In this study, gold is not targeted with a single goal, but I watch with the time and behavior of the springs. The price has now entered the “talking zone”. In other words, the areas where the drawn arcs come into contact with the product-product target started to work. 🔔 Announcement: After this; Gold, silver, crypto or another product When the bow reaches its goals not pre-planned analysis, I will start broadcasting upon contact with the target. These publications: Not in the language of “this will happen” It will be done with the language "What is happening right now?" Not betting on top or bottom Broadcast behavior and waiting time will be discussed On the gold side today: Spring compression is in completion The question of reaction or sagging is no longer theoretical in an observable time window That's why 18.12, It's one of those days when springs are talking about gold. The rest is no longer in the drawing, in living.
Disclaimer
Any content and materials included in Sahmeto's website and official communication channels are a compilation of personal opinions and analyses and are not binding. They do not constitute any recommendation for buying, selling, entering or exiting the stock market and cryptocurrency market. Also, all news and analyses included in the website and channels are merely republished information from official and unofficial domestic and foreign sources, and it is obvious that users of the said content are responsible for following up and ensuring the authenticity and accuracy of the materials. Therefore, while disclaiming responsibility, it is declared that the responsibility for any decision-making, action, and potential profit and loss in the capital market and cryptocurrency market lies with the trader.