
mickey_v
@t_mickey_v

What symbols does the trader recommend buying?
Purchase History
پیام های تریدر
Filter
BITCOIN OUTLOOK - DEADCAT BOUNCE OR A START OF EXPLOSION ???

Hopium has spread across the market over the past fortnight as BTC climbed to +69k. The real question is that "IS IT A BREAK-OUT TO ATH?". Let's quickly dive into the action. There's NO DOUBT that BTC is going through accumulation phase. Although it has taken longer than what we anticipated (~8 months), our long-term narrative is still unchanged - IT'S ONLY A MATTER OF TIME THAT A FINAL 5th WAVE WILL BE A BLOW-OFF TOP TO +100K. Nevertheless, PA still exhibits mixed signals whether BTC has truly bottomed at 49k. Normally, in order to establish a sustainable trend, whether upside or downside, we would always want to see an impulsive move towards the direction where the market wants to go. Otherwise, there's a decent chance that it's only a corrective move of a HTF PA. Since PA has displayed somewhat ambiguity, there are TWO PROBABLE SCENARIOS that BTC could play out in the next couple of weeks. SCENARIO 1: WXY CORRECTION - Narrative: Short-term uptrend continuation - Probability: Low - Aspects to consider: Minor 4th Wave must NOT overlap previous Low (~59k) Minor 5th Wave needs to take out +70k Passive Spot Bidders actively step in at any price above 59k In fact, PA has still significantly driven by Perps team (Late Longs and Shorts Covering). Lack of Spot Buyers has proven a weakening interest at current price level. With an increasing Spot Sellers, cumulative spot CVD is still largely negative. That's why we've rated this Scenario to be unlikely. SCENARIO 2: WXYXZ CORRECTION - Narrative: Short-term Bearish, completing "Z" Wave - Probability: High - Aspects to consider: Untapped downside liquidity from sub 59k to 55k Spot CVD is still largely negative and has NOT shown any signs of divergence Marginal HHs/HLs PA from 49k - 69k If Scenario 2 plays out, we expect "Z" Wave to be a Double Three correction type, ranging anywhere between "Z1" and "Z2" as shown on the above chart. We also believe that this is also a "true" BTC bottom. If you're a spot hodler, there's no need to worry about and this "dip" is your golden opportunity to stack up your pile. As opposed, 69k is a level to de-risk your LONG positions.
BITCOIN AT CRITITAL ZONE - HIGHER HIGH OR DEVIATION TOP?

September came to a close with ~7.3% gain on 1M Candle. However, our scenario for BTC is still intact. Let's quickly dive in what current PA is showing. 62k - 65k level has been a critical level over the past fortnight. We also pointed out several signs of exhaustion at this level on our last article. Nevertheless, this level is still a puzzle to solve as it gives us some aspects to analyse in order to fully determine PA in next couple weeks. Aspect 1: LIQUIDITY Levels to watch: 57.5k - 58k and 55.5k - 56k. What to expect: passive spot bidders quickly step in at these lows to maintain HHs/HLS structure on HTF and drive price to >70k. Aspect 2: DAILY PA STRUCTURE Levels to watch: if Aspect 1 doesn't play out (turquoise-coloured path) then 62k - 65k becomes an upside liquidity grab for further downside expansion. PA from August Low (49k) til now becomes CORRECTIVE move. What to expect: downside expansion to fill the wick at 49k or a bit lower (orange-coloured and/or red-coloured path) Aspect 3: PERPS & SPOT VOLUMES: What about consolidation in March 2023 - October 2023? Difference in Spot bidders at Range Low: PA was driven significantly by passive spot bidders at 24k - 26k. Spot volume appeared much "thicker" than Perps volume. Currently, our Spot volume at 49k Range Low looks very slim compared to Perps volume. This potentially means that PA structure from 49k til now is CORRECTIVE move, rather than impulse. March 2023- October 2023: March 2024 - Jun 2024: July 2024 - NOW: SUCH AN MASSIVE WEEK AHEAD AND PASSIVE SPOT BIDDERS ARE EXPECTED TO MAKE A DIFFERENCE HERE. LET'S SEE HOW IT UNVEILS !!!
BITCOIN - TIME TO LAUNCH ROCKET SHIP???

September is coming to an end with Monthly Candle exhibiting approximately 8% gain from its open (at the time of writing). However, PA is showing some weakening factors that could ruin the party. Let's quickly dive in. 1. SIGNS OF EXHAUSTION ON 1D CHART As much as the hype of increasing Global Liquidity, Bitcoin is clearly showing fatigued price action (PA) on HTF: Weakening spot volume: 6 days of declining trading volume on the daily Multiple upper and lower wicks: Both late longs and aggressive (early) shorts got taken out intraday Narrow daily candle open/close: Overall sentiment is somewhat ambiguous Slow trending upward: Lack of clear break out to the upside, enhancing the probability of fractal top at 62k - 65k level 2. FRACTAL UNTAPPED DOWNSIDE LIQUIDITY ON 4H CHART As much as highly anticipated turquoise-coloured path to play out for hopiums, huge spot buyers need step in NOW to push the price higher. Despite that, bidders have been doing the complete opposite for the last 6 days. As mentioned in our previous article, the current run-up from 52k til now is mainly driven by Futures positions. So what do we expect from here? A fractal top: At 62k - 65k level is expected The degree of downside PA: will be determined by the spot buyers at some critical lower price levels So far, potential downside magnet: Is the fractal untapped liquidity on LTF (shown as grey boxes on the above chart) Levels to watch: 57.5k - 58k and 55.5k - 56k (fractal untapped liquidity on LTF) Sufficient amount of spot bidders (NOT Futures bidders) need to step in at these "levels to watch" in order to maintain HLs/HHs PA on HTF (depicted as orange-coloured path). This also means that 62k - 65k level has a high probability to become Flip Zone – resistance becomes support (As mentioned on Our last article). Otherwise, 62k - 65k level is just another Liquidity Grab on HTF for another downside expansion to sub 50k.
BITCOIN - IS THE BOTTOM IN?

The ultimate question has been flowing around crypto community - IS BITCOIN BOTTOM IN, YET? A probability of economic recession or worse is still the talk of the town but was quickly relieved after FED cutting 50bps (first time in 4 years!!!). However, we are NOT out of the wood yet. Since the large dip at 49k, Bitcoin had a relief run to 65k, then a minor correction to sub 53k. We currently found ourselves at 62k again. However, this coincidentally has put ourselves in a tricky position: The run-up from sub 53k til 62k has multiple marginal LHs and LLs on LTF, instead of impulsive candles. This leaves behind a lot of untapped downside liquidity. Meaning this run-up could potentially only be a corrective move. The run-up was mainly driven by Futures Long, not Spot. This is not sustainable. Level of 62k - 65k might either be liquidity grab for further downside expansion or flip zone SInce 62k - 65k level is such a puzzle. We'll mark this zone as the critical area to watch for the next couple of weeks: SCENARIO 1 - THE FLIP ZONE: This is the best case scenario for bull-dreamers. PA either follows turquoise-coloured path or orange-coloured path. However, we highly anticipate turquoise-coloured path if this flip zone is to happen. SCENARIO 2 - LIQUIDITY GRAB This is NOT the scenario we want but judging from aforementioned position that we're in, we believe that this is the highest probable scenario. Liquidity grab occurs at 62k - 65k level before further downside expansion. The expected downside target: 45k - 49k What happens after: Rapid and high volume V-shape move upward to retest 62k – 65k again Slow recovery with chopping PA around 49k – 52k before retesting 62k – 65k again EITHER THE SCENARIO HAPPENS, WE STILL ANTICIPATE BITCOIN NEW ATH SOON. With multiple untapped liquidity from 70k - 73k on HTF, we'll quickly run through them once PA decides which scenario it wants to go and BOOM, NEW ATH !!!
BITCOIN CHOPPY MARKET - INDECISION SIDEWAYS

Bitcoin has made several attempts breaking out of 31k zone but quickly got rejected back to 29k level. The market exhibits an extremely tight consolidation range. What's next? __________________________________________________________________________________ WHAT'S HAPPENING? Bitcoin continues ranging in a tight consolidation. Major resistance is 31k and major support is 29k (currently). For now, it's a NO trading zone . Price still lingers in-between this consolidation zone (29k - 31k) and continues to manifest within a tight range. WHAT TO EXPECT? When price acts indecisive within a tight consolidation range, it's better to just wait. You ONLY start trading based upon price confirmation. If you always have that urge of trading or continuously blame yourself for not entering a trade (just because coincidently the market might go to your "predicted" levels), you're simply gambling and wasting your time. That is a bad habit and you will end up losing your chips. But one thing we know: "The tighter the consolidation, The more impulsive the next move might be" , either to the upside or downside. And that "next move" will be more likely to be in favour of the on-going market structure. For now, the overall 2023 market is upside. Thoroughly investigating 2023 market, it's funny how Bitcoin has played out in terms of market structure. An impulsive move to the upside is followed by a complex consolidation range, then a sudden 7-10% dip before making another impressive up-shift move. We briefly split 2023 market into 3 parts: PART 1: 2023 FIRST IMPULSIVE MOVE - Time: Jan 2023 - mid Mar 2023 - Impulsive bull-run: 16.5k - 25k - Consolidation range (correction range): 19.5k - 25k - Neckline (red line): 21.5k After an impressive bull-run, Bitcoin consolidated within a wide range of 21.5k - 25k for one month then brutally dipped below the neckline to 19.5k level before heading north again. PART 2: SECOND IMPULSIVE MOVE - Time: mid Mar 2023 - May 2023 - Impulsive bull-run: 19.5k - 29.5k - Consolidation range (correction range): sub 25k - 29.5k - Neckline (red line): 27k Bitcoin exhibited price action in similar fashion, compared to PART 1 move. After roughly 2 months of ranging between neckline and key resistance of 29.5k, price finally dipped below the neckline of 27k and reached to sub 25k level, before heading north again PART 3: CURRENT PRICE ACTION Despite all historical comparison is relative, it's also a strong indicator and a reliable reference of how the price structure might be in the future. We are currently situated within a tight consolidation range of 29k - 31k with a potential neckline at 29k. It will be no surprise if Bitcoin dips below this support and reaches for 27k - 28k level. The overall trend of 2023 is still bullish so far. Even if Bitcoin dips to 27k - 28k level, this will NOT be the end of the world but in fact, a great opportunity for swing trade LONG and a perfect chance to pile up your hodl-ing stack.
BITCOIN CORRECTION - WHAT ARE THE LEVELS?

Bitcoin has not yet shown any strength of reversing. The only positive news is that price quickly bounced off 25.8k level and currently situated at 26.7k. What are the levels to look at if the price falls below the current level. __________________________________________________________________________________ WHAT ARE THE LEVELS??? Bitcoin is displaying a typical bear flag with price lingering around 25.8k - 27.5k level. This could potentially be a SHORT opportunity when price breaks below 25.8k. Furthermore, the current situation is still in favour for the bears, short-term wise. A strong suggestion to this theory comes from 3 major rejection candles on 18th, 21st and 24th of May. As soon as price hit 27-27.5k, it instantly got overruled by the sell-side. The levels we can expect to see if price breaks down of 25.8k are: Target 1: 25.3k - this will be a desirable target for a SHORT position once price falls below 25.8k. Target 2: 24.3k Target 3: 22.8k However, until the market gives us a break-down signal, only can we open a SHORT position. We have seen price action on the 24th and 25th of May, indicating that the bull-side still hasn't given up holding on to this level, YET. BITCOIN MOMENTUM Alike any asset, Bitcoin is also cyclical. There are bull days and bear days. What sets Bitcoin apart from other assets is its volatility. The coin can gain some wildly +200% or decline more than 50% within a few months. However, it still has market structure and orders. A shift in momentum can be seen after a prolonged bear market and having bottom being taken place. From the above image, we can see that when the bottom is in, Bitcoin tends to shift its momentum upwards, creating a series of higher highs (HH) and higher lows (HL). This up-shift usually takes place in 1-4 months, followed by a prolonged correction that goes on for at least 3 months. The overall trend, from Jan 2023 til thus far, is still in favour of "new bullish trend" theorem. As long as we don't go below 20k, Bitcoin still exhibits a healthy start to our newly potential bullish cycle 2024 - 2025. But that's a story for another day! Through its 15 years of history, Bitcoin has gone through ups and downs. Black swan events usually take place where exchanges is hacked or go bankrupt, investors get rug-pulled or trapped in ponzi schemes and even government intervention. Those are sadly wildfire in the forst that is due to happen eventually. However, Bitcoin network, as a community, still comes out on top and bounces back stronger.
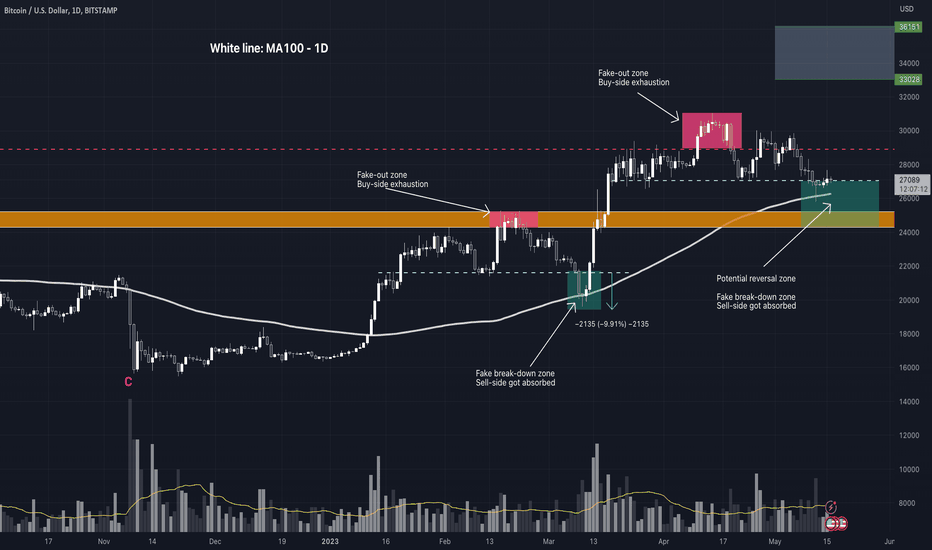
BITCOIN DECLINE - WHO IS ACTUALLY SELLING?

Bitcoin has traded within an extremely tight price range for the last several days with a break-down of SMA100 (on the daily) last night (GMT+10). Meanwhile, the percent of 1+ years old supply keeps creeping to an ATH of >68%. WHO IS ACTUALLY SELLING? _________________________________________________________________________________ CURRENT MARKET SITUATION Bitcoin broke down the seemingly sensitive support - SMA100 (on the daily). This support has never been broken before, at least since the break-out on12th of Jan this year. This is also the convergence support of SMA100 (on the daily) and SMA200 (on the weekly). Normally, such supports play an important role of "retaining the trend" and once violated, price tends to get ugly. A SHIFT IN FRACTUAL MOMENTUM History is a reminder of what has happened that leads to today's event. It doesn't necessarily mean that history will repeat but the market tends to behave cyclically. Looking at the previous rally in late Q4.2023 - Q1.2023, we can see a various higher highs (HH) and higher lows (HL), creating two mini bull-run: Mini bull-run #1: Price started rallying from sub 16k, manifesting multiple HHs and HLs until getting exhausted at sub 19k and commenced shifting momentum to lower highs (LH) and lower lows (LL) Mini bull-run #2: Price started rallying from sub 17k, exhibiting an impressive series of HHs and HLs up til sub 26k. The momentum shifted when Bitcoin got exhausted at sub 26k, creating multiple LHs and LLs Accessing the current fractual move, which is mini bull-run #3 , displaying a conventional series of HHs and HLs before shifting momentum, AGAIN. We are witnessing two LHs and one LL. As aforementioned in previous articles, Bitcoin PDZ might be around 27k down to 22.7k with high possibility at around 25k down to 24k. _________________________________________________________________________________ WHO IS SELLING ANYWAY??? The intention of buying/selling assets depends on the purpose of the trader. They can briefly be divided into 2 categories: The long-term hodlers: Who hold their coins for more than 6 months. For displaying purpose, we will cross out the 6 months - 12 months cohort and jump straight to 1+ years old supply (as shown below). The short-term hodlers: The rest of the hodlers. The percent of Supply Last Active 1+ years old is cyclical, having significantly declined when the market tops or steps into bullish trend and gradually increased during recession or bearish trend. Surprisingly, the long-term supply cohort is at an ATH of 68% and still rising ... This is impressive and has shown that even though price was rejected at the Cycle baseline of 30k, the long-term hodlers are still unfazed of the current situation. WITH THAT BEING SAID, THE ONLY COHORT WHO IS SELLING, IS THE SHORT-TERM HODLERS. They are speculating and tend to get panic when price doesn't rally as expected. On the other hand, since it's only the short-term hodlers who trade, the trading volumes, recorded on CEXs, have not been impressive, trading at around 20k - 70k per day (on Binance). The sell pressure also comes from FUTURE/DERIVATIVES market as short-term trend is heading south. It wouldn't be surprised if the long-term hodlers keep accumulating during the dip in the next few days, even weeks, resulting a continuous rising trend of The percent of Supply Last Active 1+ years old ratio. _________________________________________________________________________________ ANOTHER ASPECT TO LOOK AT - BITCOIN ACTIVE ADDRESSES The Bitcoin market tends to get "busy" when major rallies happen and can become extremely "quiet" during recession or side-way market. The more number in active addresses, the more confident the market, which effectively attracts more retail traders to participate, eventually pouring more capital into the asset and boosting the price up north. However, this is a long process that doesn't magically happen within overnight. Keep calm and accumulate, my friend!
BITCOIN FRACTUAL MOVE - FINAL SHAKE-OUT 📉 BEFORE MOON 🚀 🌕 ???

Bitcoin in April and May 2023 still exhibits tough price action. It seems like THE ONLY TREND from here is BEARISH? NOT SO FAST!!! Let's quickly jump into more action. _______________________________________________________________________________________________________________________________________________________ CURRENT PRICE ACTION After hitting mini bottom at 25.8k on 12th of May, Bitcoin rebounded mildly and got quickly taken out at 27.5k zone. Some calling a major H&S formation, having the price completed the pattern. Some even making bold statement of 15k down we go. Bitcoin is well-known for its volatility and anything is plausible with this asset. However, will be it allowed to dip such low levels? _______________________________________________________________________________________________________________________________________________________ SOPR - SPENT OUTPUT PROFIT RATIO Technical Analysis a trading discipline that is used for the evaluation of investments and identification of trading opportunities, having an assumption that all price actions and volumes have already reflected any incidents and events within the market. There's NO ONE "GO-TO" method to analyse/evaluate/identify trading opportunities of an asset and Bitcoin is the same. Let's take a look at one of the most powerful tools of TradingView x Glassnode collaboration - SOPR. The SOPR (Spent Output Profit Ratio) indicator provides insight into macro market sentiment, profitability and losses taken over a particular time-frame. It reflects the degree of realised profit for all coins moved on-chain. The SOPR indicator can be considered within the following framework: SOPR values greater than 1 implies that the coins moved that day are, on average, selling at a profit (price sold is greater than the price paid). SOPR value less than 1 implies that the coins moved that day are, on average, selling at a loss (price sold is less than the price paid). SOPR value of exactly 1 implies that the coins moved that day are, on average, selling coins at break even. SOPR trending higher implies profits are being realised with potential for previously illiquid supply being returned to liquid circulation SOPR trending lower implies losses are being realised and/or profitable coins are not being spent. 1. SOPR EVALUATION #1: PROFIT-TAKING SENTIMENT From Nov 2022 til now, Bitcoin has rallied an immense 100% gain (form 15.5k to 31k). Amongst the decline of all assets across the globe and unstable economic outlook, Bitcoin has shown resilience despite global uncertainty. We briefly separate this rally into 3 sections: Capitulation Zone: Where SOPR is way below 1.0. As price recovers, SOPR rises back to 1.0 level but fails to overcome the level as sell pressure is huge. This causes 3 major realised loss events, resulting in SOPR way below 0.95 mark. Transition Zone: Having mentioned above, 3 major events that lead to a mass realised loss are actually well-absorbed. As the result, price fails to dip any lower than 15.5k . As Bitcoin quickly escapes 15.5k - 18k zone, Bitcoin supply, was once underwater or fresh buyers, is now back to being profitable. The incentive to sell at a minor loss or with small profit margin rises, due to market uncertainty. This leads to SOPR revolves around 1.0 level. Profit-taking Zone: Confidence within the space increases, a substantial amount of buyers is ready to stack up their pile at 20k on 11th of March. Realised loss is softened as SOPR is just below 1.0 when Bitcoin hits 20k. Bitcoin strikes for 24k and then hits 30k mark, leading gradually elevation in profit-taking incentive. SOPR stays well above 1.0 level. 2. SOPR EVALUATION #2: SHAKE-OUT BEHAVIOUR Apart from Capitulation Zone, Bitcoin has consolidated on 2 occasions: 1. Consolidation range #1: 21.8k - 23.1k: After a fake break-out to 24k, Bitcoin quickly plummeted to 22k and created a fractual lower high at 22.5k. The coin eventually broke out of lower consolidation SUPPORT LEVEL of 23.1k and deep-dived to 20k zone. Although SOPR did dipped below 1.0 level, it was a minor dip of just 0.98. This shows that lots of hodlers were willing to hold their coins and not ready for any loss-taking action. 2. Consolidation range #2: 27k - 30k: A surprisingly similar pattern is manifested. Bitcoin ALSO did a fake break-out to 31k then quickly plummeted to 27.5k before created a fratual lower high at 29k. Currently, Bitcoin has broken out of lower consolidation SUPPORT LEVEL of 27k and been hovering around 26k - 27k zone. SOPR started to decline. As SOPR has steadily gained over the past 6 months from Capitulation Zone to Transition Zone to now Profit-taking Zone, it is not surprising that profit-taking will be in play during the next week or so, pushing SOPR back to 1.0 level. _______________________________________________________________________________________________________________________________________________________ WHAT ELSE? Another thing to have an eye on is The Supply Last Active 1+ Years Ago. This is the supply that has not moved in at least 1 year. The more this cohort rises in number, the more confidence within the space of both short- and long-term. Not only do we exceed 60% level of 1+ year hodlers, we also hit ATH, a whooping 67%. AIN'T NO DIAMOND WITHOUT IMMENSE PRESSURE. BE PATIENT AND STACK UP YOUR PILE.
BITCOIN AMIDST HEADWIND - WHAT ARE THE CHANCES?
After an impressive rally throughout Q1.2023, Bitcoin has faced off some of the toughest challenges of this year. Despite of disappointing price action, Bitcoin, as a network and a community, has witnessed immense fee pressure and guiding miner fee revenue towards ATHs. _______________________________________________________________________________________________________________________________________________________ WHAT'S GOING ON? Another week of disappointment where Bitcoin failed to stay above at the 27k level. Satoshi's favourite even reached 25.8k before closing 1D candle just below 27k on 12th of May. The fact that the coin recouped more than 1000 bucks within that day shows some serious effort of buy side to maintain SMA100 (on the daily). This incident causes by 2 possible reasons: 1. Buy side stepped in - SMA100 and SMA200 are some of the simplest yet powerful tools to determine SUPPORT and RESISTANCE. In this case, price action has reached down to 25.8k, coincidently also SMA100 (on the daily) and SMA200 (on the weekly), this shows that Bitcoin is sensitive at these MA levels. So far, this is our reliable support #1. 2. Short liquidation/take profit - as price broke down the first key level of 27k, shorters were ready for short positions. Some shorted at 27k, some at 26.5k or some even waited til 26k (as price broke SMA100 on the daily). However, if you took a short position at 27k on a 20x or even 50x leverage, you would profit an immense 74% to 185% gain. The motivation to take profit was huge, together with buy side in SPOT market, price action quickly rose. At that time, 26k shorters at high leverage quickly got their account burnt out and eventually liquidated. Bitcoin currently hovers just above 27k with weak trading volume. What could happen from here? _______________________________________________________________________________________________________________________________________________________ WHEN IN DOUBT, ZOOM OUT Looking at the price action for the last 10 days, Bitcoin has been heading south at a fast pace. 29k got taken out by the bears, leaving Bitcoin extremely "ugly" since it created a lower high (compared to 31k high on 14th of April). As the result, 26k - 27k zone currently is similar to a small downward flag. The nearest support is 25k zone, which is also a neckline of prior inverse H&S formation. Zooming out on 2023 price action, this is NOT the first time that Bitcoin dips further than its consolidation SUPPORT LEVEL. An uptrend consolidation range of 21.8k - 23.1k has been established throughout late Jan 2023 til the end of Feb 2023, after a massive rally from 15k to 23k within 15 days. However, price did a fake break-out at 24.5k then quickly exhausted and fell below 23.1k, which is our then asymmetrical flag SUPPORT LEVEL. A glimpse of the current price action, Bitcoin also has an uptrend consolidation setup, ranging from 27k to 30k, after a rally from 20k to 30k in March til early April. The consolidation SUPPORT LEVEL is current at 27k - 27.5k zone. Price ALSO did a fake break-out to 31k then quickly plummeted to 27.5k and created a lower high of 29k. What's left is that we are currently sitting below the aforementioned consolidation SUPPORT LEVEL, which AGAIN, is extremely similar to what happened in late Feb 2023. SMA100 (on the daily) is acting as a reliable support #1 , as mentioned above. However, the consolidation of this trend is still intact even if we go down to 25k zone. That's where reliable support #2 is in play. _______________________________________________________________________________________________________________________________________________________ ARE WE OUT OF THE WOOD YET? We are still in a bullish momentum overall. One of the most intriguing thing about Bitcoin is Cycle baseline. This "invisible zone" is seemingly a traditional Bitcoin "specialty" throughout its 15 years of history. Cycle baseline acts as an important zone which divides Bitcoin downtrend into 2 separate sections: 1. Typical bearish section - drawdown from ATH to cycle baseline. This means for a considerable time of the bear market, price tends to aggressively bounce off a certain level, creating a mini impulsive uptrend. Assumably late 2021 - 2022 bear market, its baseline is 30k 2018 - 2019 was 6k 2014 - 2015 was 300 bucks 2013 was 90 bucks and 2011 was 6 bucks. 2. Capitulation event - drawdown from cycle baseline to "bottom finder" price action. Price finally breaks out of cycle baseline and reaches a new ultimate bottom. Assumably late 2021 - 2022 bear market, its bottom is 15.5k 2018 - 2019 was 3k 2014 - 2015 was 175 bucks 2013 was 65 bucks and 2011 was 2.3 bucks. Since this cycle baseline acted as a crucial support not only during the drawdown from ATH to the baseline itself, but also, it was a reliable support of 2020 - Early 2021 bullish market when Bitcoin first reached 40k. Such a critical support once get violated, will immediately turn into an extremely tough resistance as soon as price rises back to this level. As the result, we have seen Bitcoin lingering around this level during April before falling to our current price. On the other hand, this is NOT over yet and we're still in a bullish momentum overall. The comprehensive 2023 rally still displays a healthy uptrend with two crucial consolidation ranges: 1. Late Jan 2023 - Feb 2023 consolidation - upper consolidation resistance of 23.1k and lower consolidation support of 21.8k. Lowest point - 20k 2. Current consolidation - upper consolidation resistance of 30k and lower consolidation support of 27k. Lowest point - potentially 25k - 26k area This comprehensive 2023 uptrend might be threatened if price dips below 25k or even violated if it goes below 20k. But that's the story for another day. For now, GEAR UP AND READY FOR THE HEADWIND!
BITCOIN - HOVERING AROUND CYCLE BASELINE!!!

After several weeks of out-performing rally, the market is taking a rest. Within this consolidation, we have witnessed a price range between 26k - 29k with some profit-taking at 29k and mild accumulation around 26k. Amidst complaint against Binance and CEO CZ by CFTC, Chinese Yuan prevailed by the BRICS or uncertainty within global financial status, Bitcoin investors appear to be un-fazed. ________________________________________________________________________________________________________________________________________________________________ WHERE ARE WE AT? Bitcoin has been hovering around 26k - 29k mark, which is just below the critical Cycle Baseline of 30k - 33k. Some people called 25k retest or even 20k retest. Probable!!! But the shorters got wrecked in the last 2 weeks, dreaming about such a deeper retest. An impressive rally from 15.4k to 29k has marked a NEW SUPER CYCLE, which is also Wave 1 of this new super trend. We are currently in Wave 2 with 15 days++ of consolidation around 26k - 29k zone. MID-TERM FORMATION - INVERSE HEAD & SHOULDER Bitcoin has finished inverse H&S formation. WHAT TO EXPECT? Deep dive into this consolidation, we can see that within the last 7 days or so, the support zone has gradually incremented from 26k to 27.5k. Still a resistance at around 29k - 29.5k (just below our Cycle Baseline), the fact that price floor elevated is a positive signal. As price action gets squeezed more and more within a tight range, an "explosion" could happen ... just around the corner. Hopefully, this time ... will be a bullish explosion.
Disclaimer
Any content and materials included in Sahmeto's website and official communication channels are a compilation of personal opinions and analyses and are not binding. They do not constitute any recommendation for buying, selling, entering or exiting the stock market and cryptocurrency market. Also, all news and analyses included in the website and channels are merely republished information from official and unofficial domestic and foreign sources, and it is obvious that users of the said content are responsible for following up and ensuring the authenticity and accuracy of the materials. Therefore, while disclaiming responsibility, it is declared that the responsibility for any decision-making, action, and potential profit and loss in the capital market and cryptocurrency market lies with the trader.