
michalw_pl
@t_michalw_pl

What symbols does the trader recommend buying?
Purchase History
پیام های تریدر
Filter
Signal Type
michalw_pl
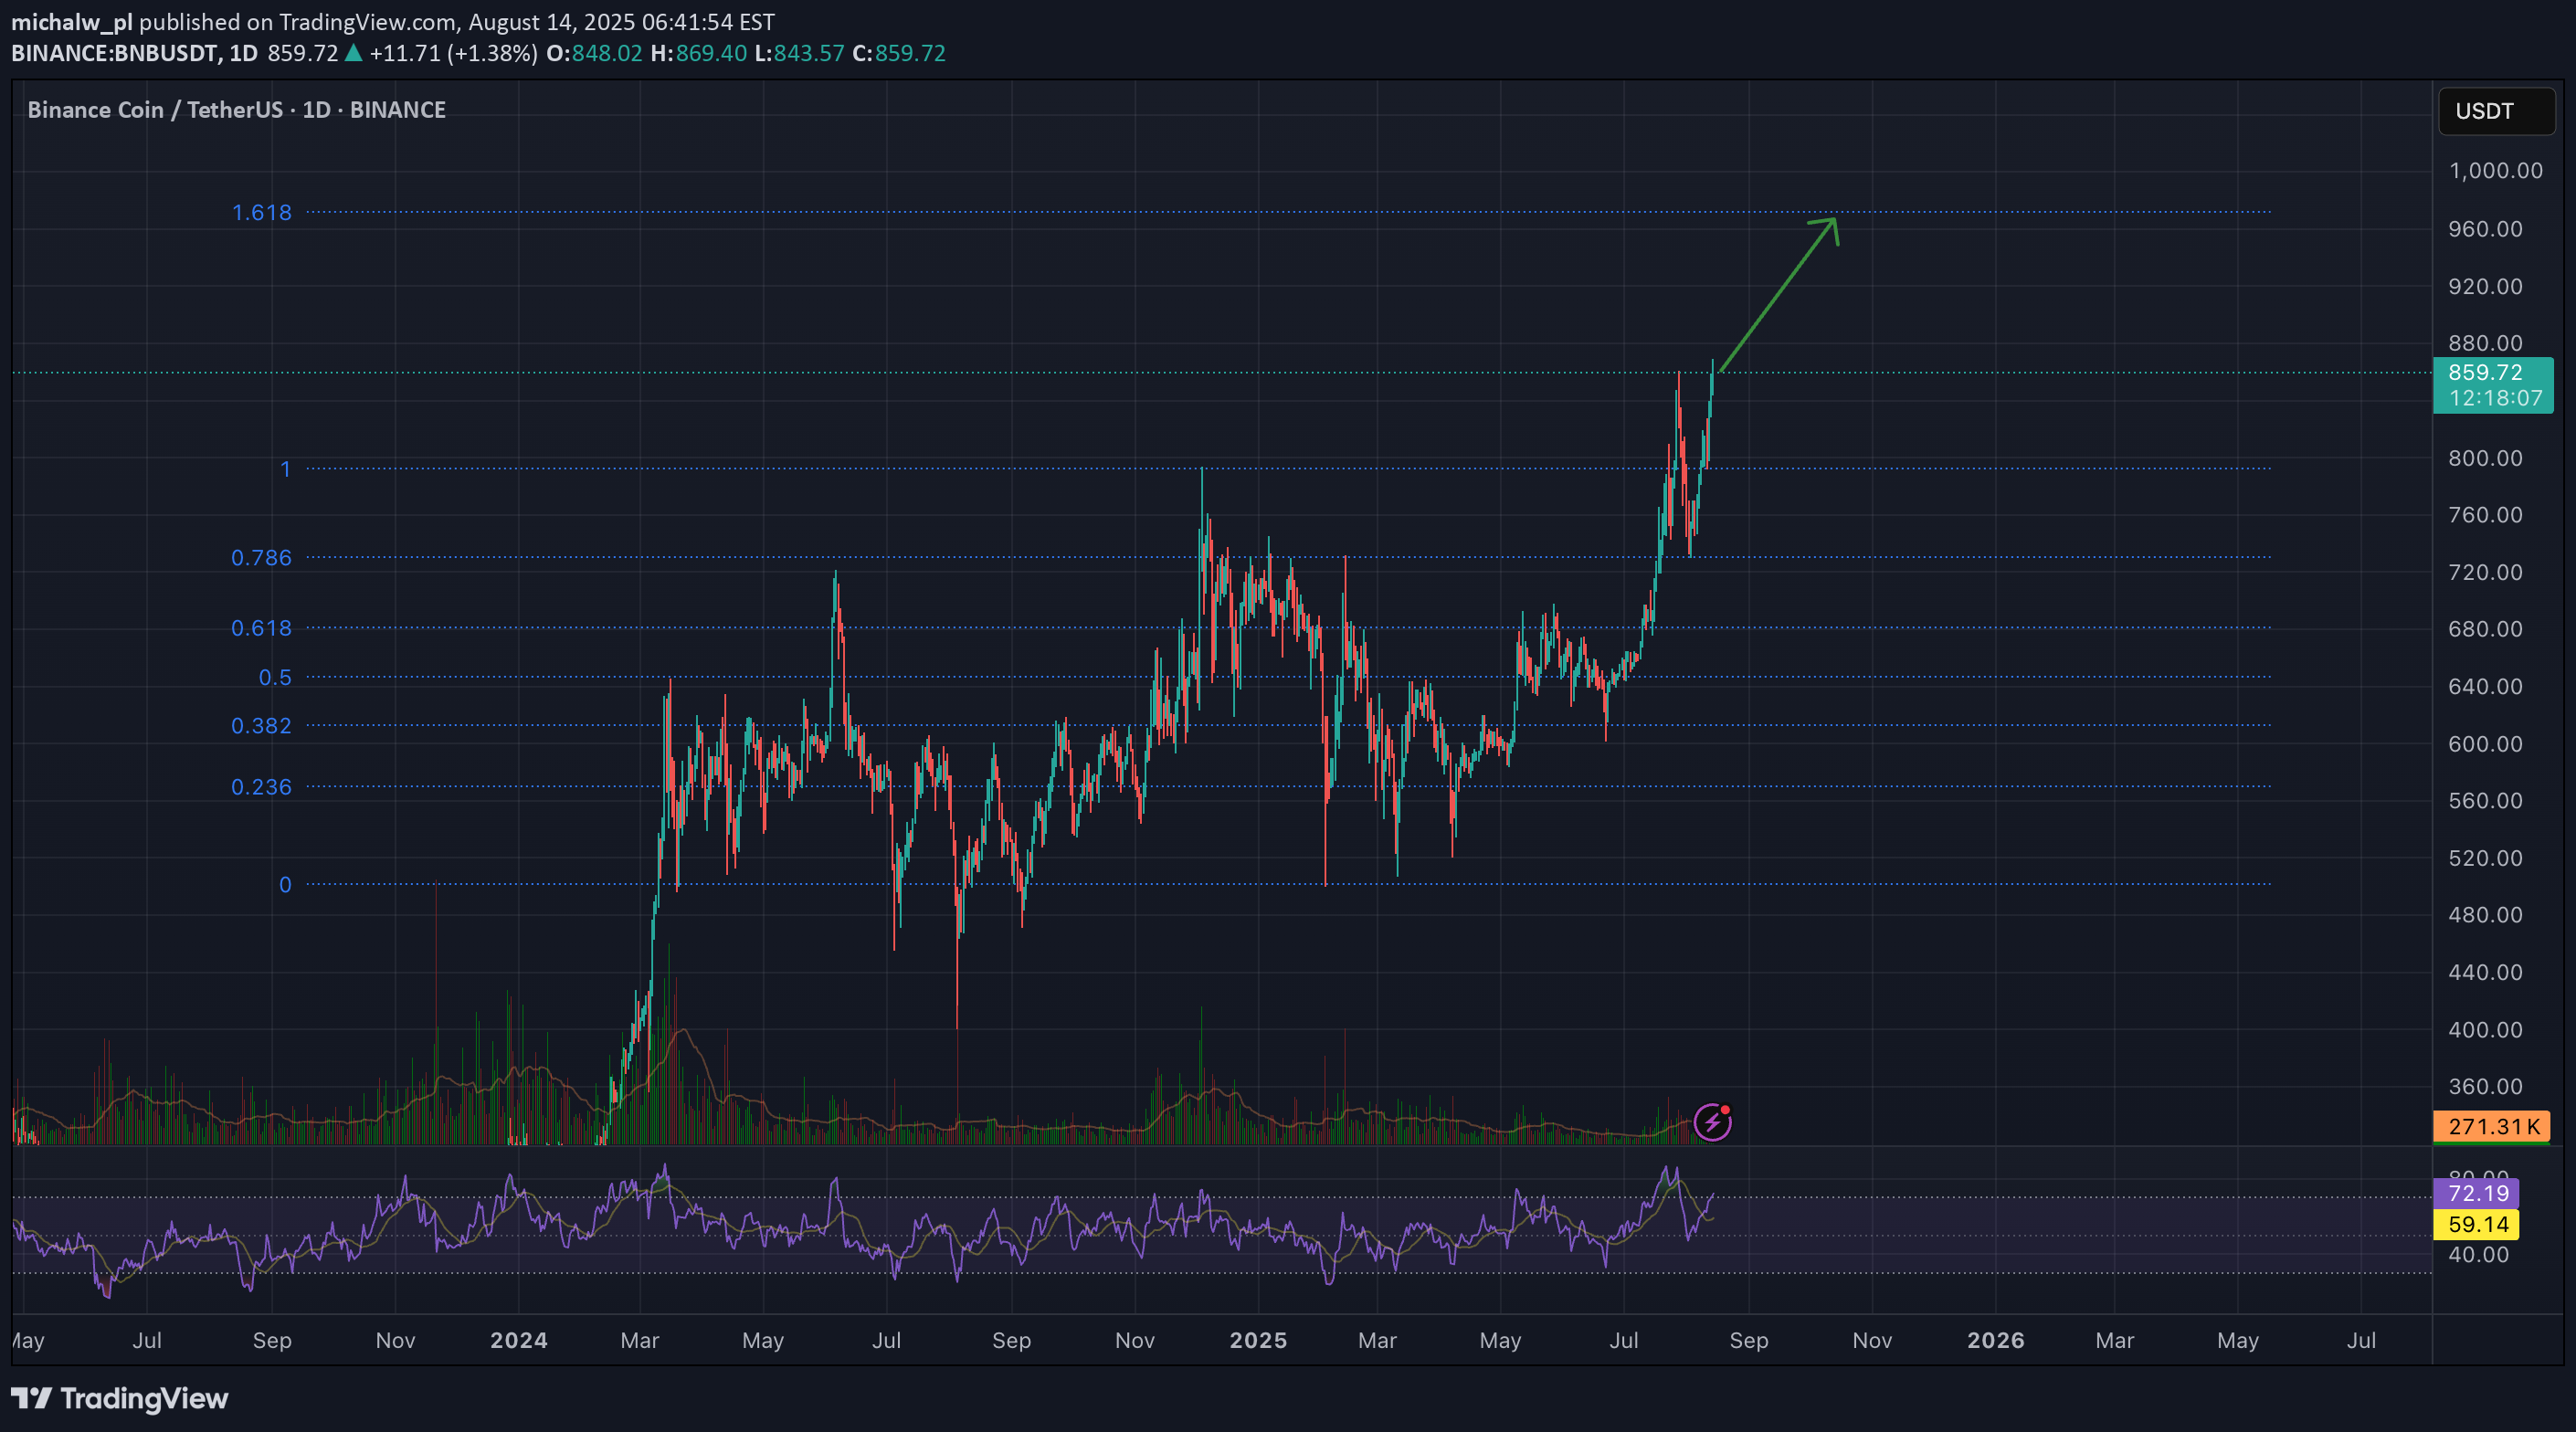
1. Overall Trend (Price Action & Market Structure) •Long-term trend: Strong bullish trend — since March 2025, price broke out of a long consolidation zone (~550–680 USDT) and is now hitting new highs. •Mid-term trend: After breaking out from the accumulation range, price is forming a sequence of Higher Highs (HH) and Higher Lows (HL). •Key supports: ~786 USDT (breakout zone + 0.786 Fib), 720 USDT (previous local top). •Key resistances: Current resistance zone ~860–880 USDT. Next target: ~975–980 USDT (1.618 Fib). ⸻ 2. Fibonacci Analysis From the drawn retracement: •Price has broken above 0.786 and is now trading beyond the 1.0 Fib. •Fibonacci extensions: •1.272: ~920 USDT •1.618: ~975–980 USDT → likely target if momentum stays intact. •Current price action suggests the market could aim for 1.618 within the coming weeks if no major correction occurs. ⸻ 3. Volume •Breakout from consolidation was supported by increasing volume — confirming strong buying interest. •Recent bullish candles have moderate volume — not yet euphoric, but demand is clearly exceeding supply. •If near 880–900 USDT we see large-volume candles with long upper wicks, this could signal distribution. ⸻ 4. RSI (Momentum) •Daily RSI is around ~72 → market is entering overbought territory. •Two possible scenarios: •Continuation: RSI can remain overbought during strong trends (overbought can stay overbought). •Correction: RSI dropping below 70 with bearish divergence forming against price. ⸻ 5. Chart Patterns •Breakout from a wide rectangle range (550–680 USDT). •Current move resembles a mark-up phase with a possible mini-flag on H4. •No clear signs of Wyckoff-style distribution yet. ⸻ 6. EMAs / SMAs (Not visible on your chart, but based on typical setups in such a trend): •EMA20 and EMA50 on D1 are strongly spread apart — confirming bullish momentum. •Price is far above EMA200 → long-term trend remains healthy. ⸻ 7. Scenarios Bullish: •Holding above 820–830 USDT → attack on 920 USDT, then 975–980 USDT (1.618 Fib). •RSI may stay >70 for several days, historically giving BNB an extra few % of gains. Bearish: •Drop below 820 USDT → retest of 786 USDT support. •Break of 786 → deeper correction towards 720 USDT (breakout retest). ⸻ 8. Summary •Trend: Strong bullish trend, momentum still favors buyers. •Key levels: •Support: 786 → 720 USDT •Resistance: 880 → 920 → 975–980 USDT •Risks: Possible pullback at RSI >70, especially if volume spikes and large upper wicks appear.
michalw_pl

A good time to buy ETH What do you think about this idea?
michalw_pl

My forecast for the end of the boom :) EMA (1D) 200x5
Disclaimer
Any content and materials included in Sahmeto's website and official communication channels are a compilation of personal opinions and analyses and are not binding. They do not constitute any recommendation for buying, selling, entering or exiting the stock market and cryptocurrency market. Also, all news and analyses included in the website and channels are merely republished information from official and unofficial domestic and foreign sources, and it is obvious that users of the said content are responsible for following up and ensuring the authenticity and accuracy of the materials. Therefore, while disclaiming responsibility, it is declared that the responsibility for any decision-making, action, and potential profit and loss in the capital market and cryptocurrency market lies with the trader.