Technical analysis by michalw_pl about Symbol BNB: Buy recommendation (8/14/2025)

michalw_pl
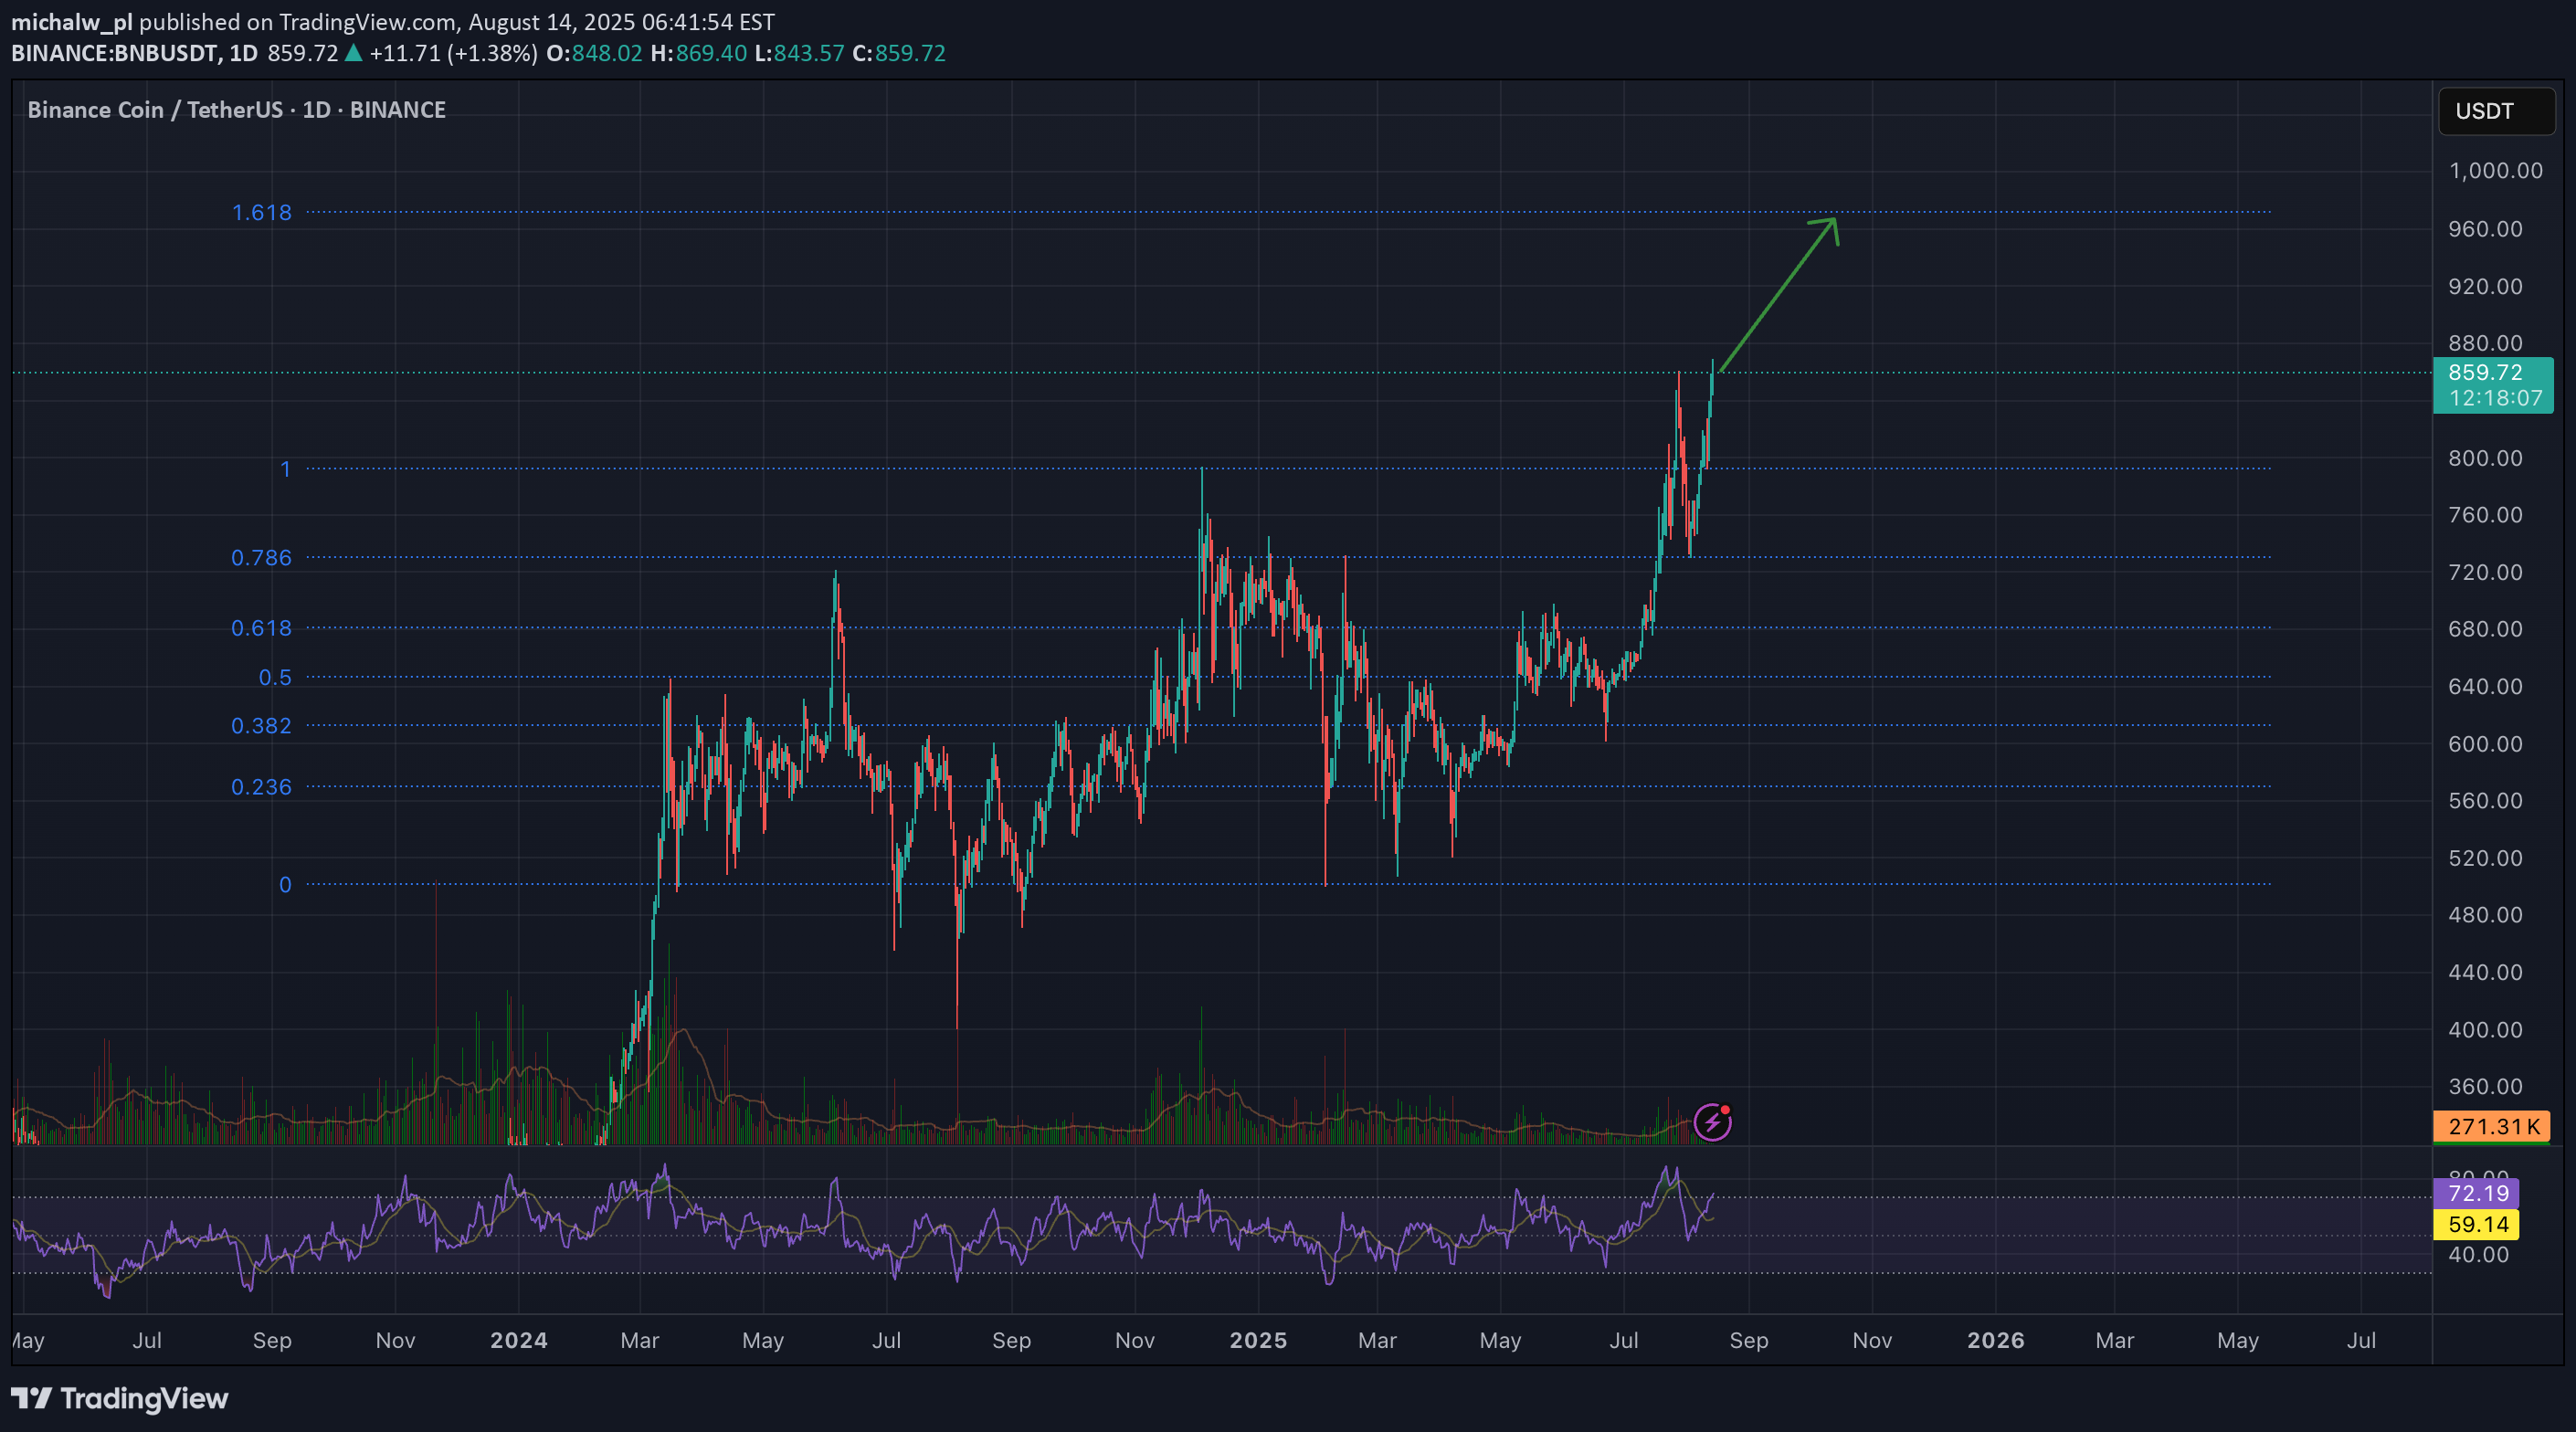
1. Overall Trend (Price Action & Market Structure) •Long-term trend: Strong bullish trend — since March 2025, price broke out of a long consolidation zone (~550–680 USDT) and is now hitting new highs. •Mid-term trend: After breaking out from the accumulation range, price is forming a sequence of Higher Highs (HH) and Higher Lows (HL). •Key supports: ~786 USDT (breakout zone + 0.786 Fib), 720 USDT (previous local top). •Key resistances: Current resistance zone ~860–880 USDT. Next target: ~975–980 USDT (1.618 Fib). ⸻ 2. Fibonacci Analysis From the drawn retracement: •Price has broken above 0.786 and is now trading beyond the 1.0 Fib. •Fibonacci extensions: •1.272: ~920 USDT •1.618: ~975–980 USDT → likely target if momentum stays intact. •Current price action suggests the market could aim for 1.618 within the coming weeks if no major correction occurs. ⸻ 3. Volume •Breakout from consolidation was supported by increasing volume — confirming strong buying interest. •Recent bullish candles have moderate volume — not yet euphoric, but demand is clearly exceeding supply. •If near 880–900 USDT we see large-volume candles with long upper wicks, this could signal distribution. ⸻ 4. RSI (Momentum) •Daily RSI is around ~72 → market is entering overbought territory. •Two possible scenarios: •Continuation: RSI can remain overbought during strong trends (overbought can stay overbought). •Correction: RSI dropping below 70 with bearish divergence forming against price. ⸻ 5. Chart Patterns •Breakout from a wide rectangle range (550–680 USDT). •Current move resembles a mark-up phase with a possible mini-flag on H4. •No clear signs of Wyckoff-style distribution yet. ⸻ 6. EMAs / SMAs (Not visible on your chart, but based on typical setups in such a trend): •EMA20 and EMA50 on D1 are strongly spread apart — confirming bullish momentum. •Price is far above EMA200 → long-term trend remains healthy. ⸻ 7. Scenarios Bullish: •Holding above 820–830 USDT → attack on 920 USDT, then 975–980 USDT (1.618 Fib). •RSI may stay >70 for several days, historically giving BNB an extra few % of gains. Bearish: •Drop below 820 USDT → retest of 786 USDT support. •Break of 786 → deeper correction towards 720 USDT (breakout retest). ⸻ 8. Summary •Trend: Strong bullish trend, momentum still favors buyers. •Key levels: •Support: 786 → 720 USDT •Resistance: 880 → 920 → 975–980 USDT •Risks: Possible pullback at RSI >70, especially if volume spikes and large upper wicks appear.
