
mbaberhanif
@t_mbaberhanif

What symbols does the trader recommend buying?
Purchase History
پیام های تریدر
Filter
mbaberhanif
Gold | Bulls Loading Up
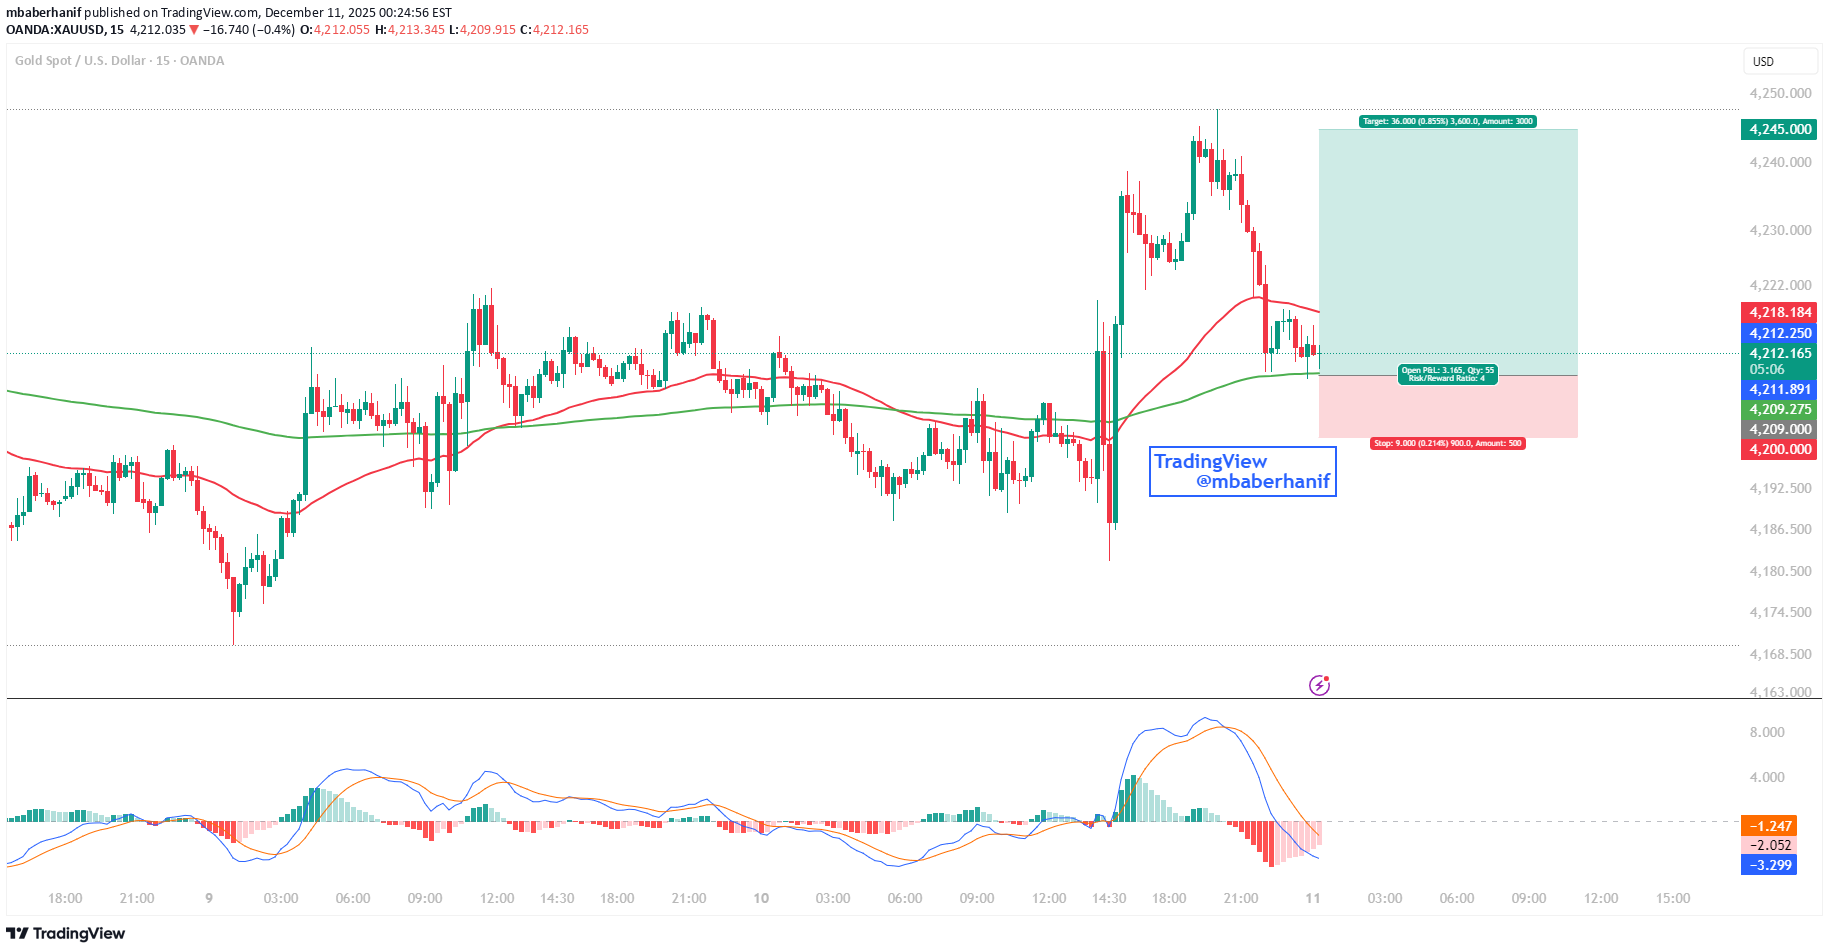
Gold is currently pulling back into a key intraday support zone near the 200-EMA after a sharp bullish spike, creating an ideal “dip-buy” opportunity as long as price holds above the 4,209–4,210 region. The corrective candles show shrinking bearish momentum, while the MACD histogram is easing—hinting that sellers are losing strength. As long as the support holds, buyers can target the upside continuation toward 4,245, with a well-defined stop around 4,200 to maintain a clean risk-reward profile. A bounce from this area could trigger the next bullish leg, making this setup attractive for momentum-based long entries1,100 pips running in profit 🚀💸🎉🔥
mbaberhanif
صعود انفجاری W/USDT: الگو «سر و شانه معکوس» نویدبخش چه قیمتی است؟

W/USDT is showing strong signs of reversal momentum. A clear Inverse Head & Shoulders pattern has been completed, with the neckline breakout suggesting a potential bullish trend shift. Price is consolidating near the neckline, which is now acting as support, adding strength to the breakout. If momentum sustains, the next upside targets open toward $0.19 – $0.29, with an extended bullish potential toward $1.85 in the long run. On the downside, support is seen around $0.061 – $0.049, keeping risk-to-reward highly attractive for medium to long-term investors.
mbaberhanif
XRP | Bullish Divergence

XRP is currently trading at $2.78, with a 0.84% increase in the last 24 hours. The bullish divergence on the hourly time frame suggests that XRP's price might be poised for a potential reversal or upward movement. *Approach to Resistance*: With the 1:1.5 and 1:2 approaches, you're likely referring to potential resistance levels. If XRP's price reaches these levels, it may face selling pressure, which could impact its upward movement.
mbaberhanif
Gold Breaks Bullish Flag

Gold has broken out of a bullish flag pattern around 3,752, confirming continuation momentum. Sustaining above 3,740 keeps the bullish outlook intact, with upside potential toward the 3,780–3,790 resistance zone.
mbaberhanif
Gold Poised for Bounce Toward $3,405 Target

Gold shows a recent price decline after testing short-term resistance near the 3,398–3,400 range, with sellers pushing the market back toward the 3,390 zone. A long trade setup is illustrated, with an entry around current market price, a stop-loss placed near 3,382.50 to protect against downside risk, and a take-profit target near 3,405, offering a favorable risk-to-reward ratio. The price is currently retesting the entry zone after a pullback, suggesting the trade idea is based on anticipating a rebound from minor support and continuation toward the upper resistance level.
mbaberhanif
XAUUSD | Short Position

The price is in a downtrend in shorter time frame, making lower lows and lower highs. A short position has been taken, as indicated by the red (stop-loss) and green (take-profit) zones.Multiple gain in Gold
mbaberhanif
TURBO

The price may pull back and appears to be approaching a key support level around 0.003100 USDT, which was also a previous area of interest. There's an indicated potential for the price to find support within zone 0.003100 USDT and then rebound towards the 0.005600 USDT level. This suggests that while there might be further short-term volatility, the market could be looking for a base before attempting another move higher. Use stop loss at 0.002266 to manage your risk.🚀🚀🚀
mbaberhanif
XAUUSD

The price recently rallied strongly but is now testing a descending trendline resistance around 3,375-3,376. A short position has been taken, as indicated by the red (stop-loss) and green (take-profit) zones.
mbaberhanif
PNUT | Is This A Flag Pattern?

PNUT shows a descending channel pattern, indicating a downtrend. The price recently broke below mid-channel support and is currently trading at $0.2839, down 3.11%. The descending trendlines suggest continued bearish pressure. A long position is marked on the chart, with an entry near the current level, a take-profit target around $0.34 near the upper trendline, and a stop-loss near $0.2090 below the lower channel boundary. This setup implies a bullish counter-trend trade within the channel, anticipating a bounce from the lower support trendline. Volume has recently increased, hinting at stronger market activity as price approaches the lower boundary.Running +25% in profit so far from then mentioned entry level, use trailing stop loss
mbaberhanif
MOVR | Flag Pattern

Flag pattern is about te break out level, after confirmed break out in daily timeframe, expecting 50% bullish wave
Disclaimer
Any content and materials included in Sahmeto's website and official communication channels are a compilation of personal opinions and analyses and are not binding. They do not constitute any recommendation for buying, selling, entering or exiting the stock market and cryptocurrency market. Also, all news and analyses included in the website and channels are merely republished information from official and unofficial domestic and foreign sources, and it is obvious that users of the said content are responsible for following up and ensuring the authenticity and accuracy of the materials. Therefore, while disclaiming responsibility, it is declared that the responsibility for any decision-making, action, and potential profit and loss in the capital market and cryptocurrency market lies with the trader.