
malmsteen23
@t_malmsteen23

What symbols does the trader recommend buying?
Purchase History
پیام های تریدر
Filter
Most underrated chart?? /// S&P500 /// $7500 bull market target
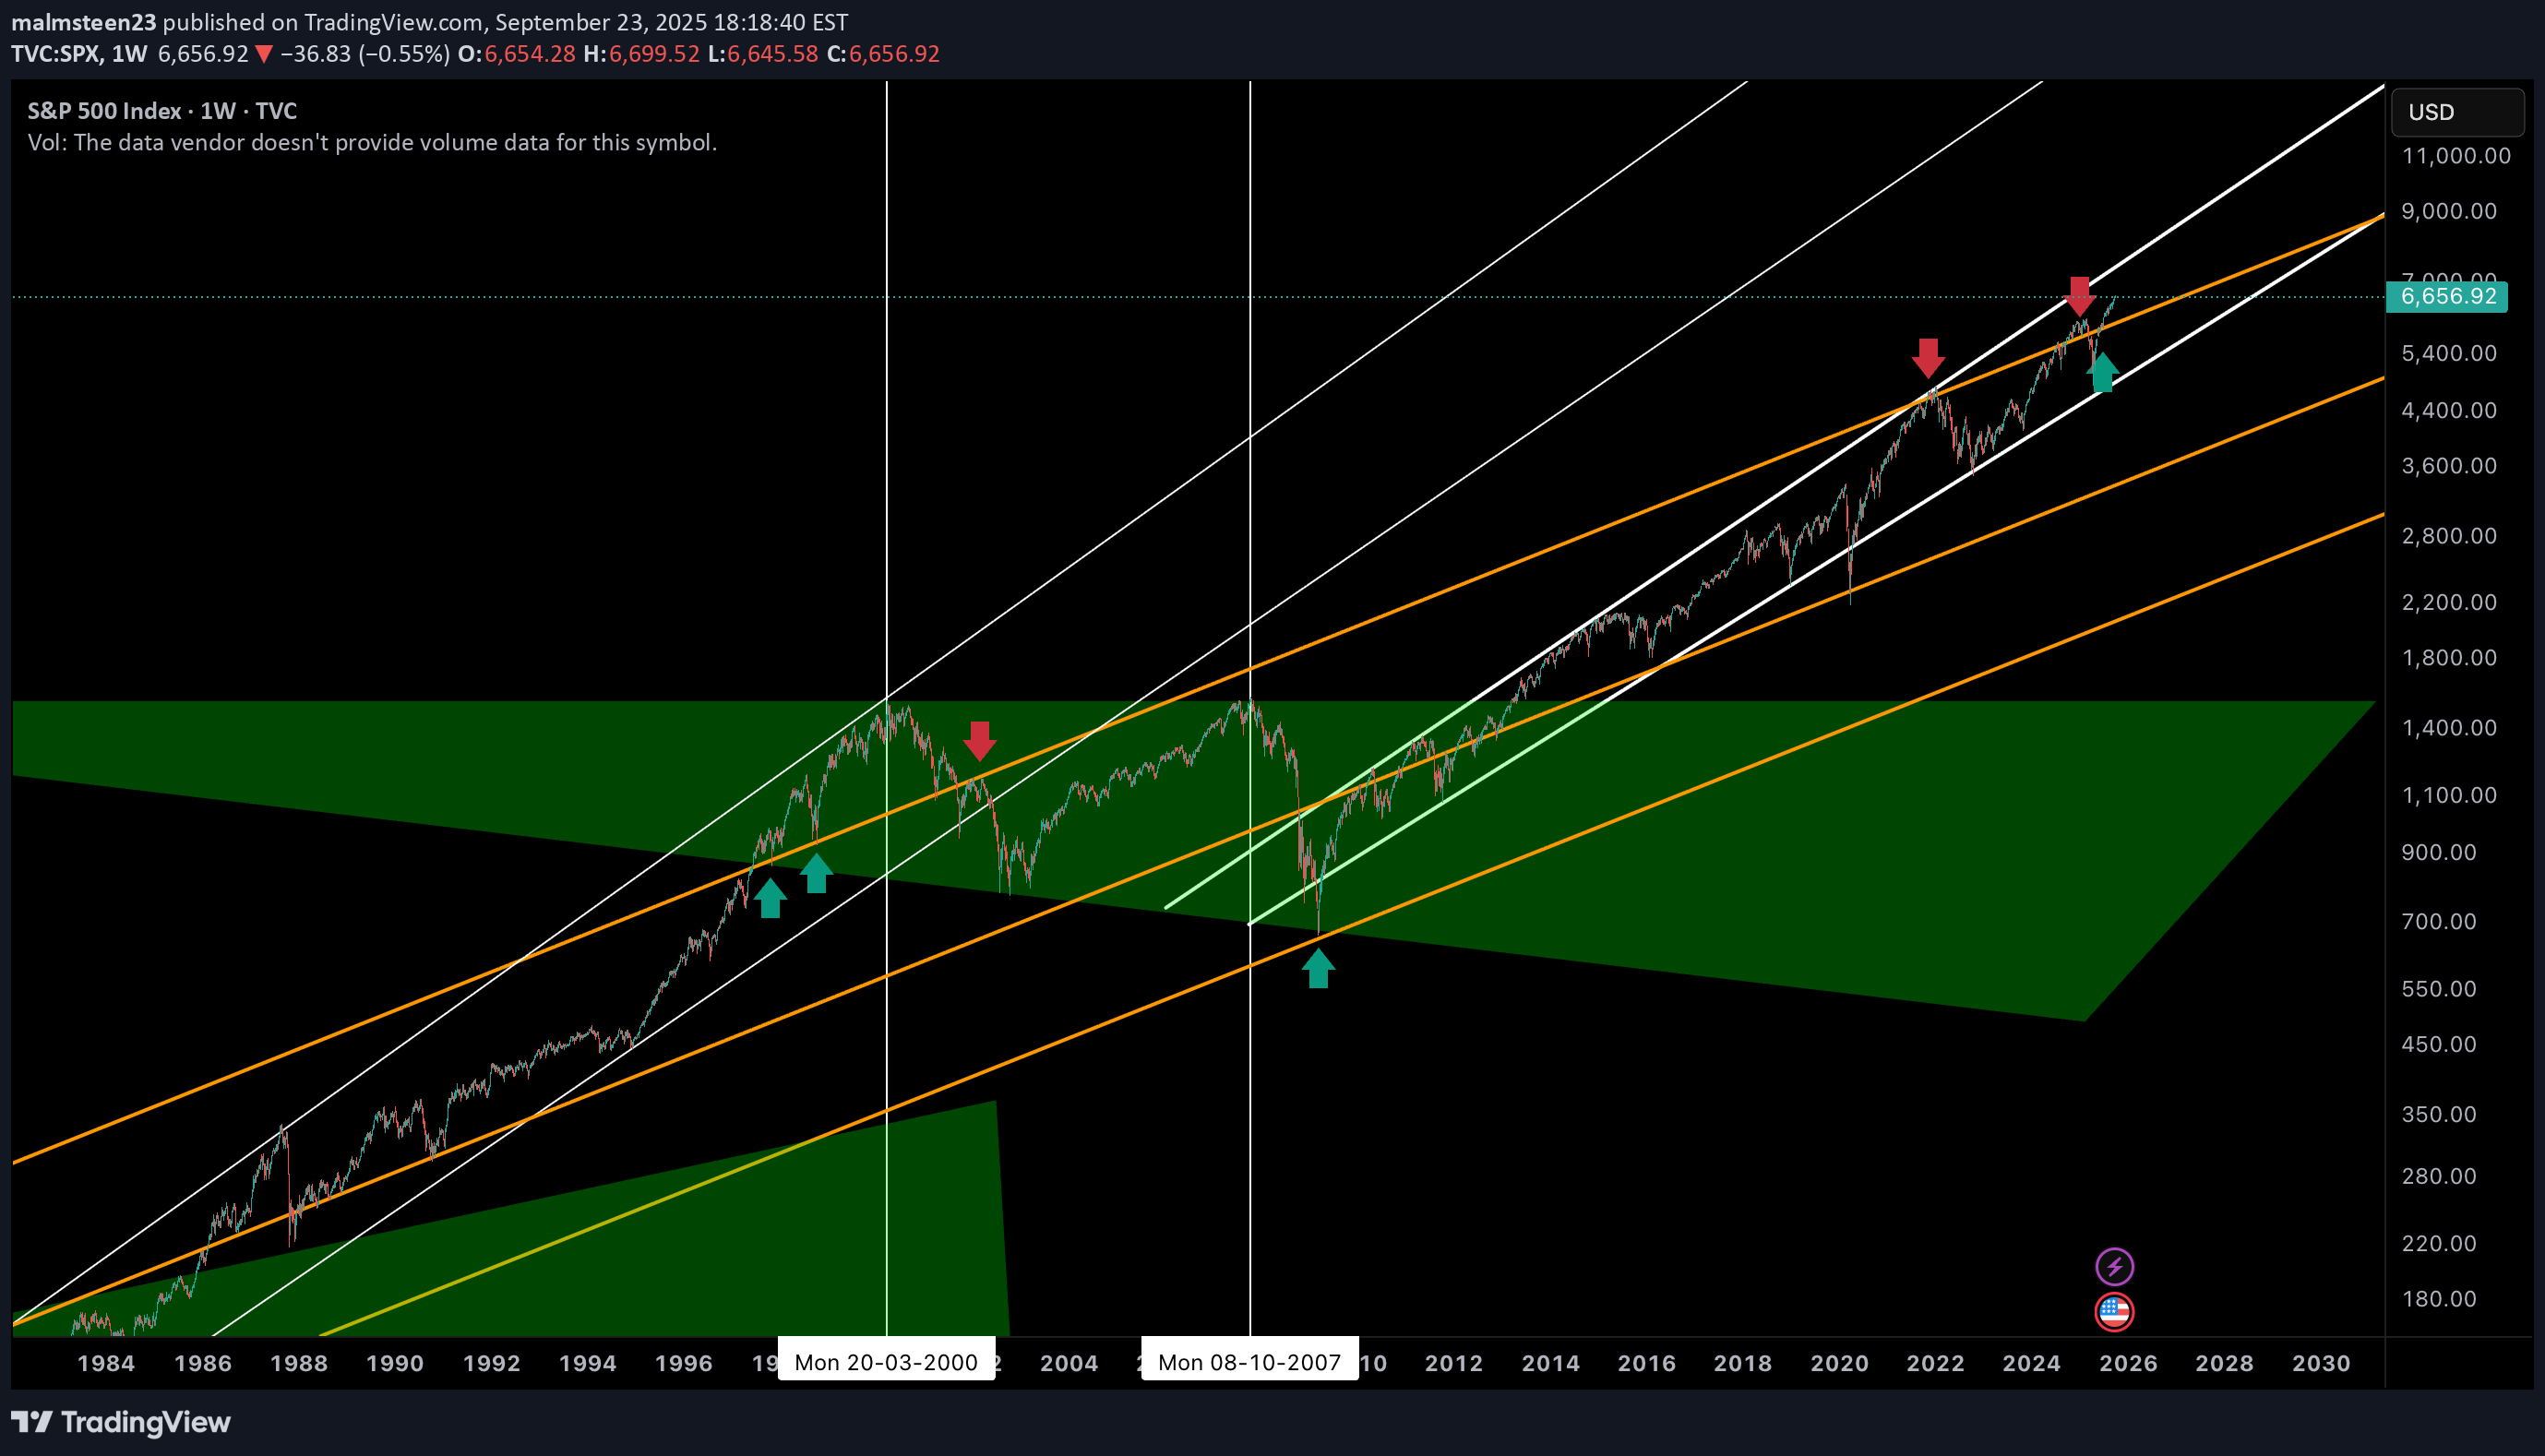
Most underrated chart out there? We are on the end of raging bull run where we broke out in 2013 and been going higher and higher since then. We gone top out at around $7500. The two green circles is where the points on the ray line is and the two other ray lines is a clone of that bottom line. Hope the chart is helpful. The stage is set. Hope this chart is helpful.
looking back at this chart 2026

1. btc tops out around october next year around 150-160k 2. end of 2026 we bottom out at around 56k
bitcoin to the moon

bitcoin to the moon dvnnv vnnvjn fvnnvjd nfvjfn nvnjfn jnvjfnv jvndfjvn

Bitcoin Ultimate Bear Marked Prediction

The only pattern i can find and make most sense of is the falling wedge. The white lines on the chart is the where i think its most support or resistant is right now. One of the white support lines dates all way back to 2017 and 2019 and acted as support and resistant, and are the only thing stopping btc too 17k right now. A really historic line that i think will be broken. (Every line is 100% correct as i have used two coordinates per line and exact on the wick.) The lines for the falling wedge may get moved over time because as we all now the macro economic is bad and going to be badder. S&P 500 from 2007 house marked crash took from top to bottom 510 days.I think this bear marked gone be a little bit longer and i think the bottom is between 10-12k. The marked will turn when inflation is going SIGNIFICANTLY DOWN. The economy need to be super super bad if we go below that. So i think we will get our bottom in mid 2023. I am full cash around 40k and gone go mayhem when I feel the marked has bottomed. PS. Wrote this in a hurry
Falling wedge idea non Logarithmic chart idea

Only posting this to see if my predictions gone play out or not. 0% that this gone HAPPEN! I think personally 11-12k gone be our bear marked bottom. Check out my other chart with a log chart.
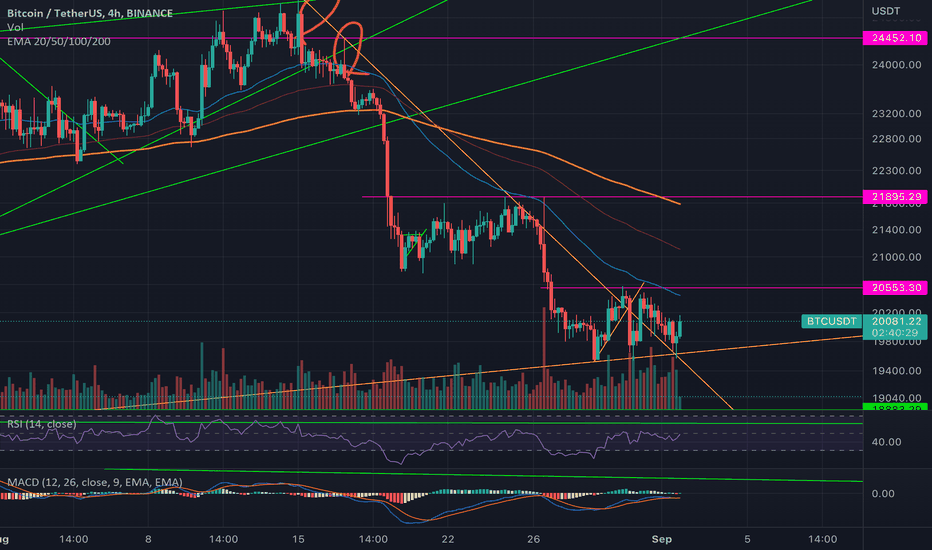
Falling wedge idea

Falling wedge coming up. A falling wedge pattern is signified by lower lows and lower highs. Therefore, it results in declining support and resistance trend lines. However, the resistance trend line falls sharply compared to the support trend line, resulting in a falling wedge pattern. What do you think?
13k here we come
we all gone make generational wealth when btc dose a quick 13k dip before going up to all mighty 100
WHERE I THINK BTC GONE MARKED BOTTOM! Around 14k by march 2023!

I have also taken in mind that the feds gonna increase rashes. On the chart we got increasing volume and thats really bad. Falling wedge pattern, but i want to see a new touch on the support and resistance line to increase my bias for this pattern. In the my on chain analysis i think 14k is a huge support for btc and where both my technical and on chain -analysis match each other. (Made this one to look back in march 2023 and see if I called the bear marked bottom or not lol(:)

Disclaimer
Any content and materials included in Sahmeto's website and official communication channels are a compilation of personal opinions and analyses and are not binding. They do not constitute any recommendation for buying, selling, entering or exiting the stock market and cryptocurrency market. Also, all news and analyses included in the website and channels are merely republished information from official and unofficial domestic and foreign sources, and it is obvious that users of the said content are responsible for following up and ensuring the authenticity and accuracy of the materials. Therefore, while disclaiming responsibility, it is declared that the responsibility for any decision-making, action, and potential profit and loss in the capital market and cryptocurrency market lies with the trader.