
lil_Buuck
@t_lil_Buuck

What symbols does the trader recommend buying?
Purchase History
پیام های تریدر
Filter
Signal Type
lil_Buuck
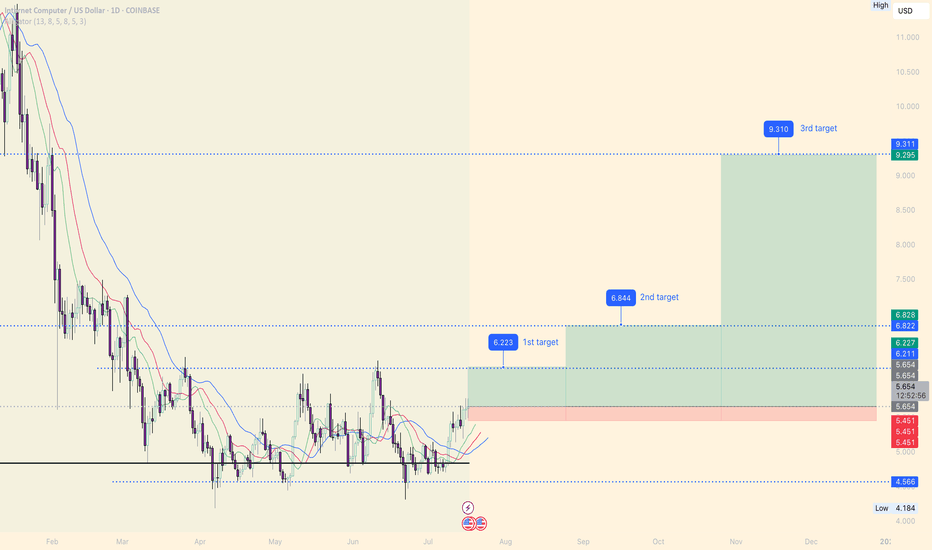
Alligator indicator is showing a bullish flip with widening moving averages. As altseason begins to show momentum across mid-cap coins, ICP aligns technically for a significant breakout if $6.22 flips to support. Watching for volume confirmation and BTC stability to fuel continuation. TP1: $6.22 TP2: $6.84 TP3: $9.31 🛑 Stop-loss: below $5.45 Altcoin Season Index (ASI), currently rising sharply towards 40+, indicating early signs of altseason momentum. coinmarketcap.com/charts/altcoin-season-index/1st target reached
lil_Buuck
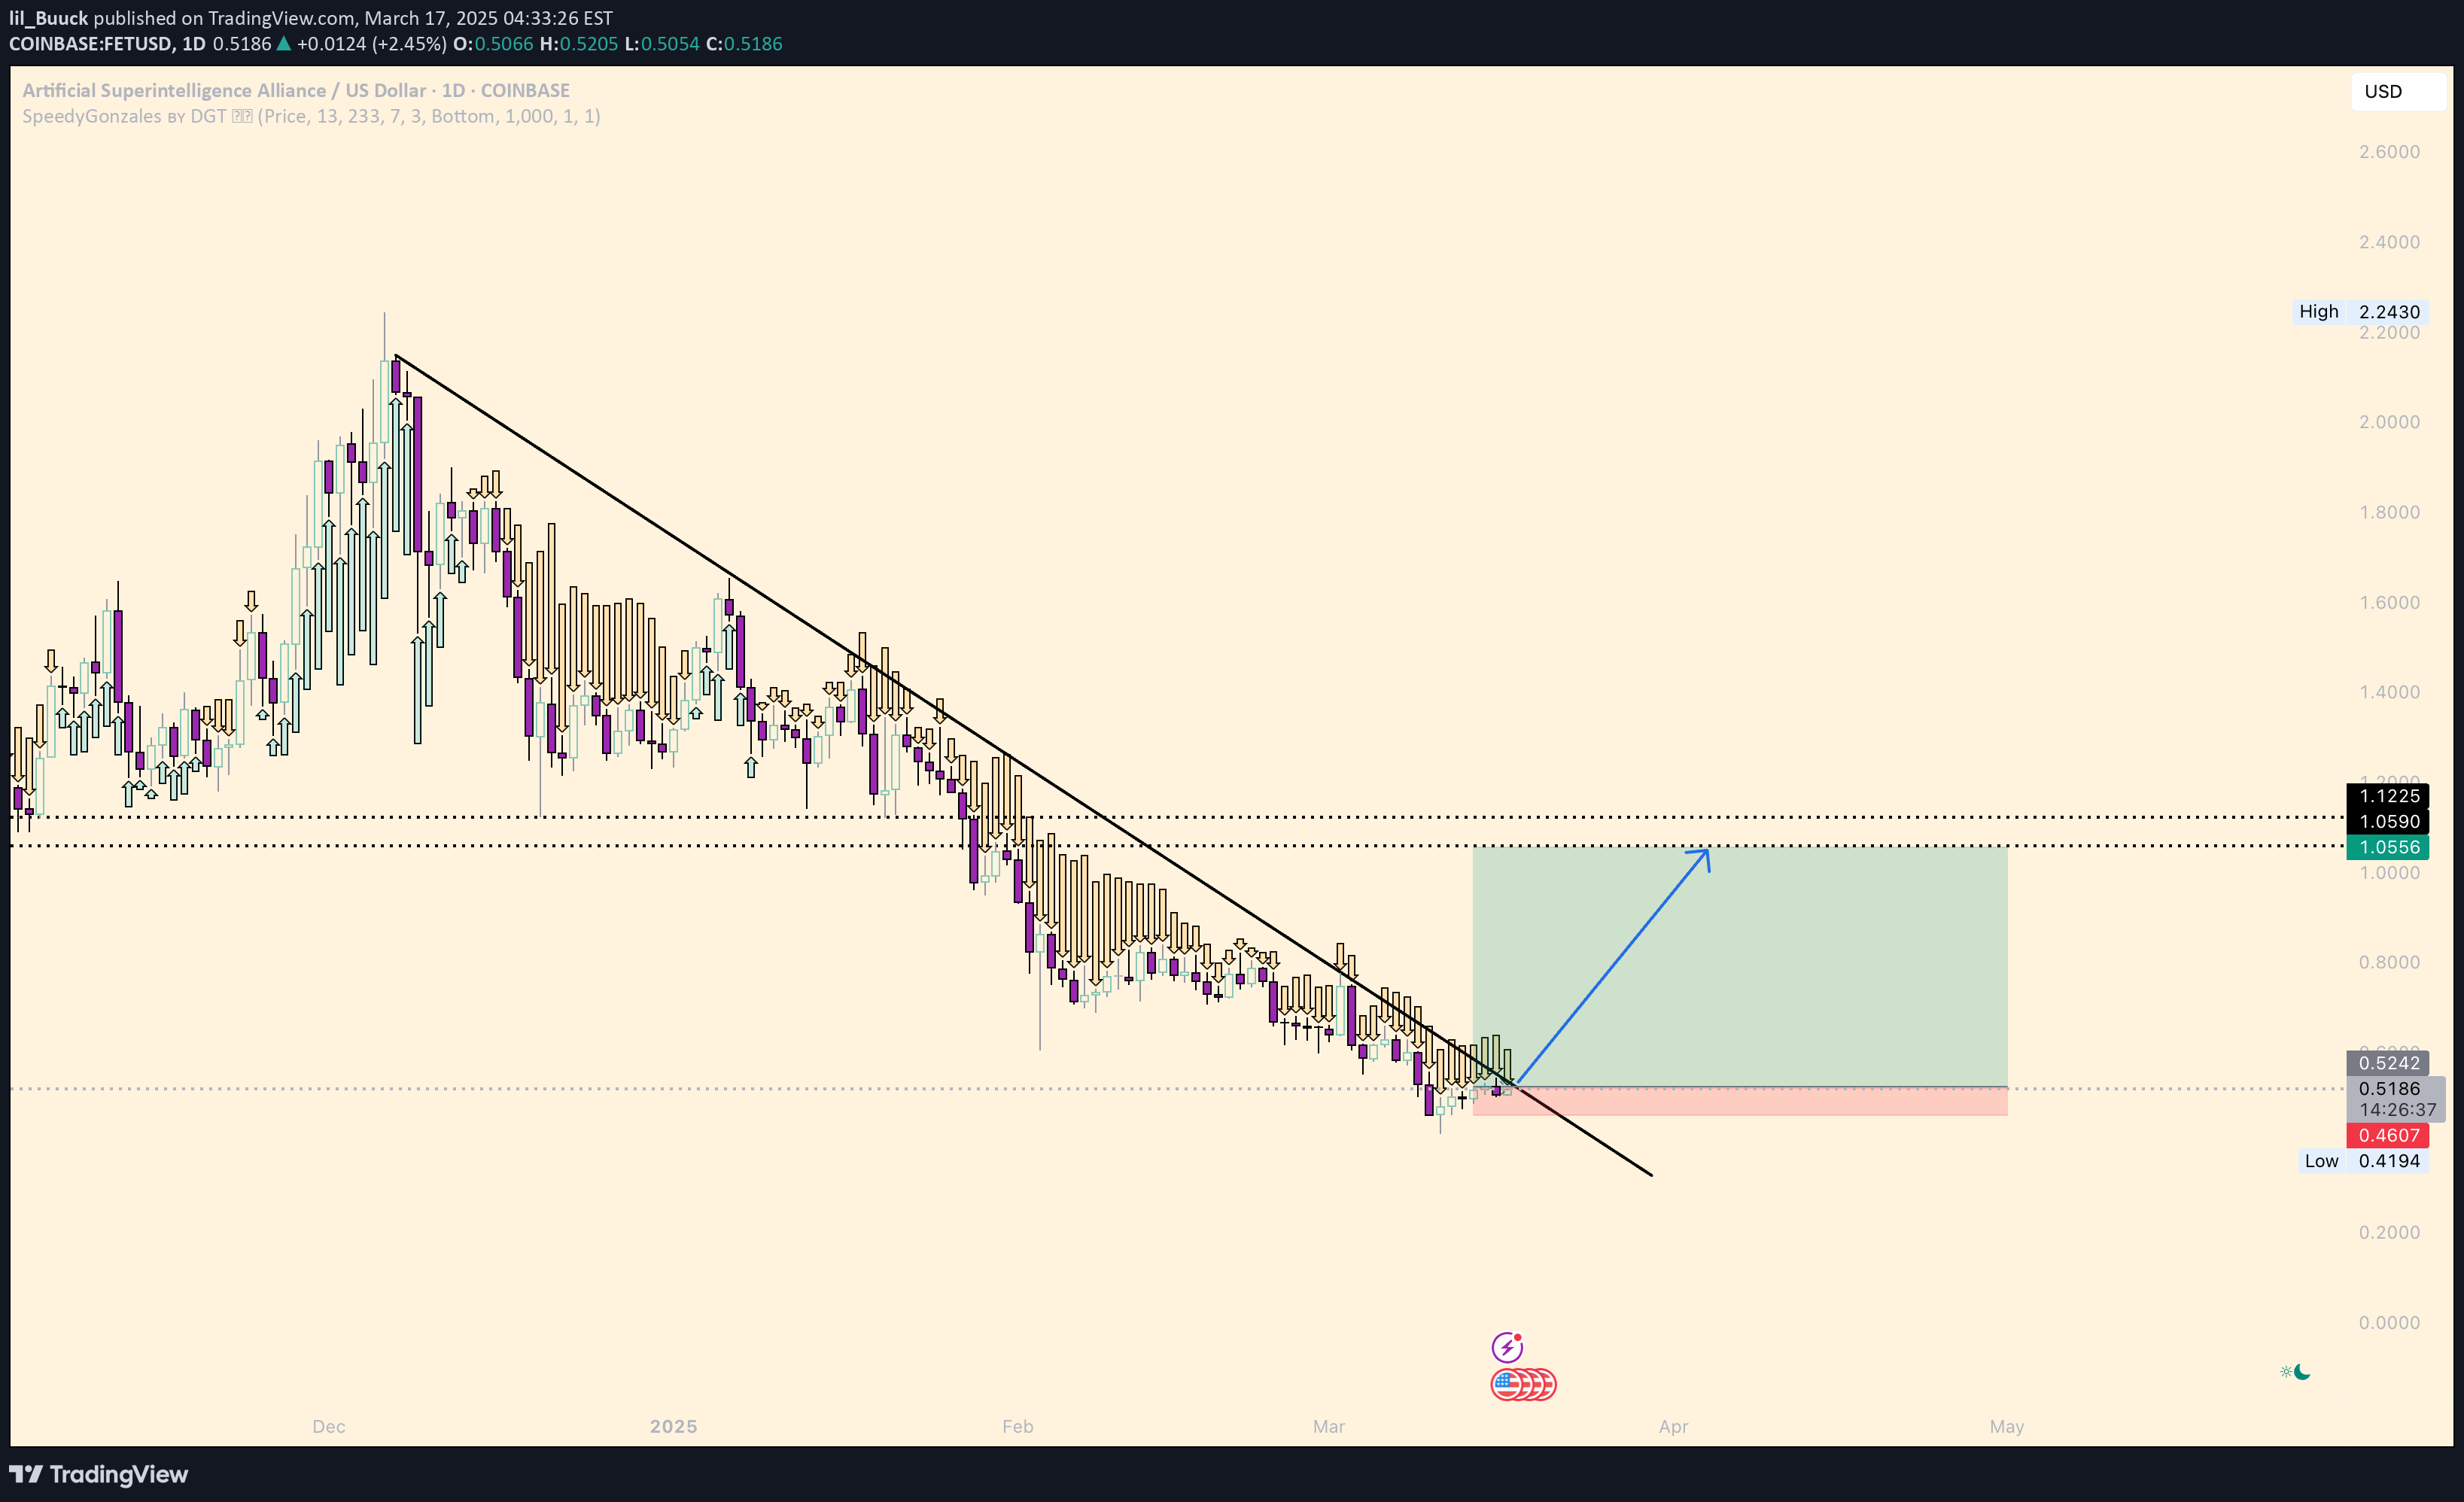
Looking on the daily timeframe, we've seen a clear downtrend from the $2.24ish highs, with price respecting this descending trendline for months. However, we might be approaching a significant reversal opportunity. If price can close decisively above the trendline, this could trigger a significant rally targeting the $1.00 psychological level first, with potential to reach the $1.05-$1.12 zone. Entry strategy: Stop loss below recent low at $0.46 First target: $1.00 Second target: $1.12
lil_Buuck

BTCUSD We're currently at a significant support level after breaking below the ascending trendline and a descending triangle pattern. This is truly a make-or-break moment for Bitcoin in the short term. Price has broken below the multi-month uptrend line Descending triangle pattern broken to the downside Currently testing horizontal support No major support until ~72K if current level fails EMA stack still has some bullish structure but momentum weakeningBouncing of the 87k support. Let us see if it will reclaim 90k or break the support for more downside.
lil_Buuck

Price has reached a critical support zone - Looking for strong rejection or breakdown. Bollinger Band Contraction Bands (purple lines) showing significant narrowing Price consolidating near the lower band Squeeze pattern suggesting imminent volatility expansion TTM above zero line VFI (Volume flow indicator by Markos Katsanos) (not shown on chart) Crossing above zero line - buy signal Given the bearish context, any long positions require tight stops
lil_Buuck

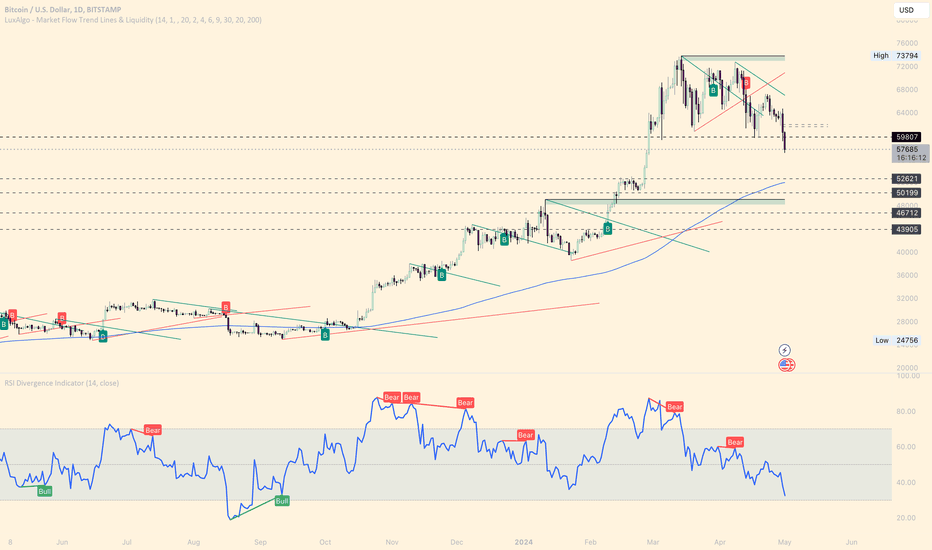
Bitcoin is showing promising signs on the weekly chart. The long-term uptrend remains intact, as evidenced by the series of higher lows and highs from the $15,460 low to current levels above $65,000. A key development to watch is the RSI indicator, which is on the verge of crossing above its 21-period EMA. This potential crossover on a weekly timeframe is a significant bullish signal, suggesting building momentum that could support further upside. Adding to the bullish narrative, the price is approaching a descending trendline resistance. A breakout above this level, coupled with the RSI/EMA crossover, could pave the way for a test of the previous high at $73,835. Overall, the combination of strong price action, the potential RSI indicator crossover, and the approach to key resistance levels paints a bullish picture for Bitcoin in the medium term. Keep a close eye on how price interacts with the descending trendline and whether the RSI confirms its crossover in the coming weeks.The happeningSimple and precise 🚀
lil_Buuck

Hitting the Anchored VWAP from the bottom in Jan 24. Think we will see support here at 62k and push back up to 66k before running into some resistance again.
lil_Buuck

After a rather steep correction to a bit below 0.618 fib. Bottom looks to be in. First target around 15.3 - approx 40% increase from current level. Small goldencross incoming and break of the declining trendline. TIAUSD
lil_Buuck
I think we are seeing an opportunity for entry around the 200 Ema for the big Crypto's BTC, ETH, SOL. This is the flush, an ideal time to hop in and buy, since these areas are generally where markets will bounce back higher. Don't panic and buy before the next leg up.
lil_Buuck
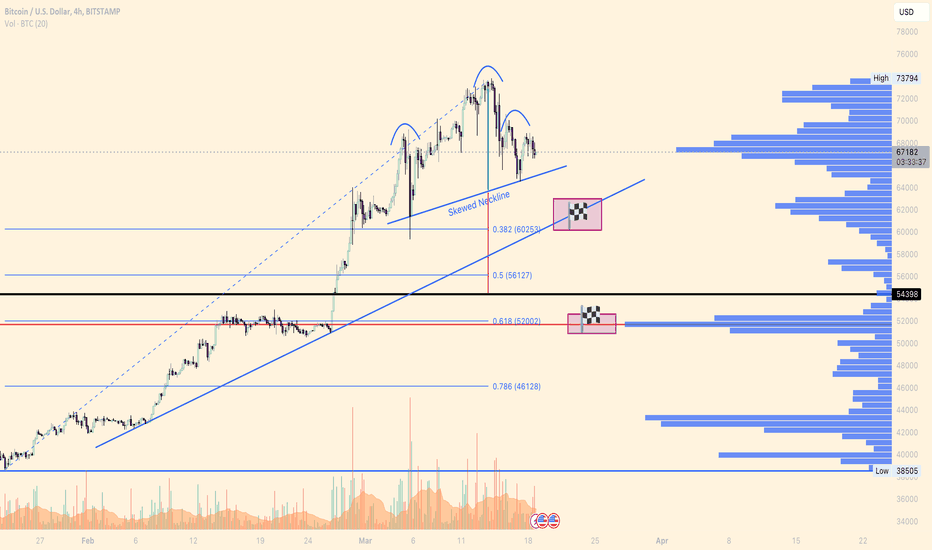
Waiting for break of the skewed neckline. 1st target around 60k - fib 0.382 retracement - trendline 2nd target around 52k - fib 0.618 retracement - POCBreakthrough neckline and retesting it before further downsideFirst target reached 🏁 Now we will see if the trendline will act as support otherwise it will be free fall to 52kCould be forming a small Inverse head and shoulders and continue up to test the upper parallel channelnot quite the cleanest IHS but seems to have broken the downward trend and will try and drill through the 68k resistance, if so we will be onto new heights soonWe actually had another IHS and now seems like it has the power to drill through the blocks of resistanceJust testing the trendline again and it will resume upwards movement againEagerly waiting for the breakout of the bullish wedge. Daily EMA's are still clearly bullishhere we go, breaking out of the wedge
lil_Buuck

A move down to 25,400 was a perfect opportunity for buyers as we can see BTC have printed a Bullish Doji candle. BTC hit the lower band, which has shown that it is time to scoop up the sats. Bitcoin also landed perfectly on the vwap from the corona bottom and also the 200 weekly moving average. We also see divergence on the volume indicator which could indicate a good time to get ready for a move up. All in all - a move up to 40K seems rather likely. From there BTC might meet a lot of resistance and a selloff is expected and a double bottom could be formed in the next couple of weeks.
Disclaimer
Any content and materials included in Sahmeto's website and official communication channels are a compilation of personal opinions and analyses and are not binding. They do not constitute any recommendation for buying, selling, entering or exiting the stock market and cryptocurrency market. Also, all news and analyses included in the website and channels are merely republished information from official and unofficial domestic and foreign sources, and it is obvious that users of the said content are responsible for following up and ensuring the authenticity and accuracy of the materials. Therefore, while disclaiming responsibility, it is declared that the responsibility for any decision-making, action, and potential profit and loss in the capital market and cryptocurrency market lies with the trader.