
krisztiankabat
@t_krisztiankabat

What symbols does the trader recommend buying?
Purchase History
پیام های تریدر
Filter
krisztiankabat
Bitcoin on the edge

As is often the case, we're back to discussing the future of your digital gold. Where is it headed? We can approach this question from several angles: analyzing Bitcoin's current situation from either a fundamental or technical perspective. For now, let's focus on the technical side. Looking at the chart, I identified the price level to which Bitcoin was most sensitive in 2021. My analysis clearly points to one specific level: $59,000 Three years ago, this price level triggered a 50% correction first, followed by a 30% correction. The good news is that it has tried to break down once in the beggining of may, but it is holding for now. The bad news is that the price action indicates sellers are currently in control, as evidenced by the steadily declining price. The bottom line: Wait until the situation becomes clearer. It has been almost three months since this balance period started, and it will likely resolve sooner rather than later. Stay tuned, and I will update this post with fresh price action news!We experienced a surge in buying momentum on Wednesday following the inflation report. This momentum pushed the price above two significant levels: 1) This balance point of control (POC) 2) The weekly and daily breakout point where the initial breakout attempt began Additionally, the price pattern resembles an inverse head and shoulders, which can act as a bullish continuation formation. To summarize: The current price action indicates that the bulls are in control. What’s next? A break and sustained movement above 67.8k could propel the price into the 80k range. Conversely, a break and acceptance below the point of control could drive the price down to at least 59k. The visual content below:The week started with the inverse head and shoulders breakout. At the same time we had the diagonal breakout too. So for now, there are no signs that buyers should be worried. Since the situation is so clear, the first warning sign might be if 1) we are stuck above the breakout level for a prolonged period of time with no further progress 2) if we break the breakout level I think this week's price action will be telling4 days since the breakout, and we still hold the important pivot 68k level. There have been 2 intraday attempts to break down, but so far it looks (4 hours to go until close today) that both attempts have been just a daily wick. Looking further into the lower timeframes, it is clear that the sellers are underwater for now. (I highly recommend using the Time & volume point of control / quantifytools indicator, it shows potential bad positioning, for example: trapped sellers at support or trapped buyers at resistance) But now the weekend is coming, which usually means lower volatility. What I personally would like to see is the 69 000 number next to the bitcoin name by the time we turn to Monday's market opening. To summarize, this is what we are looking at this time: a successful inverse head and shoulders breakout and a successful retest. Have a good weekend everyone, we will continue next week!
krisztiankabat
Wait for a deviation play #BTC
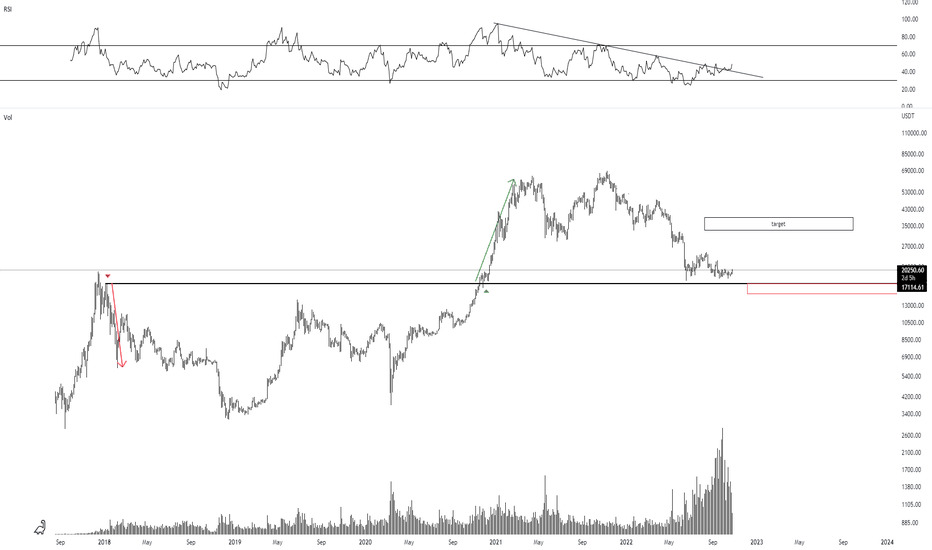
Hi everyone! I did the high time frame analysis on BTC (same as ETH). I think we have not seen the bottom yet. Why? It is widely accepted that previous ATH was the range high...but I'm not convinced. Look at the chart: 1) I have highlighted in red the backtest that triggered the selloff 2) I have highlighted in green the backtest that triggered the upmove Important level and BTC not even touched...a coincidence? Located just below the current range, with a large amount of potential liquidity. What do you think if we break below the current range? Everybody will open a short to 10k ("same as the previous 6k level"). Perfect setup for a bear market rally. Of course, it can go straight to 33-38k but I tend to be cautios in these type of market and look for max pain. Let's see!Decision time
krisztiankabat
Ethereum deviation? #ETH

Hi Everyone! "simplicity is the ultimate sophistication" Looks like a weekly deviaton at previous ATH...and a retest with a high volume up momentum so far. -High volume at the lows - "you need volume to stop the falling" (Technical and Stock Market Analysis Profits - by Richard W. Schabacker) -RSI downtrend broke, 2 rounded bottom retest My target is 2500-3000. Only concern is BTC: Let's see!BTC reference:
Disclaimer
Any content and materials included in Sahmeto's website and official communication channels are a compilation of personal opinions and analyses and are not binding. They do not constitute any recommendation for buying, selling, entering or exiting the stock market and cryptocurrency market. Also, all news and analyses included in the website and channels are merely republished information from official and unofficial domestic and foreign sources, and it is obvious that users of the said content are responsible for following up and ensuring the authenticity and accuracy of the materials. Therefore, while disclaiming responsibility, it is declared that the responsibility for any decision-making, action, and potential profit and loss in the capital market and cryptocurrency market lies with the trader.