
knox_365
@t_knox_365

What symbols does the trader recommend buying?
Purchase History
پیام های تریدر
Filter
knox_365
new highs in something like 1W of d..

This as of late recorded coin has an excellent possibility of making new highs in something like 1W of diagram examination. Now, it opened in the 2H period and has a support zone and a resistance zone. Contingent upon the US CPA Data we might have two buying zones. The first is somewhere in the range of 9.26 to 8.9. The second is the purchase zone regarding resistance against the obstruction mark which is between 10.62. & sell zone will be, 10.92 to 13 at a new high.
knox_365
Demand Zone, Supply Zone, Ascending Triangle in....

Demand Zone, Supply Zone, Ascending Triangle in.... Demand Zone, Supply Zone, Ascending Triangle in Four Hour Time Frame on Bitcoin Chart. In the event that it adversely affects the market notwithstanding the sideways, then our initial two support levels can be hit, which is out of roughly 29200. If the market has somewhat more adverse consequences, we will see a flame contact at the support level 29000. BTC
knox_365
Overall support for Bearish will range fr.......

Overall support for Bearish will range fr....... After early examination, Bitcoin's 1D time frame remained below the 100EMA. Although this is sometimes classified as bearish, it is also acting in a double-button pattern, which is bullish. As a result, the existing pattern is unclear. The Bitcoin chart pattern and the Bitcoin_CME may be compared. Additionally, according to Bitcoin CME, Bitcoin may go in the direction of bullishness for a while—roughly 27 thousand labels. The most important fact, however, is that even if Bitcoin passes the $27,000 mark, it will continue to trade below the 100EMA, which is bearish on the 1D timeframe. Our overall support for Bearish will range from 25,000 to 25,400. BTC
knox_365
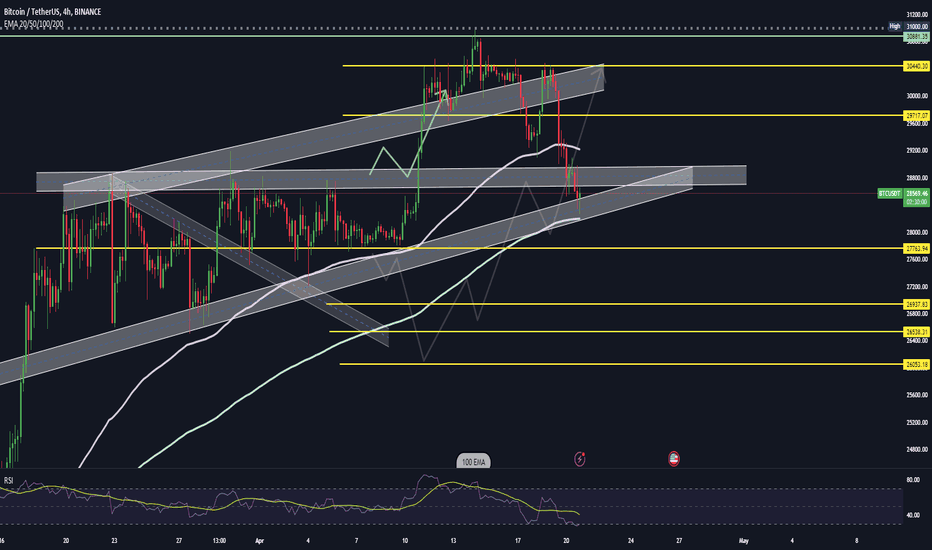
M pattern has formed in the 4-h...............

M pattern has formed in the 4-h............... Another important update for Bitcoin is that an M pattern has formed in the 4-hour time frame. broke the support level of 27 thousand 600 and tried to take retouch.But ALL the candle are closed below 27,600. Therefore, you can understand that even a slight negative information in the market today can affect the market in a very bad way. Otherwise the whale game may be played. BTC
knox_365
see support above the 100-day moving average

see support above the 100-day moving average Bitcoin was frequently finding support above the fifty-day moving average in the one-day time frame. However, Bitcoin has been trading below this support level for the past three days. Additionally, the last two candles have crossed down and closed below the support level of 27600. If the CPI data turns negative, then we can see support above the 100-day moving average, according to today's analysis. More importantly, we had another support level below the fifty-day moving average (27600). which is around 26000. However, there may be a candle here that closes below 26000, but it will close above 26000. BTC
knox_365
must finish above the 200 EMA.BULLISH
recently stated that Bitcoin's highest support level is between 28000 and 28400. However, based on the current situation with Bitcoin over the past two days, the market has been moving in a downward direction. However, this downtrend was in line with my strategy. Those who followed my plan are without a doubt making money. Bitcoin is at a support level at the moment, and naturally, it is taking support above the 200EMA. However, the RSI indicator reached the 30 level twice in a row, indicating that it was already oversold. From 28 thousand, I am therefore optimistic. We may face a second downtrend, but we must finish above the 200 EMA. Otherwise, 27200 to 27600 is our next common support.BTC
knox_365
can touch the resistance level of 26,500 to 26,000 before

At the moment, Bitcoin is situated within an ascending triangle. The Bitcoin chart is being analyzed in a variety of ways by a lot of people, but Bitcoin Technical Analysis has not been followed for a long time. Based on my analysis, I can see that the price of 27600 serves as a support and resistance level for a long time. In my experience, Bitcoin can touch the resistance level of 26,500 to 26,000 before reaching 30,000 if two to three candles close below the support level of 27,600 in the 4-hour time frame. On the other hand, if it crosses the resistance level of 28800 and retouches and up, we can see up to 30k.BTC
knox_365
reach its highest resistance level

You can see that the Bat_token is going to reach its highest resistance level for the seventh time. Additionally, despite the fact that Bitcoin is hovering around 24k at the moment, we do not observe any indication of a downtrend in the Bat_token. Despite the fact that we traded a lot on this coin, Now, the most crucial aspect is that this chart of Bat_Token opened in a single day. If a candle closes above 0.336 to 0.36 in a single day, an uptrend from 0.4 to 0.48 is certain.
knox_365
support level will be 0.93 to 0.91.

The kava coin is positioned within a descending channel within the four-hour time frame. And if you take a look you will see that it is trying to break out the descending channel for the seventh time since last January 18th. It is currently positioned within support which is approximately 0.97. If the counter is able to breakout within this four hour time frame then we can definitely see 1.08 to 1.148. Another thing is the RSI indicator. This indicator shows that every time this coin has taken the support of 70, it has taken a downward correction, so our next support level will be 0.93 to 0.91.
knox_365
close eye on the price action

ETHUSDT is currently in an accumulation phase below the weekly resistance level of 17000 dollars, indicating that the price may be consolidating before moving. It's possible that traders are waiting for a price breakout above the resistance, which could indicate that the uptrend will continue and that a new high will be confirmed. According to Plancton's strategy, we are able to set a nice order because it is essential to keep a close eye on the price action and effectively manage risk when trading. The next target could be around 1750 to 1800.
Disclaimer
Any content and materials included in Sahmeto's website and official communication channels are a compilation of personal opinions and analyses and are not binding. They do not constitute any recommendation for buying, selling, entering or exiting the stock market and cryptocurrency market. Also, all news and analyses included in the website and channels are merely republished information from official and unofficial domestic and foreign sources, and it is obvious that users of the said content are responsible for following up and ensuring the authenticity and accuracy of the materials. Therefore, while disclaiming responsibility, it is declared that the responsibility for any decision-making, action, and potential profit and loss in the capital market and cryptocurrency market lies with the trader.