
kdeneme
@t_kdeneme

What symbols does the trader recommend buying?
Purchase History
پیام های تریدر
Filter
kdeneme
تحلیل تکنیکال اتریوم (ETH): فرصت خرید جدید با سیگنالهای صعودی قوی!
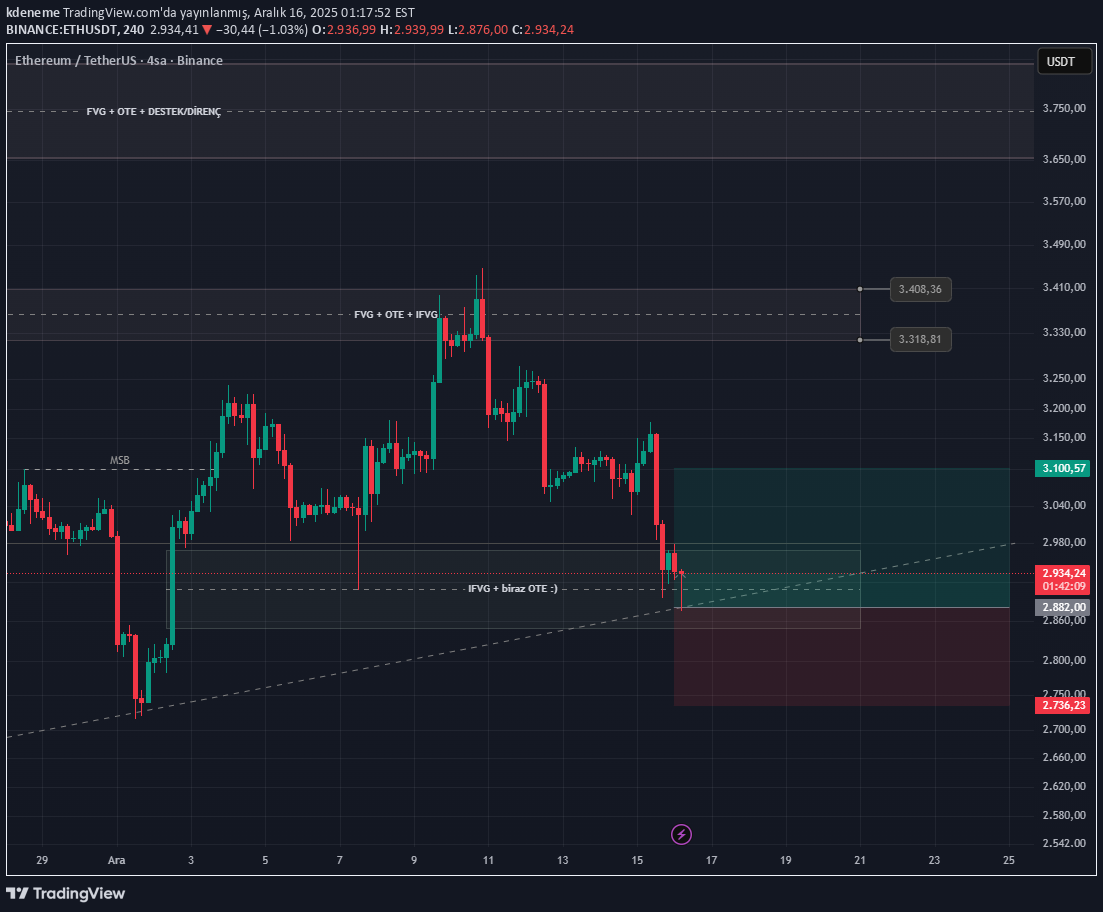
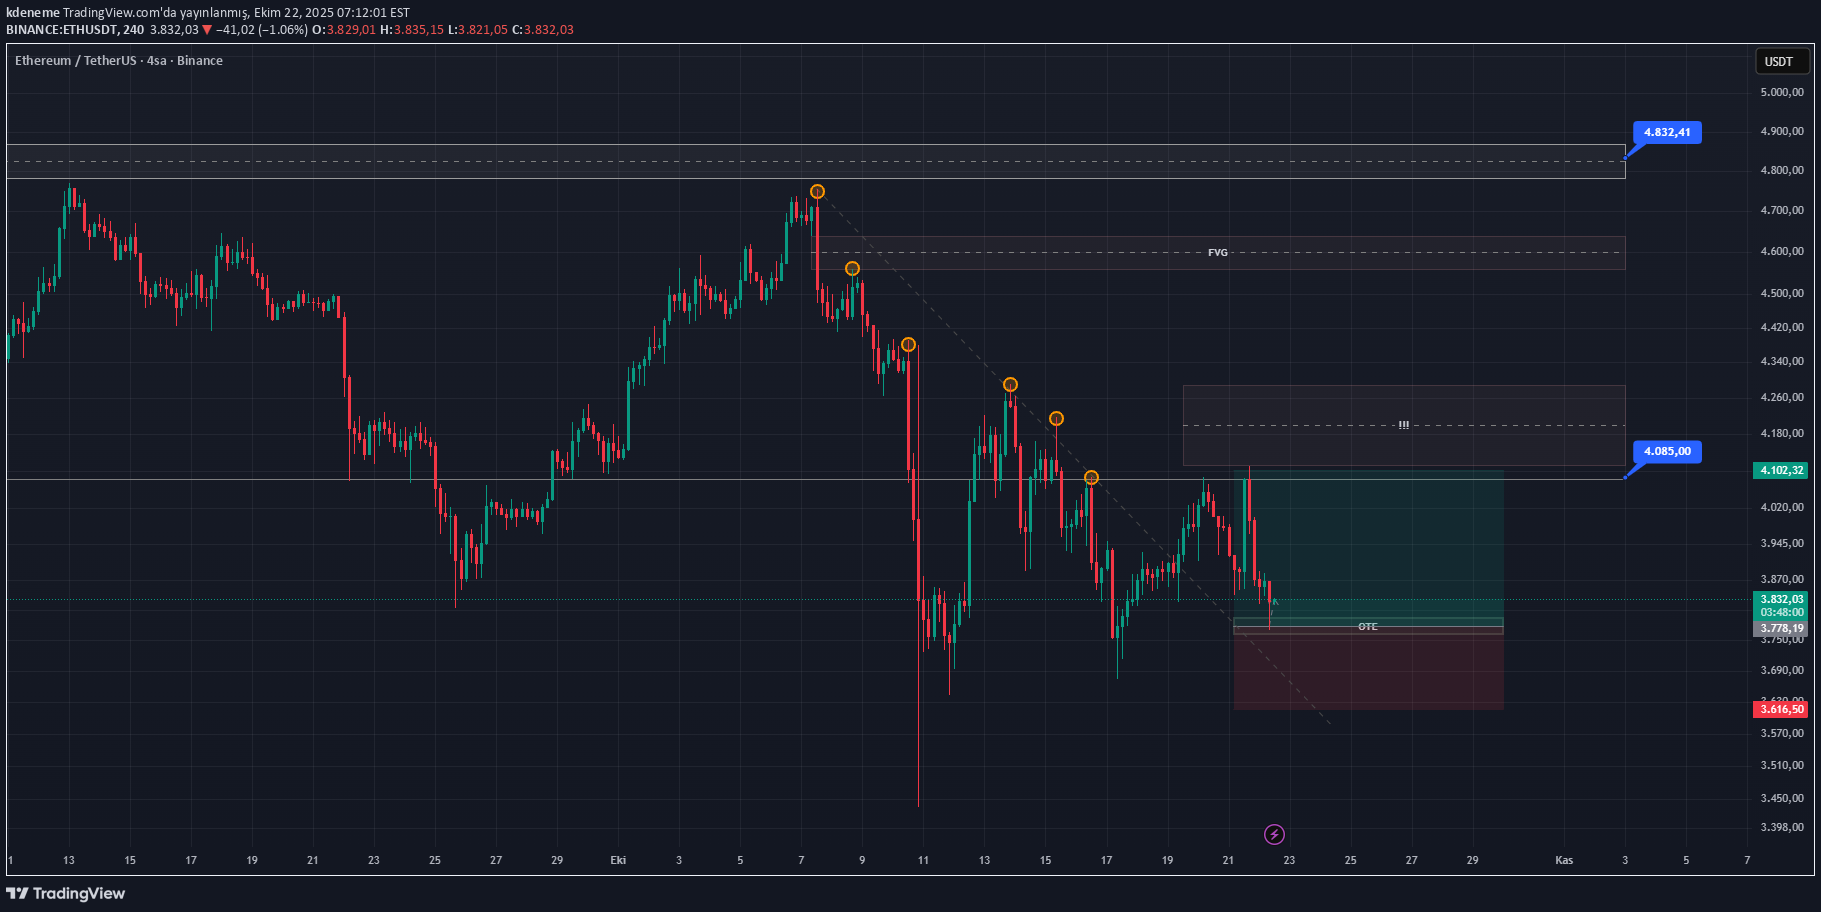
📢 #ETH (#Ethereum) Technical Analysis Study Hello, ETH is currently located in a very remarkable area. The last closed gap and the cooling in the RSI value show that it offers a not bad opportunity for entry. In my previous analysis, I stated that it was possible to buy from this region and that it would be logical to sell in the 3,300-3,500 range, and that's exactly what happened. Now it has returned to these levels again. Filling of gaps in FVG and liquidity of near bottoms provide strong signals for an upward move. Therefore, technically there are good signs if it wants to go up. In my own system, I set up a setup with a 1.5 R/R ratio, leaving approximately 5% stop margin. For a more aggressive approach, a 10% stop with 2x leverage can be considered. It is important to stop; There's no room for romance if things go wrong. The situation is even more advantageous for those who want to trade in the spot market. Because in this scenario, the stop rate will be around 10% and we will manage our risk better by placing a stop below the near bottoms. This strengthens our hand. I follow the results. This study is purely my personal analysis, it is not investment advice. Thank you, Good luck! 🚀
kdeneme
#XRP - (#Ripple) Teknik Analiz Çalışması
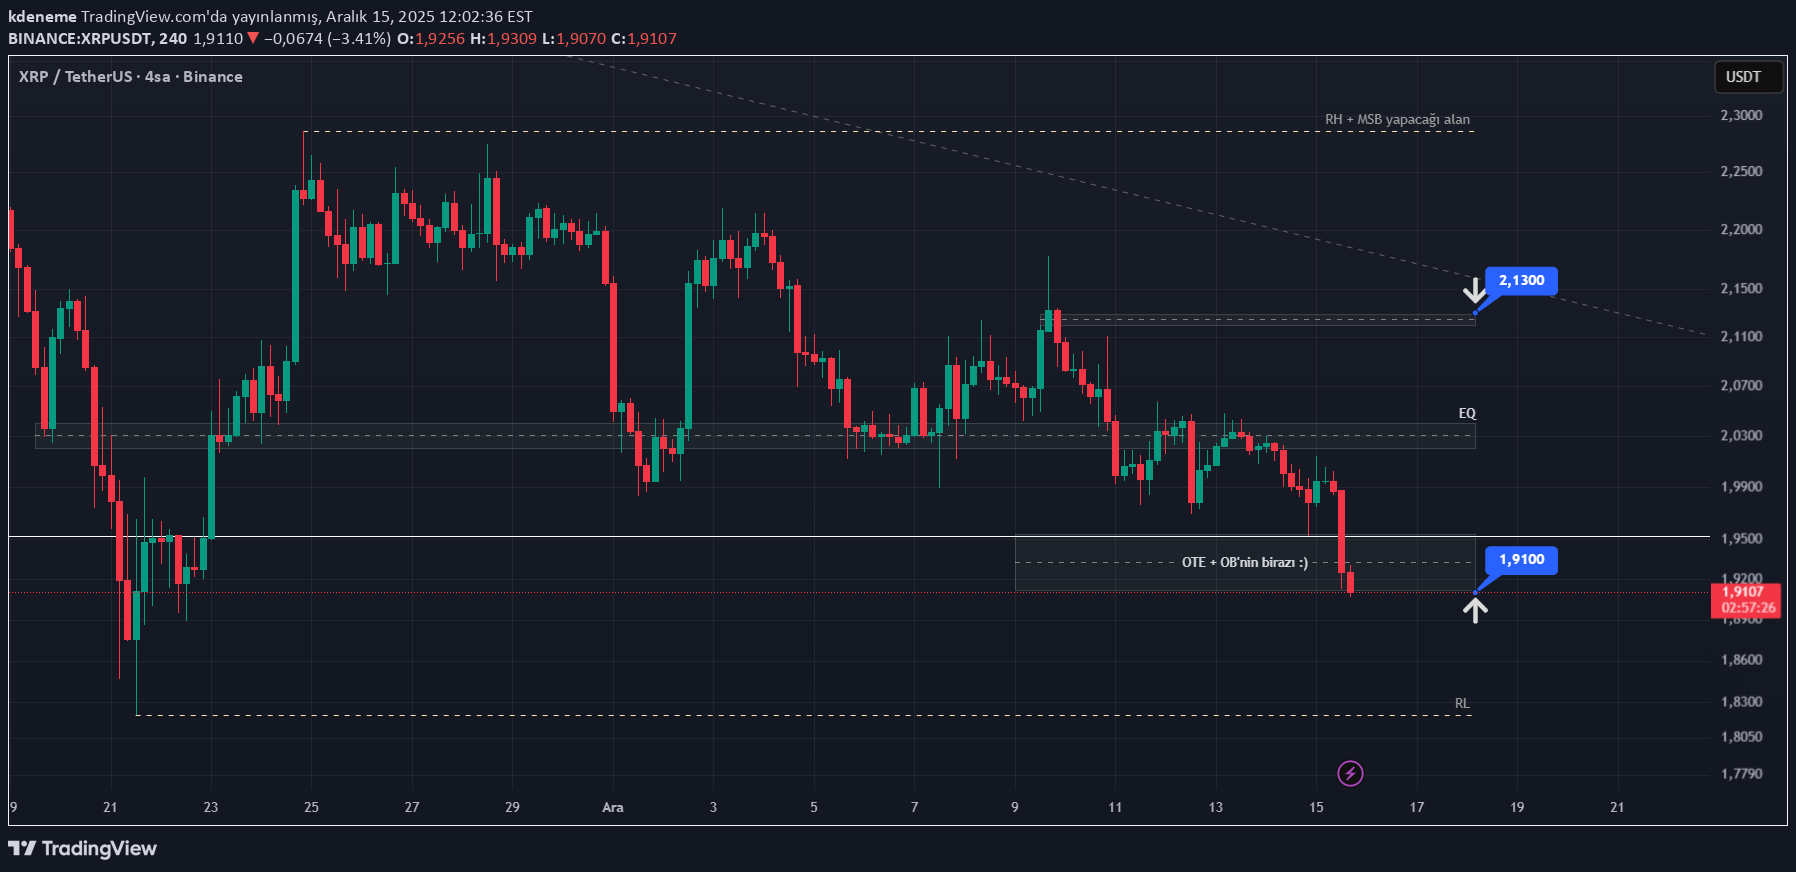
📢 #XRP - (#Ripple) Technical Analysis Study Hello, I observed that the price came to the area I have been following for a while. The range of 1.88 - 1.91 can be an evaluation zone for those who want to take risks. By placing a stop just below the RL alt band on the chart, that is, at the 1.81 level; EQ levels can be targeted first, then 2.13 levels depending on the situation. It is definitely not investment advice, it is purely my personal analysis. There is a risky fall right now, remember: A falling knife cannot be caught. The downtrend seems strong in the higher time frame, so it's better to be careful. I wanted to share this study with you to give you an idea. Thank you, Good luck!
kdeneme
تحلیل تکنیکال اتریوم (ETH): نقاط کلیدی حمایت و مقاومت برای ترید
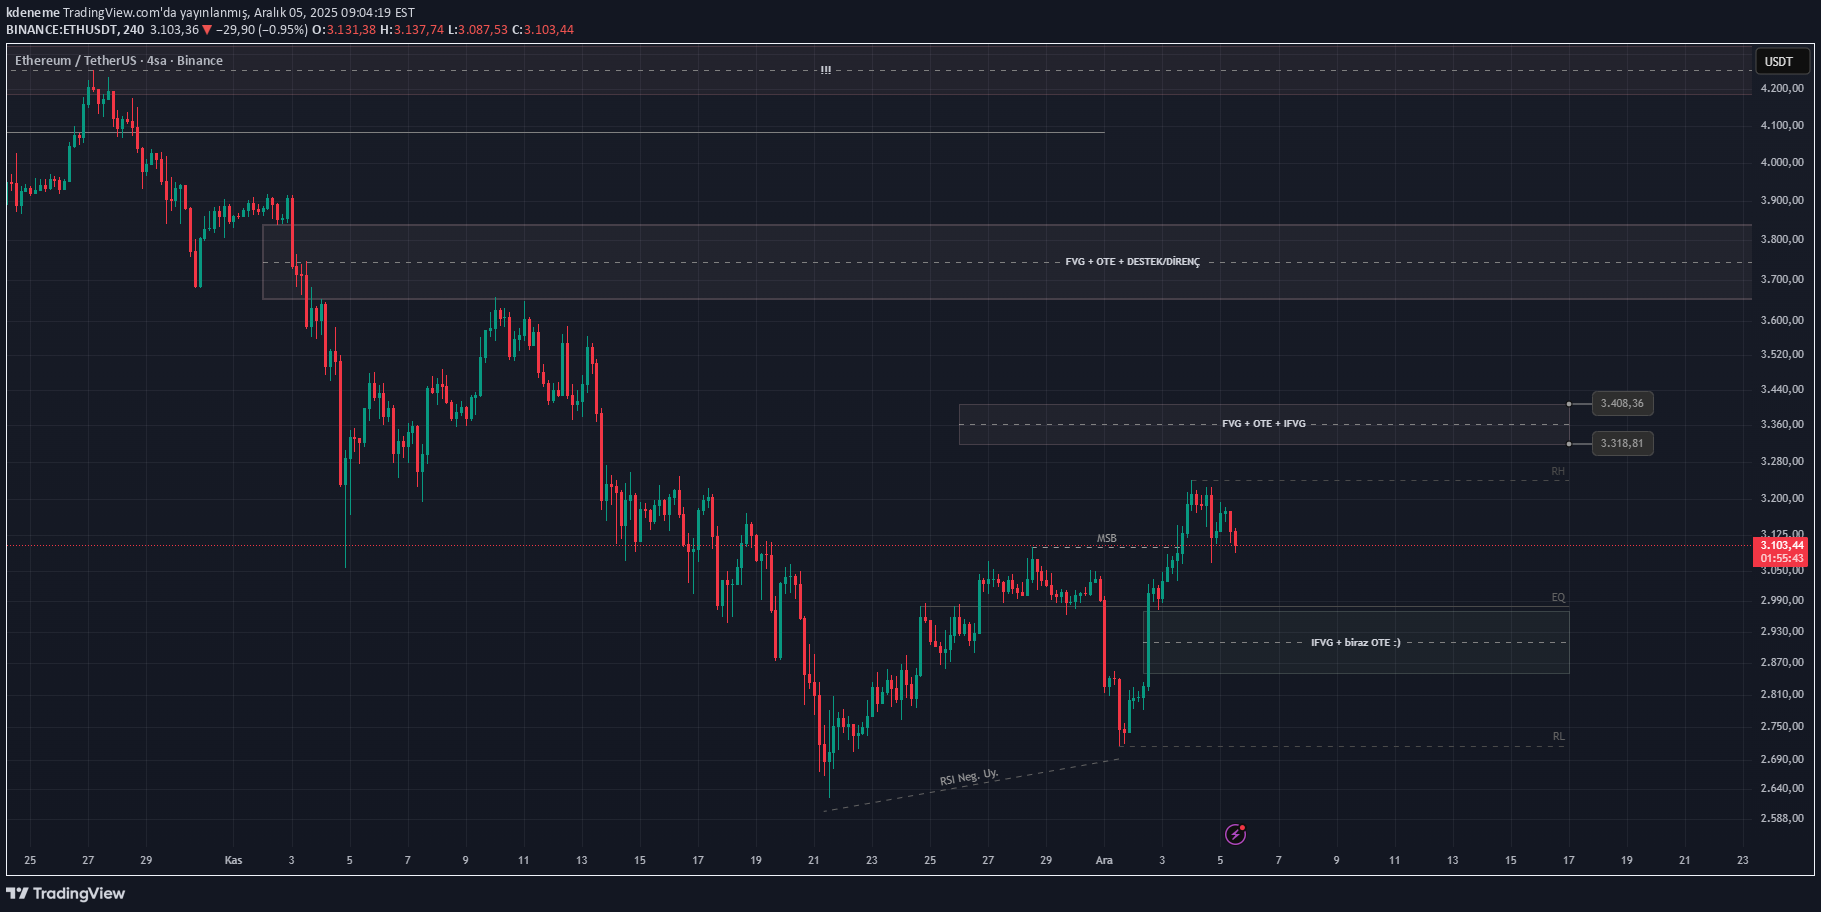
📢 #ETH (#Ethereum) Technical Analysis Study Hello, I wanted to share a brief evaluation based on my own observations. As you can see in the chart, after the downward structure, a higher bottom formation and market breakout caught my attention. If the price retreats, I expect it to receive a reaction from the box area I mentioned on the alt side of the chart. These areas can be evaluated by placing a stop below the near bottom levels. On the other hand, the 3300 – 3500 range, just above the price, seems to be a risky area for me. The price is likely to experience pressure in this area. Therefore, short opportunities may occur here in line with short-term confirmations and possible setbacks in short time periods. Additionally, if a position is taken from lower levels or at these levels, I think it is a region that can be used to realize profits. It is necessary to examine the price when it reaches there. If it passes there with high volume candles, it means continuation. What I said would be invalid. As far as I can see, I wanted to give some brief information. It is not any investment advice. Thank you, Good luck.
kdeneme
تحلیل تکنیکال اتریوم (ETH): آیا کف قیمتی جدید در راه است؟
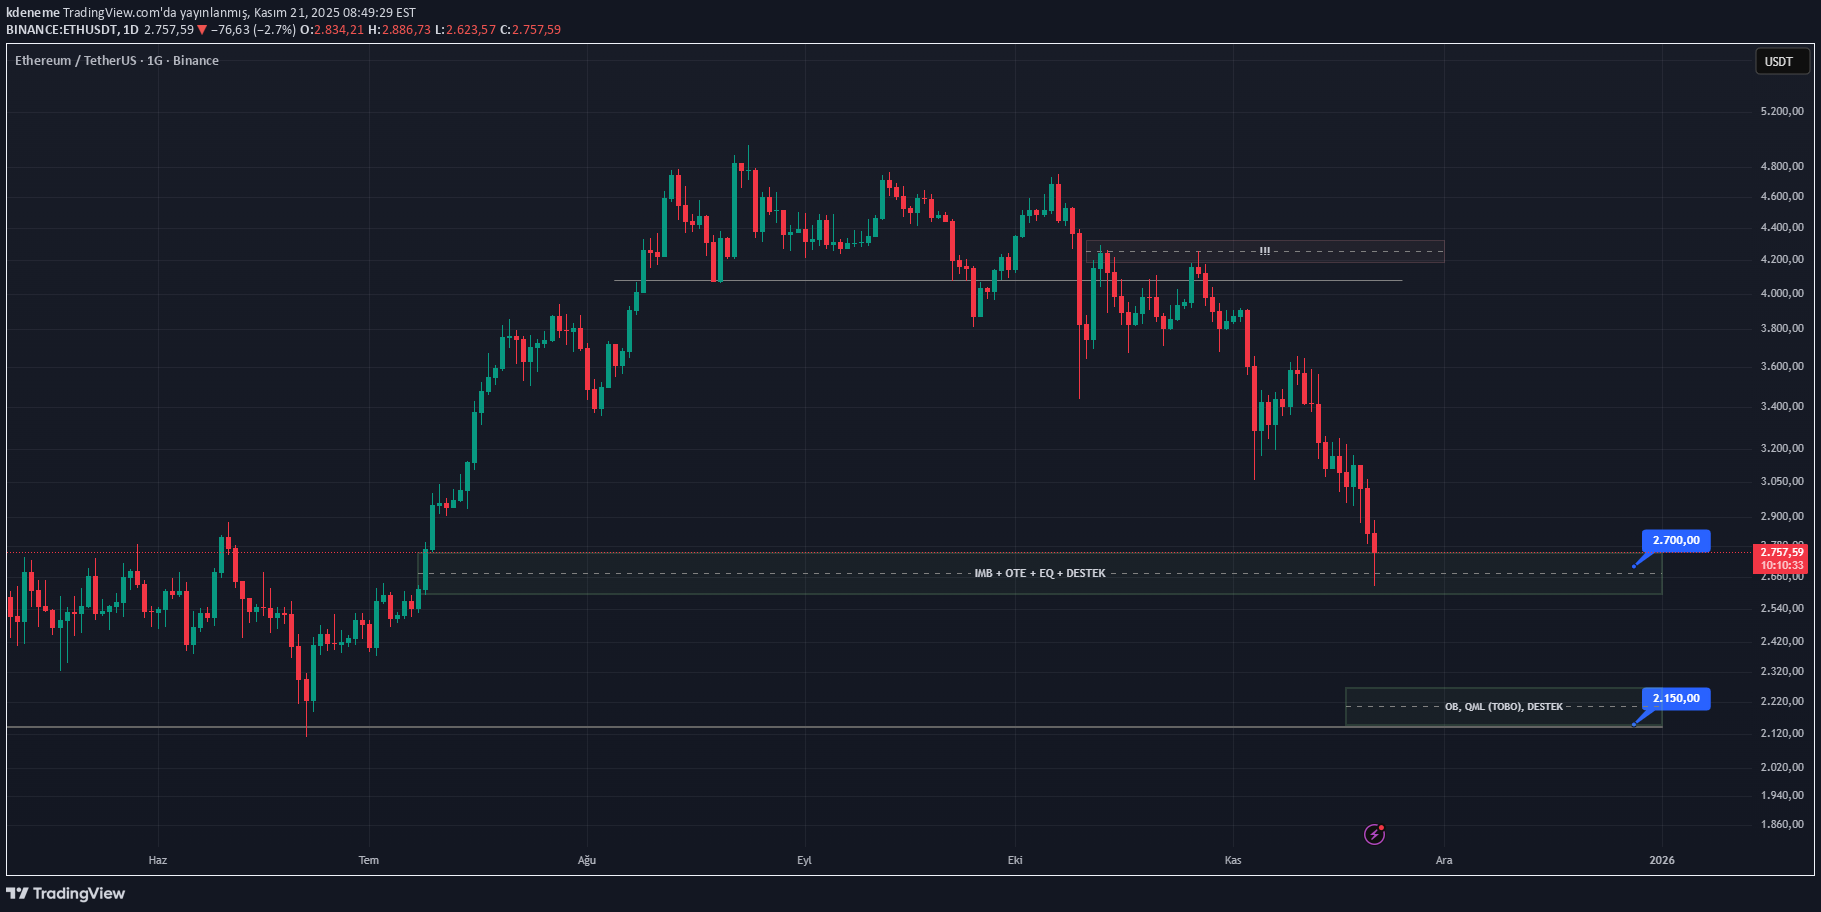
Hello, With the declines in the markets, we have reached the first stop of the bad scenario regions that I mentioned in my previous analyses. At this point, I wanted to share a brief evaluation. As you can see, the level we are at now is an area that I think is important. The level that I see as another strong support area is around 2150. Might want to create a Tobo structure. If you look at the overall picture over a weekly period, you will see that there is a point where he can do his right leg. The next possible support may be 1500 levels. (3 - 4 year trend support line...) Taking a position in these three regions with partial purchases can provide a nice average cost—of course, if prices fall to these levels. However, it is very difficult to make a definitive bottom prediction under current market conditions. Therefore, it is not possible to speak clearly; I just wanted to share a brief general analysis. It is not investment advice. See you on beautiful green days, good luck! 🌱
kdeneme
تحلیل تکنیکال بیت کوین: خطوط حمایت حیاتی کجاست و آیا ریزش ادامه دارد؟
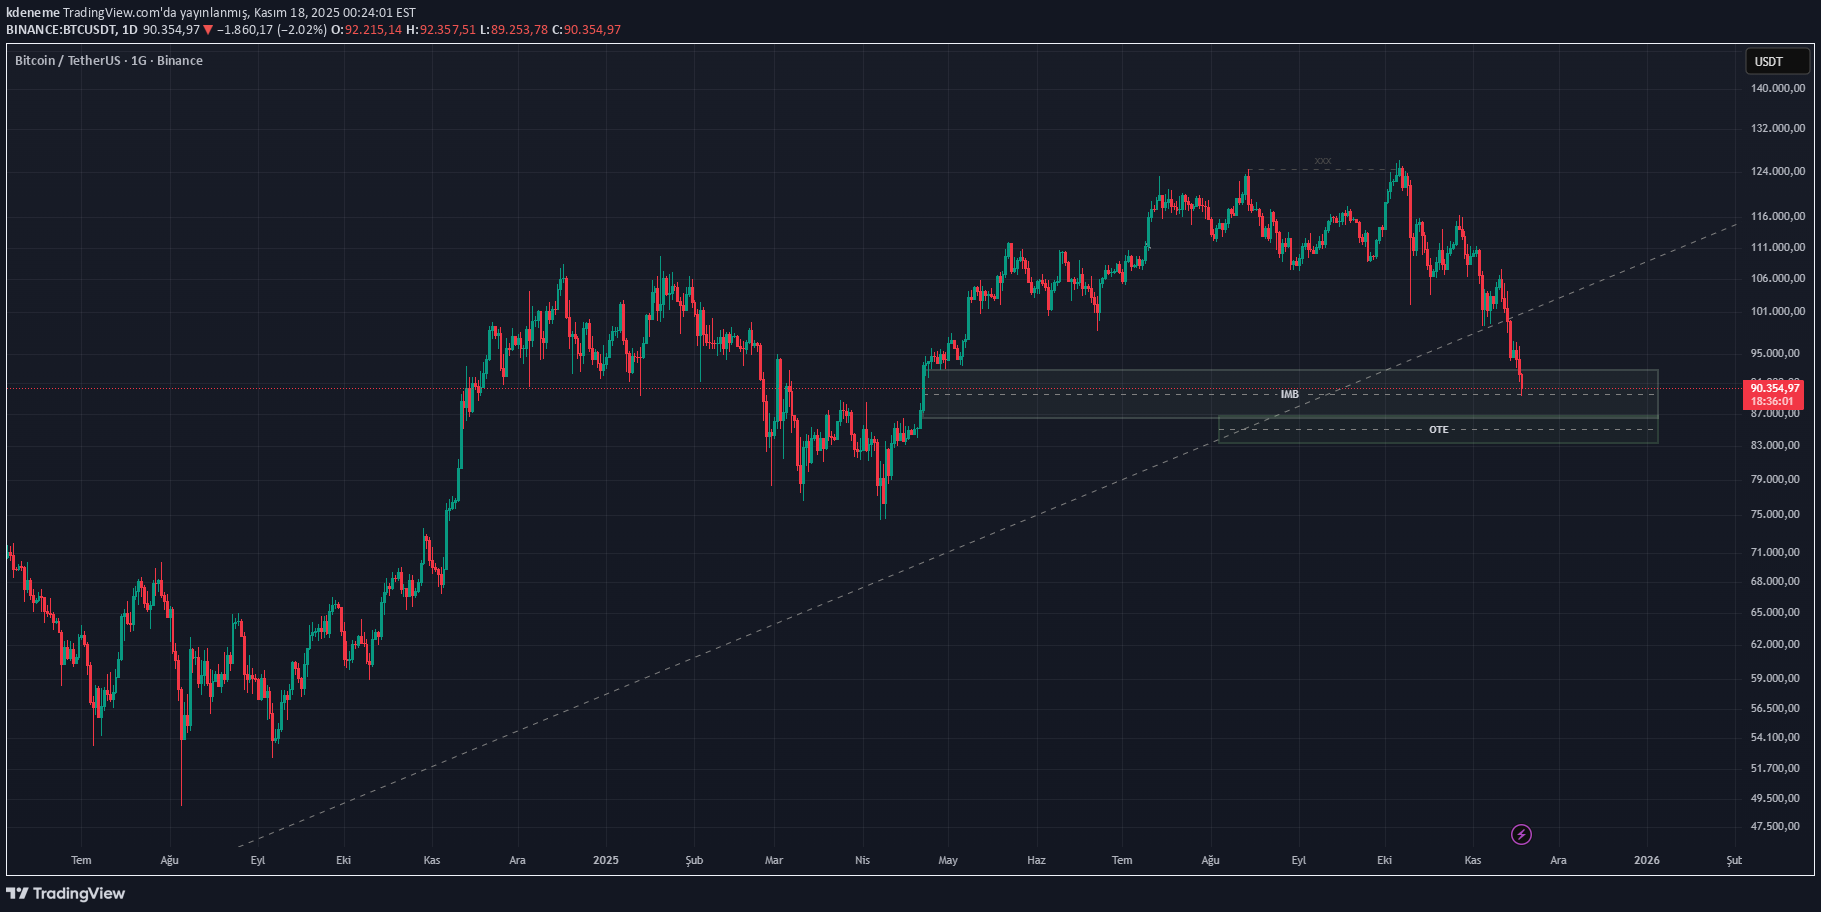
Hello, The market moved downwards quite sharply again. It has broken the trend line we have drawn since December 2022... I would like to give a brief general information. In my opinion, the 89,000 to 84,000 areas are critical support areas. We will observe whether it can hold on or not. If we hold on, we can see good rises and get back into the game. However, if it doesn't work, we will have to re-evaluate. Below 74,000 must be levels we definitely do not want to see. Meanwhile, increases should be followed carefully; if we are at a loss, it may provide an opportunity for exit, if not, it may provide an opportunity for short positions. It is not investment advice. Thank you, Good luck...
kdeneme
تحلیل تکنیکال بیت کوین: نقاط ورود کلیدی پس از ریزش ABCD و پیشبینی حرکت صعودی!
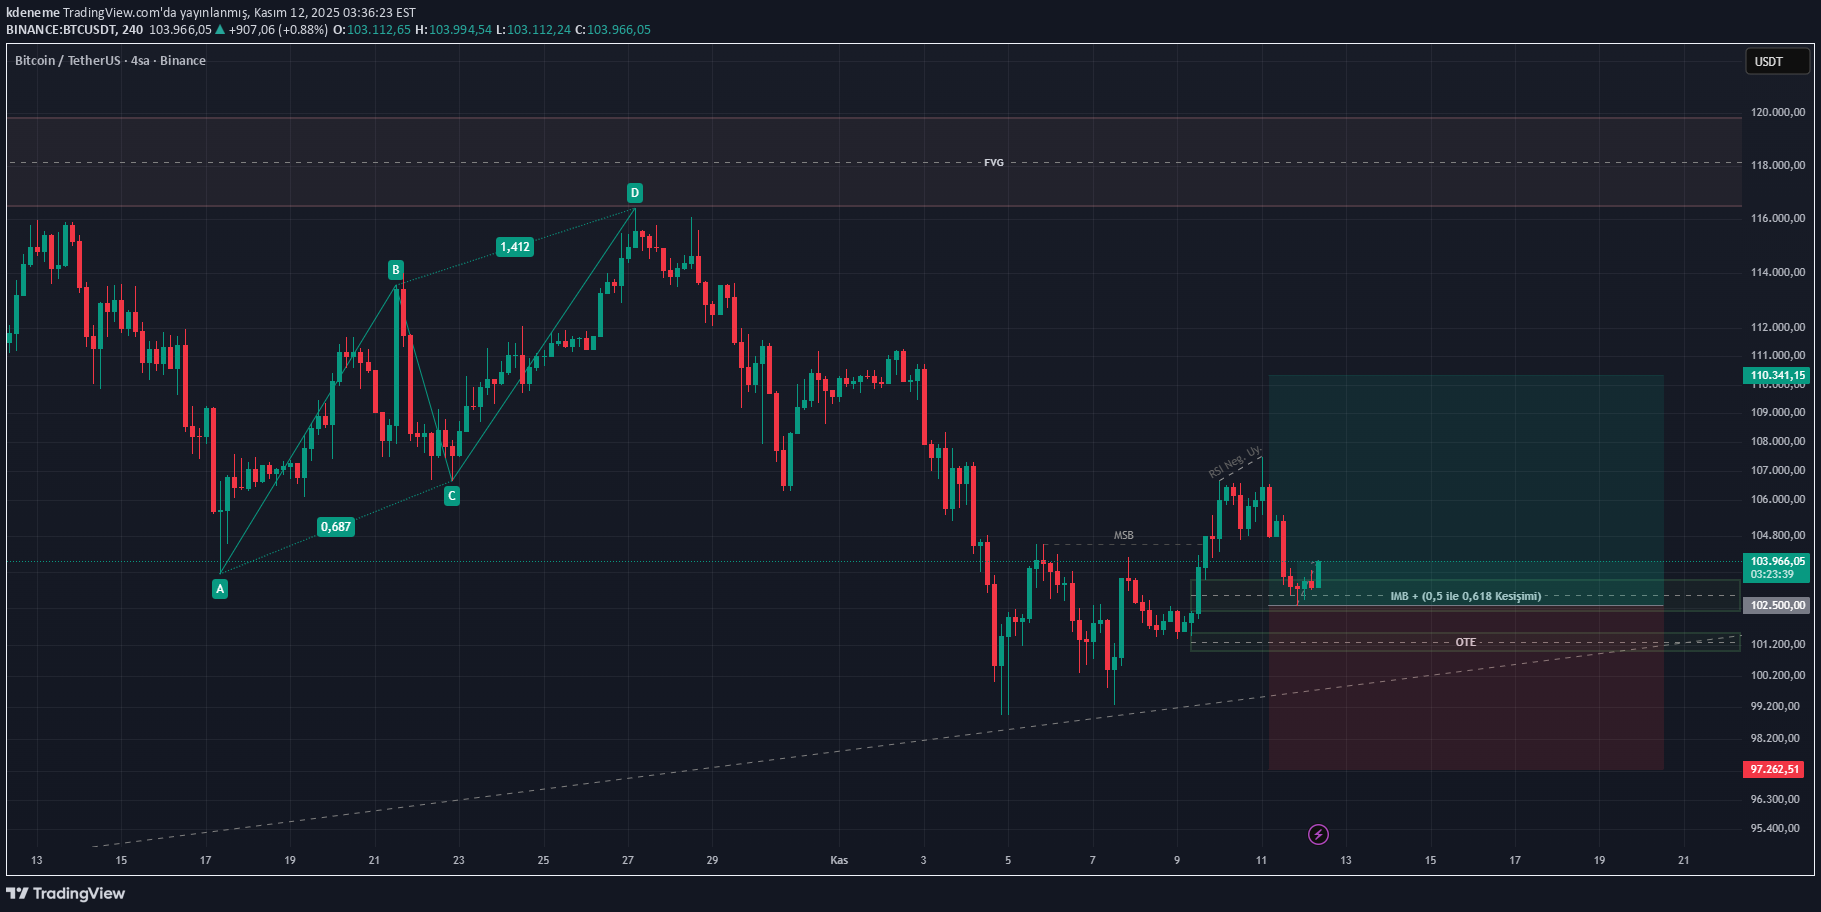
Hello, I think that the market calmed down for a while after the decline that started following the ABCD formation, and then, with the market structure breaking upwards, it created suitable areas for trading. I wanted to share this work with you. Two important regions stand out in the analysis: Zone 1: The area I marked as IMB and where the price is currently located. 2nd Region: The area I show with the OTE box. Actually, I was waiting for the OTE zone, but the price is trying to hold on to the 1st zone. Since the difference is not very big, I made my marks so that transactions can be taken at these levels. Also, I was expecting the price to pull back a bit due to the RSI negative divergence. I see this move as a correction and plan a reaction rise to 108,000 - 110,000 levels. I wanted to share my analysis with you. I'm waiting for your comments! Note: This is not an investment advice, it is purely my personal work. Thank you, Good luck.
kdeneme
تحلیل تکنیکال جدید اتریوم: آیا اصلاح قیمت فرصت خرید است؟
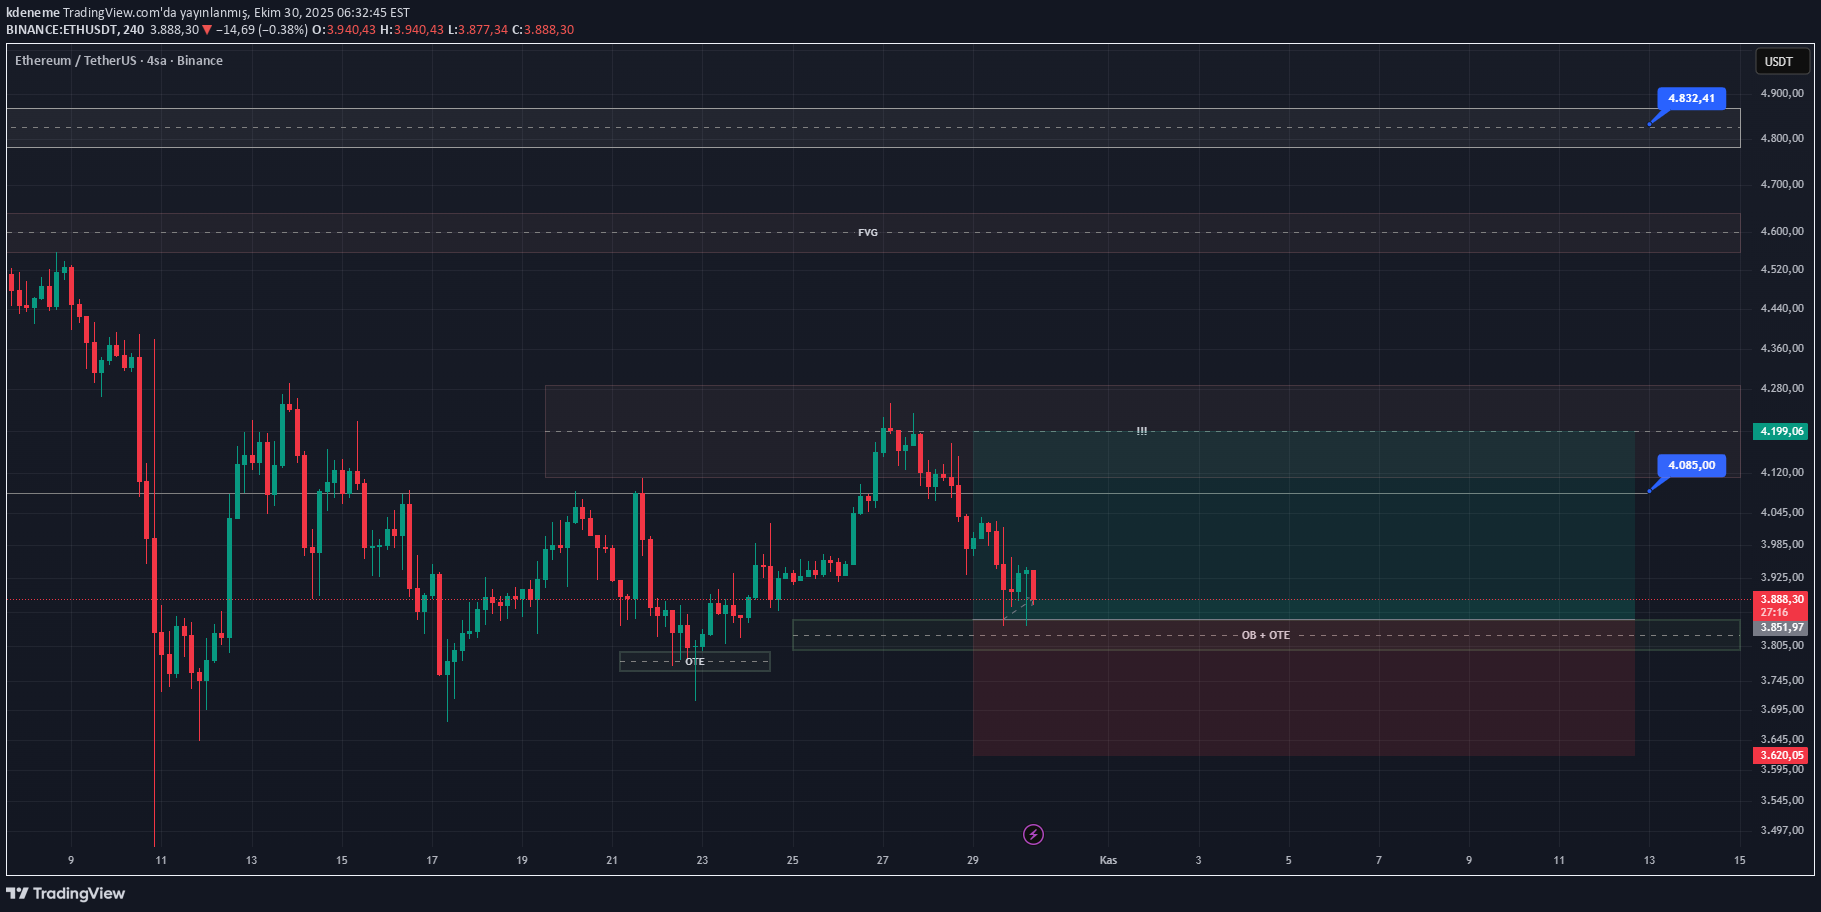
📢 #ETH Technical Analysis Update Hello, I try to summarize the process as much as possible with the posts I share on #ETH. There is a retreat from the resistance box that I expected; I consider this as a fix. With this perspective, I created my trading plan and I am sharing it with you in the attachment. Generally, a certain decline is followed by an upward market breakout. We also do high lows. Therefore, I think the price will maintain its desire to go up as long as it does not close below my stop level. These areas don't look bad at all. (I quite liked the green hammer candle formation before the last red candle you see in the picture. It may have found the bottom level and wants to start an upward movement. It is possible to say that the bulls are superior in the candle case. It reveals itself in one or two candles. I wanted to write it for additional information...) I roughly determined an entry point, take profit level and stop area. My planned trade is at around 1.5 R/R. I kept it this way to be more secure; Depending on the situation, 2 R/R levels can also be monitored. In this scenario, there is a stop of around 5% and a profit target of around 8%. Of course, as always, let me add this; Instead of entering it by heart, confirmations should be obtained that it returns to the upside in much smaller time frames. Let's pay attention to this issue. If it comes to the area where I plan to buy with huge red voluminous candles, it will be necessary to question the plan. Attention !!! It is not any investment advice; I only share my own works. If you see any missing or incorrect points, I am waiting for your comments. Thank you, Good luck.
kdeneme
تحلیل تکنیکال ریپل (XRP): زنگ خطر صعودی و نقاط حیاتی قیمت
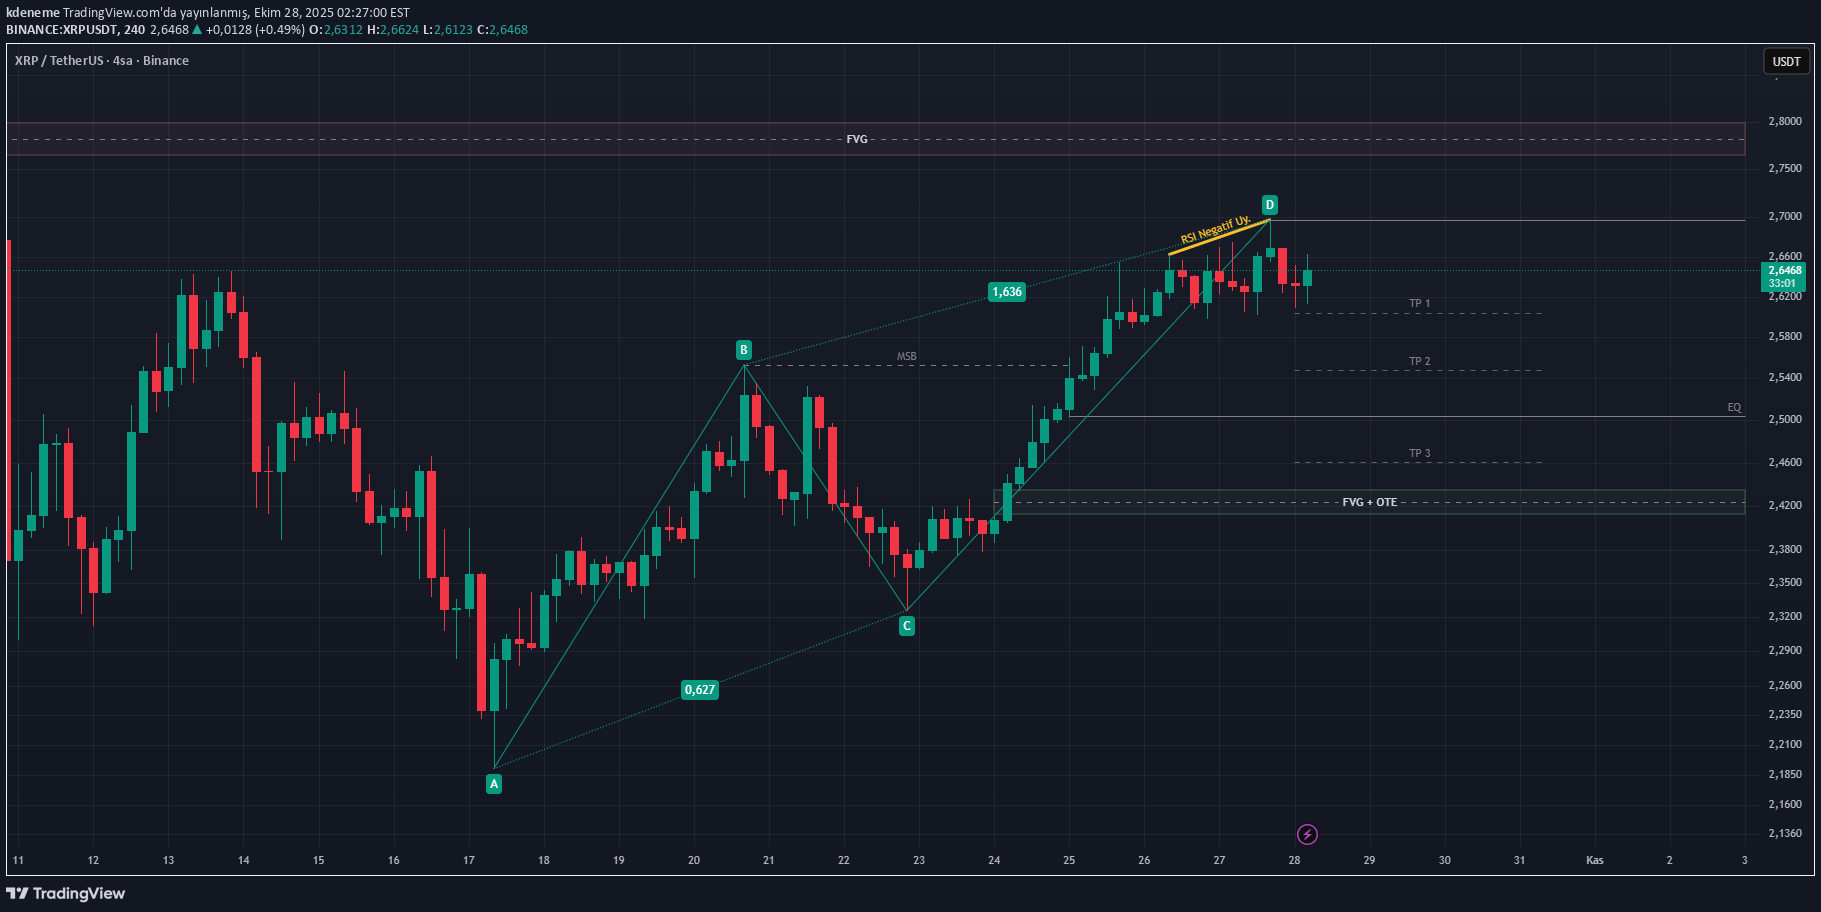
📢 #XRP - (#Ripple) Technical Analysis Study Hello, While examining the #XRP chart, what caught my attention was an "ABCD Bearish Formation". I also observed a negative RSI divergence in the peak area where this structure was confirmed. The RSI value is at relatively high levels on the 4-hour chart, so I think it is better to be cautious. [ As long as it doesn't break 2.59 downwards, I won't worry too much. The upward movements continue... ] The TP1 - TP2 - TP3 levels I mentioned in the chart represent Fibonacci values. These levels are not a recommendation such as “enter here, exit there”; It is drawn only to indicate that there may be technically important regions if the price reaches there. Additionally, there is a price imbalance in the middle area of the range structure (EQ line). If it comes to this area, keep it in mind. If it reaches the lower FVG + OTE region, I will consider taking a transaction if market conditions are suitable. (2.70s can be targeted with a stop at the bottom of leg C. We will talk about this if the price comes there, let's always go up if it never comes :) ) This analysis is not a directional study that predicts that the price will definitely go up or down. I just wanted to share my humble opinions on how to take a position against possible scenarios. 📌 IMPORTANT NOTE: If there is an upward break from the region we are currently in, especially if 4-hour closings occur above the 2.70 level, we will need to update this analysis. In this case, do not take into account the current analysis as the positions of the support lines and boxes will change. I will share an updated analysis according to the new situation. 😉 I would be happy to read your comments. 📌 It is not investment advice. Thanks, Good luck!
kdeneme
تحلیل تکنیکال سولانا (SOL): دو سناریوی مهم و استراتژی ورود به معامله
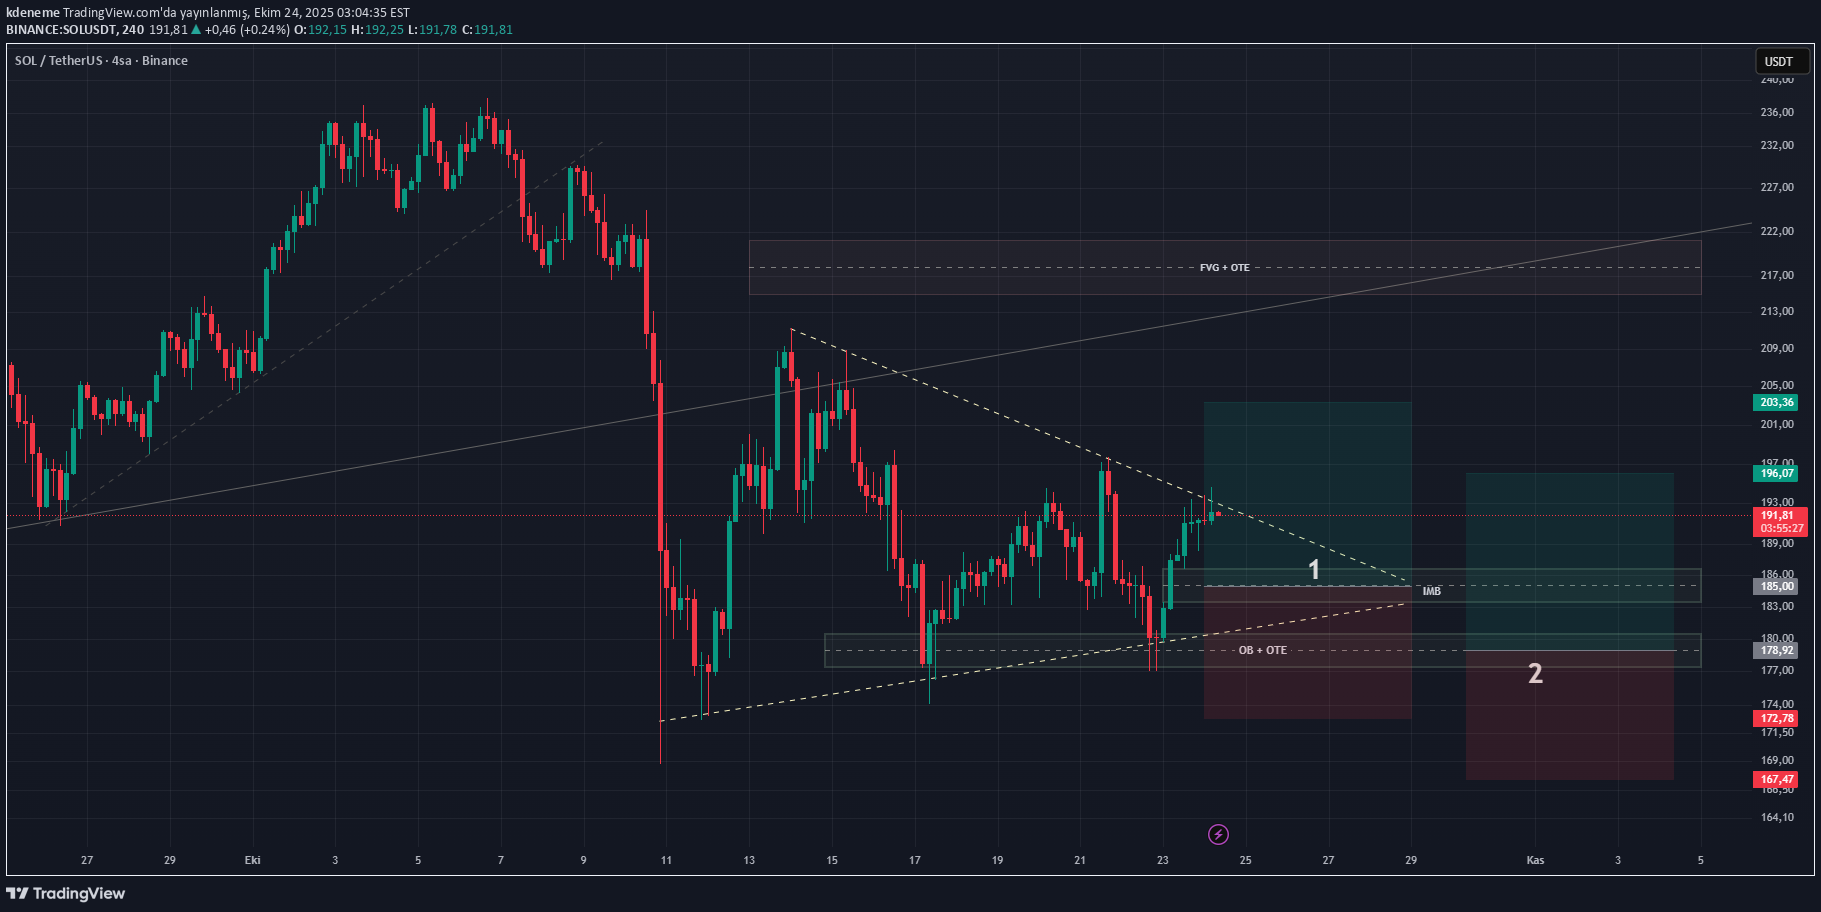
Hello everyone, I performed an updated analysis on #Solana (#SOL) and I would like to share the visual with you. Although I do not prefer complex structures, the visual may be a bit intense in this analysis 😊 In this analysis, I would like to convey my plan, which can be shaped according to two different scenarios: 🔹 First Plan: A triangle formation has formed on the chart. The price may show some retracement after approaching its upper band. Therefore, it may be useful to be ready when returning to this region. Trading opportunities can be sought, especially on a return to an IMB (Market imbalance zone) area. However, I'm not exactly sure about this area; There is a stronger region a little further down. As always, instead of placing a direct transaction order, it would be healthier to wait for positive signals such as rising bottoms and price imbalances in small time frames when the price reaches this region. 🔹 Second Plan: In this scenario, there is an area that has responded well twice in the past, overlapping with both an OB (Order Block) and OTE (Optimal Trade Entry). In the third test, transactions can be taken from this region, which I think can hold the price. If no treatment has been taken as a primary plan, this region can be considered as an alternative. The advantage of this plan is that we can leave a safer stopping distance. The disadvantage is the possibility of missing the transaction. 🔹 Alternative Scenario: If the price moves upwards by breaking the upper band of the triangle, then a retest can be expected on the return to the triangle. I tried to keep the risk reward ratio around 1.5% in both transactions. You can think of the gain as being close to 10% while the stop is around 6.5%. I tried to share as many possible scenarios as simply as possible. Thank you to everyone who has read so far patiently 😊 Note: This post does not constitute investment advice. I wish you good luck!
kdeneme
تحلیل تکنیکال اتریوم (ETH): نقطه حساس ورود و استراتژی معاملاتی جدید!
Hello, Despite the declines in recent days, the market has not yet been able to break the structure upwards with a strong rising top (MSB), but it has reached a remarkable region. I think it might get a reaction from the OTE region. Thinking that he might want to take the liquidity of the near bottoms, I structured the transaction to leave a stop margin slightly below. At this point I planned a trading strategy: ✅ Stop: Around 4% ✅ Target: 1.5% – 2% R/R rate (R/R rate in the image: 2%). ✅ Strategy: Appropriate entry zone can be searched in shorter time frames. Important Note: Taking a position without a clear reversal signal can be risky. If the price does not react from this area and continues to decline, waiting will be the most logical option. It is important to get confirmation rather than entering into a transaction directly. In small time periods, structures such as fvg, ote, ob or msb and even bos can be followed. 📊 It is not investment advice. It is my own graphic work. Thanks, Good luck.
Disclaimer
Any content and materials included in Sahmeto's website and official communication channels are a compilation of personal opinions and analyses and are not binding. They do not constitute any recommendation for buying, selling, entering or exiting the stock market and cryptocurrency market. Also, all news and analyses included in the website and channels are merely republished information from official and unofficial domestic and foreign sources, and it is obvious that users of the said content are responsible for following up and ensuring the authenticity and accuracy of the materials. Therefore, while disclaiming responsibility, it is declared that the responsibility for any decision-making, action, and potential profit and loss in the capital market and cryptocurrency market lies with the trader.