
jdaraque
@t_jdaraque

What symbols does the trader recommend buying?
Purchase History
پیام های تریدر
Filter
jdaraque
Accumulation before Low price?
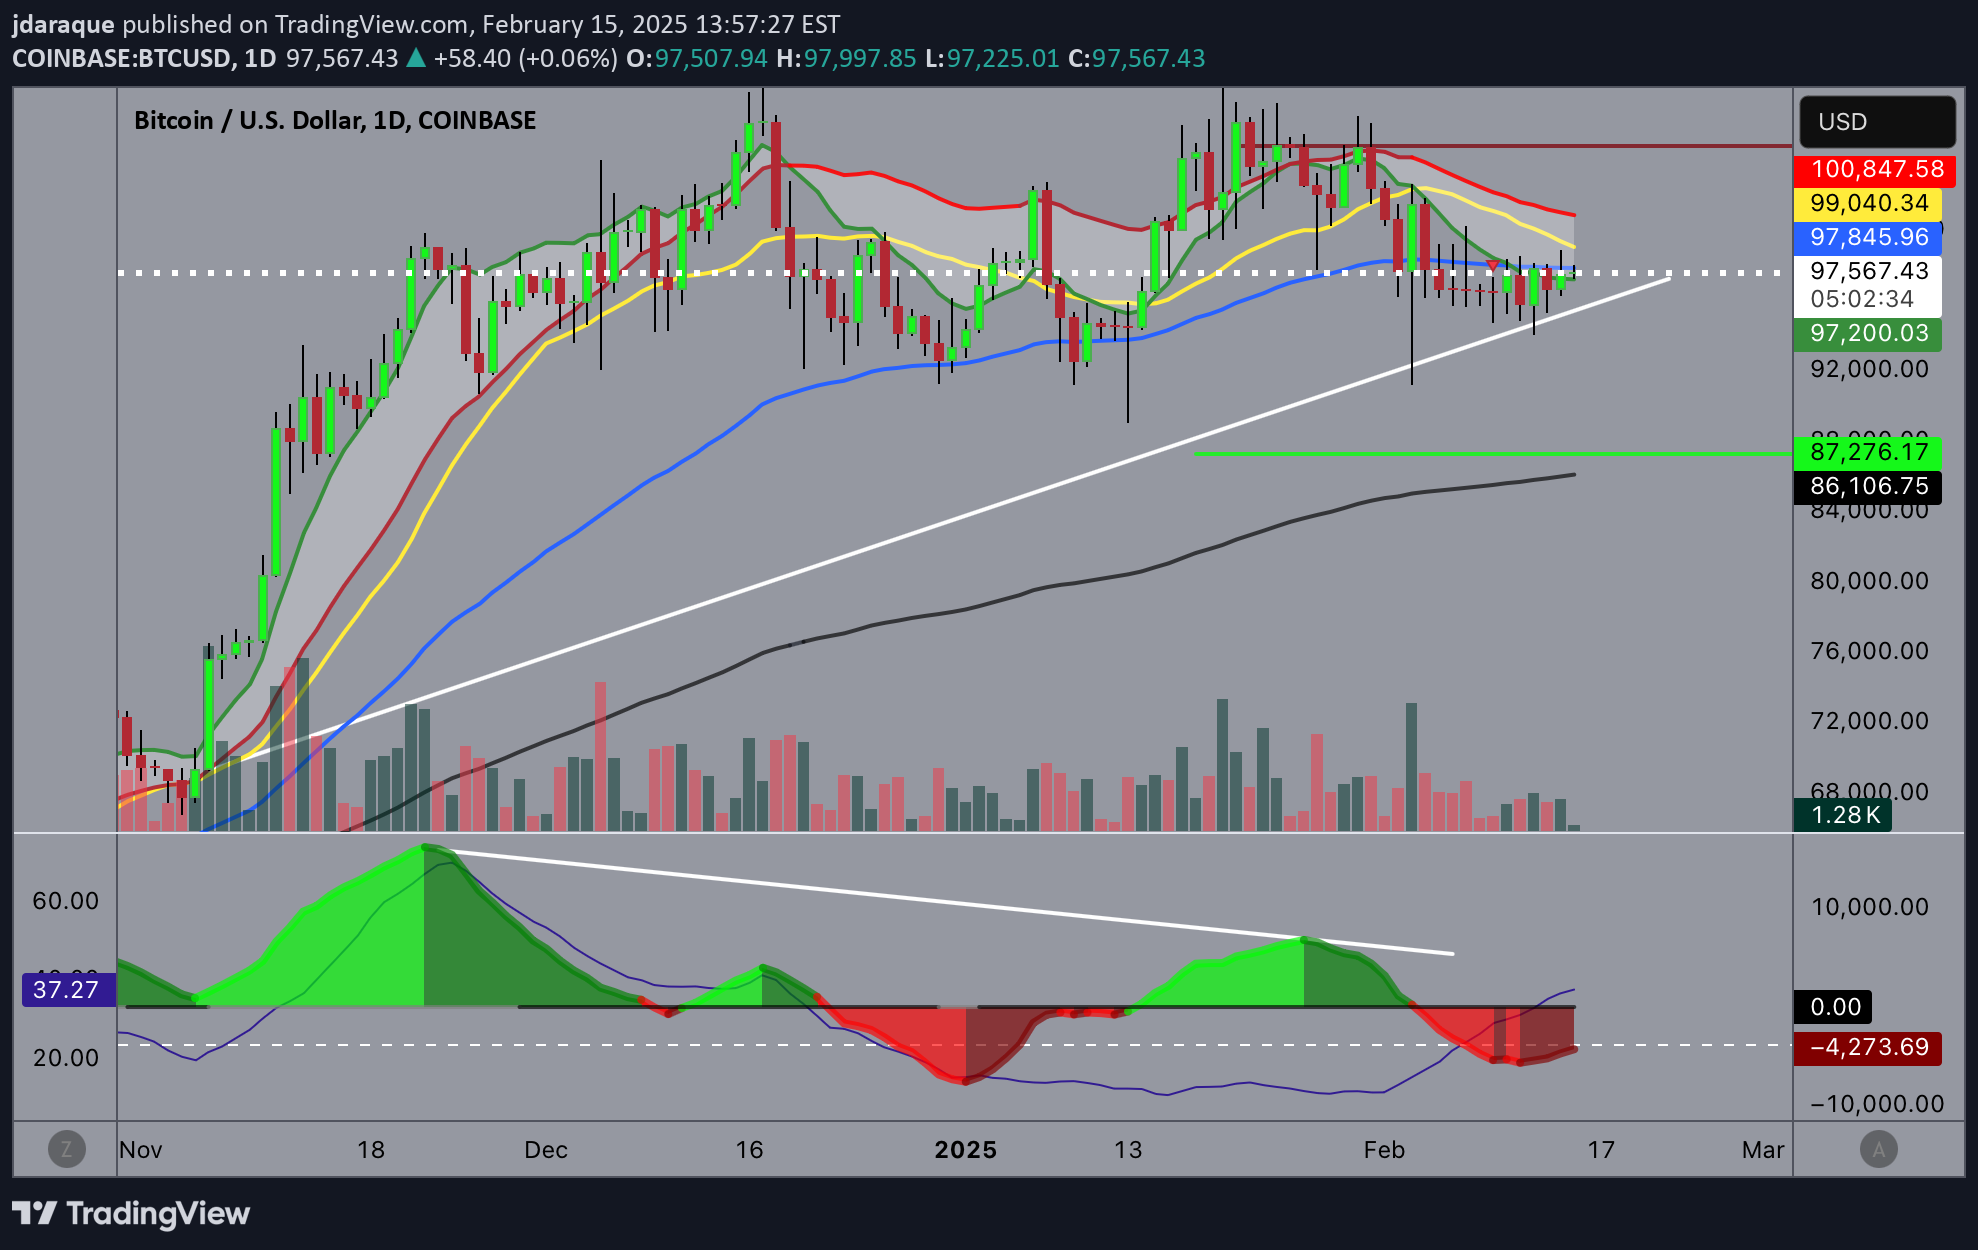
Bitcoin continue in the same range price, but the indicators continue showing more probabilities to next movement to lower price, we have a divergence in the MACD and the moving averages shown pressing to low in the next days in this day graphic, at the same time, in my analysis in the week graphic the trend continue to go up the price, conclusion the probability is go down first near to $87000 for rebote to increase again
jdaraque
Bitcoin down to MA200

Bitcoin with signs of making a bearish movement looking for the 200 moving average above $85,000 - 87,000 dollars, to bounce upwards, then we will see how it moves within the range that will occur.
jdaraque
Bitcoin next moves

https://www.tradingview.com/chart/Oq9e9fSQ/ Bitcoin analyzing the 4 hour and daily chart, could have a rebound and then fall again, the question will be if it will fall more or not, on the charts there is a good possibility that it will break to look for the 200 moving averages in the area close to US$36,500, a strong resistance also supported on the weekly chart. If the price reaches here, we will have to monitor the rebound that occurs to see if it is definitive or just a consolidation level before a definitive impulse to start new highs, surely achieved in the last quarter of 2024
jdaraque
Bitcoin go up or not

https://www.tradingview.com/x/ayVOF5iD/ In these daily and weekly charts, Bitcoin is yet to decide whether to go back to looking for the US$45,000 and pass them or continue looking for the $37,800 area. Tomorrow after Powell speaks it will probably move and we will see where. Based on the indicators, Bitcoin has bounced off the 20-period moving average, yellow, on the daily chart, I think this could happen again. On the weekly chart the ADX, black line in the histogram, continues to show bullish strength and a wave with moving averages with a bullish slope, this indicates that each setback the price would encounter strong resistance in each of these moving averages, prices that would be a buying opportunity, in conclusion I see a probability that Bitcoin will once again seek $45,000 thousand dollars as an initial move
jdaraque
Bitcoin continue going up?

https://www.tradingview.com/x/hD4fFKLY/ Bitcoin daily and 4-hour chart shows a moment of pause after going up as had been estimated as the highest probability of happening. Now, the analysis indicates a probability of seeking 40 thousand dollars in 2 scenarios, the first is to stay in a range between $30,200 and $35,000 dollars, for a period between one or two weeks to continue rising to complete a second bullish impulse. The second scenario is to stay above the 20-period average in 4 hours (yellow color), to see another strong impulse in search of $40,000 dollars and retreat and then enter another pause and look for a third bullish impulse. In both scenarios I expect 2 more upward impulses with the normal and necessary setbacks. Finally, a confirmation of a Bitcoin ETF approval could cause the price to reach even higher pricesBitcoin continues to wait for the decision on the approval of the ETF, if this happens we will probably have a strong bullish momentum. Now, graphically, he should hold $36,000 and is likely going for $40,000. I think that Bitcoin is following an upward trend but not in a straight line, it will have setbacks looking for the 20 period MA as its support, if it were to lose on the daily chart and close below the 20 MA today located at $36,260, it could go down to 34,600 to bounce higher. Doing a trading operation today in Bitcoin is not recommended due to the uncertainty of the ETF, the only thing that is certain is that if it goes down it is to buy more in the future
jdaraque
Bitcoin Change Accumulation zone

We had talked that we were in a Bitcoin accumulation range where the minimum resistance would be in the $24,800 area. Looking and analyzing the charts today, in this case 4hrs and Diario, it is very likely that this resistance as the minimum of this exchange accumulation range above $26,800 dollars, the break of it would not be good to follow my forecast of a Bitcoin that will continue its upward trend. We said the explosion of Bitcoin will be given by the news of an ETF, although without it, the accumulation of the big whales will continue. In the charts we see a price that shows moving averages with an upward slope, with an important crossing of the wave in areas of moving averages 20 (Yellow color) 50, (Dark Blue color), compressed and not further apart from each other above the 200 MA (purple color), 200 EMA (black color), an ADX in the histogram (black line) with an upward slope that still represents strength in the short-term and medium-term movement, this analysis confirms my position that Bitcoin It will continue to rise slowly, more accumulation zone” or faster depending on the ETF and its approval, and remember “Bitcoin with infinite patience, infinite results” https://www.tradingview.com/x/cU4jiKEL/
jdaraque
Bitcoin, continuous accumulation

The accumulation of large investors continues, graphically my idea of a greater probability of going up continues, for lovers of chart figures in this case the breakup of the triangle would coincide with the breakout of the price of the moving averages in all the exposed temporalities in this analysis. The moving averages on the daily and weekly chart continue to compress, which indicates that when the market finally decides, its explosion could be very strong. If it is upward, it would be the definitive beginning of an upward trend in search of new highs, although not in a straight line. . https://www.tradingview.com/x/KzWVQxWT/
jdaraque
Bitcoin bullish accumulation range?

https://www.tradingview.com/x/l5HjkUzl/ Daily chart that shows an important accumulation range in a period where large players are very close to entering the market, the trigger will arrive, how strong it will depend on the approval of the ETFs that will arrive but we do not know when. The indicators on the chart show moving averages that are compressing more and in more horizontal ways, a sign that indicates that the explosion will be stronger, in addition to a wave with an upward trend on the slopes of the moving averages in green and red with a cross at the upwards, added in the histogram + ADX, the latter with upward force, I can conclude that the greatest probability is that we will break upwards, when we do not know it, while doing what whales do, accumulate what we can. Remember, “Bitcoin to infinite patience, infinite results”
jdaraque
SPY vs BTC changed?
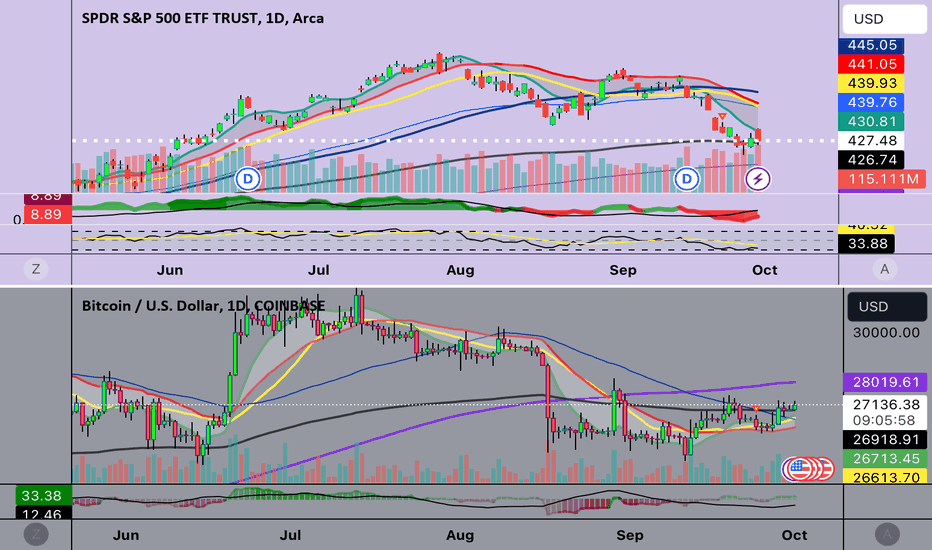
https://www.tradingview.com/x/8cvMYpOm/ We have always heard that BTC moves like the SP500, but does this comparative daily charts show that is still happening? Or could it be that Bitcoin is already beginning that independence as one of the reasons it was created? What do you think? I would say based on this graph, where the bearish wave of its MA of SPY and the parallel one with an upward trend of BTC, it is very possible that with the entry of large investors, accumulating BTC, it is already showing its beginnings as a true refuge of value. Could it be? “ Bitcoin to infinite patience, infinite results”
jdaraque
Bitcoin go up? Yes

https://www.tradingview.com/x/MHZ543PE/ Bitcoin temporalities of 4hrs, day, weekly and monthly, with strong resistance in the area of $4800, important moving medials with rising slopes, the wave shows the area of accumulation range, the greatest probability is to decide to go up. I say, "Bitcoin to infinite patience infinite results"Resistance is $24,800
Disclaimer
Any content and materials included in Sahmeto's website and official communication channels are a compilation of personal opinions and analyses and are not binding. They do not constitute any recommendation for buying, selling, entering or exiting the stock market and cryptocurrency market. Also, all news and analyses included in the website and channels are merely republished information from official and unofficial domestic and foreign sources, and it is obvious that users of the said content are responsible for following up and ensuring the authenticity and accuracy of the materials. Therefore, while disclaiming responsibility, it is declared that the responsibility for any decision-making, action, and potential profit and loss in the capital market and cryptocurrency market lies with the trader.