
jaxdog
@t_jaxdog

What symbols does the trader recommend buying?
Purchase History
پیام های تریدر
Filter
jaxdog
تحلیل کامل عرضه اولیه سهام CRCL: فرصت سرمایهگذاری در صنعت رمزارز با ریسکهای کلیدی
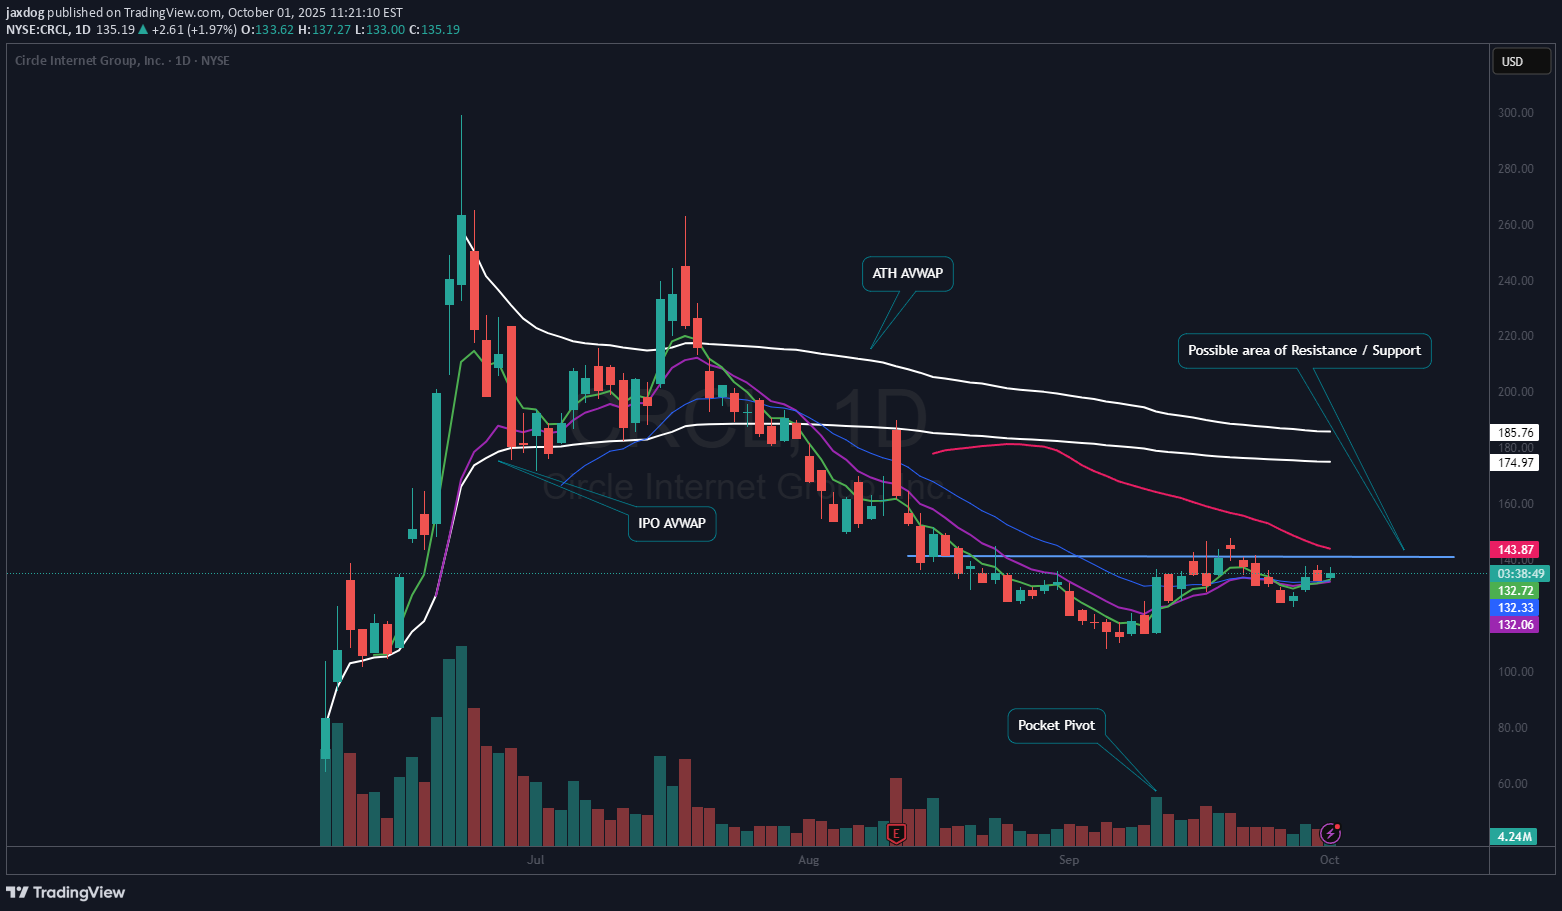
Overview of CRCL CRCL is a recent initial public offering (IPO) within the digital currency and blockchain payment industry. The company presents itself as the “World’s Largest Regulated” stablecoin provider in the global financial sector. Trade Entry and Rationale On September 11th, I initiated a position in CRCL for $128. The entry was prompted by a notable pocket pivot and the stock’s ability to reclaim the 21-day exponential moving average (EMA), indicated in green on my charts. To manage risk, I set a stop loss just below the low of the entry day, which has not been triggered. Since entering the trade, the position has appreciated by just over 7%. Current Position and Strategy I am closely monitoring an identified area of resistance, where I have set an alert. If the stock can surpass this resistance level, I intend to add to my existing position. Risks and Technical Considerations Despite positive short-term movement, this remains a risky trade. While CRCL is trading above all its shorter-term moving averages, it remains below the 50-day moving average (DMA), shown in red. Additionally, the stock is trading below both the IPO Anchored Volume Weighted Average Price (AVWAP) and the All-Time-High AVWAP. These technical levels may represent points where selling pressure could emerge, which is important to consider if you were to initiate a position. Conclusion Given its current setup, CRCL may be a candidate for your watchlist.
jaxdog
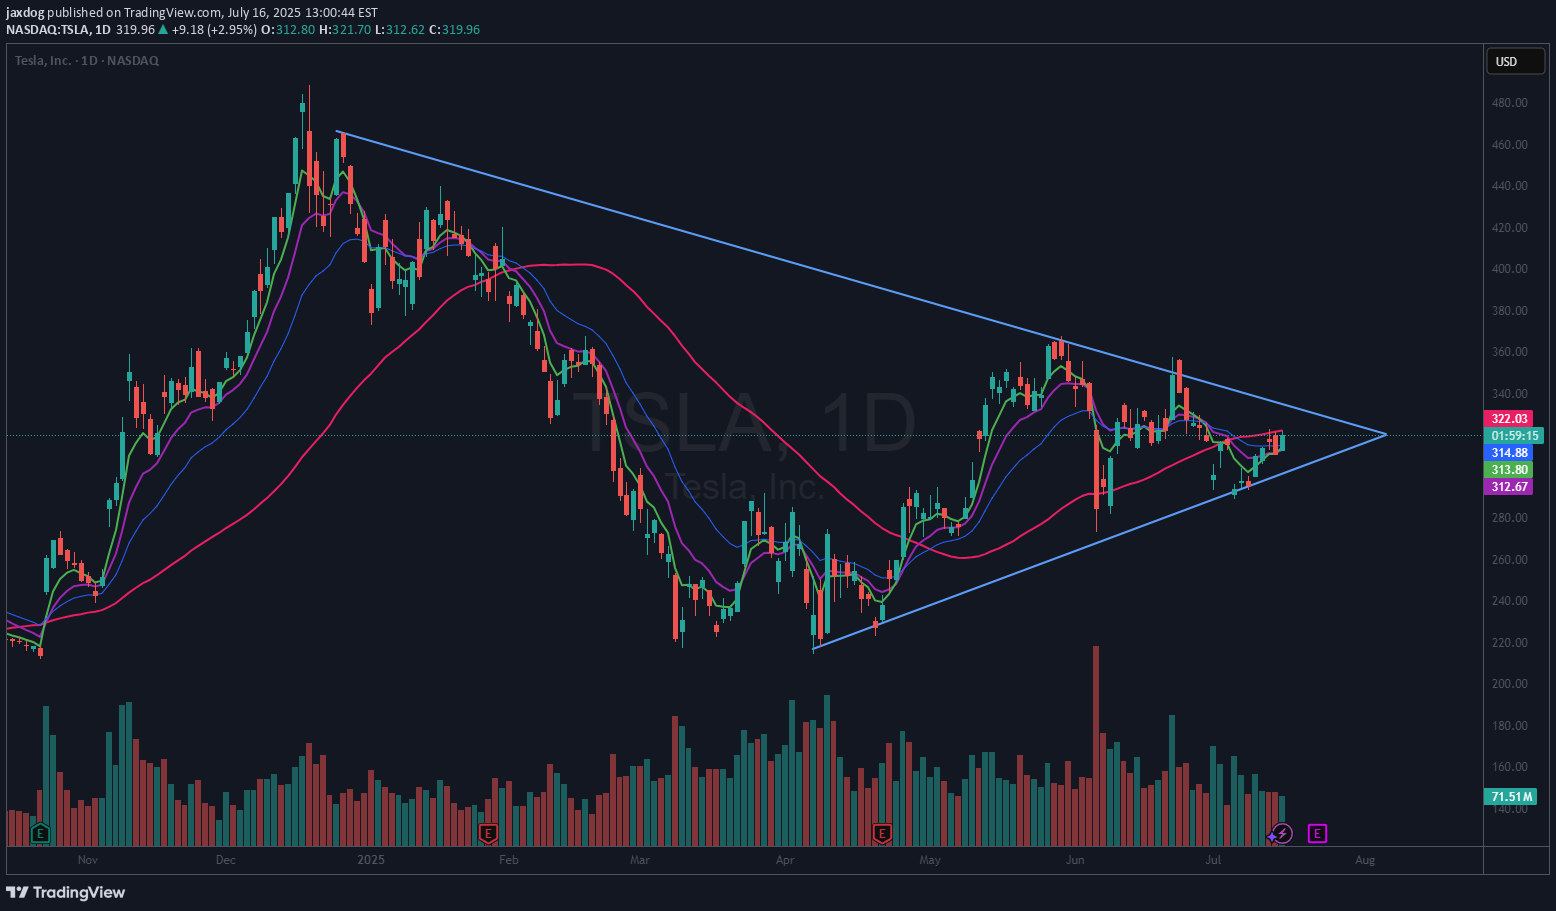
TSLA is in a giant 7 month wedging pattern. It can be seen as a VCP (Volatility Contraction Pattern) as well. These types of patterns can break either way. However, in this case we have a rising 50 DMA (red). That suggests to me that this will break to the upside. I already have a small position in TSLA and I will look to add if or when it breaks above the 50 DMA and again if or when it breaks above the upper downtrend line. If it breaks the lower line, I am out. Be aware that Tesla reports earnings in 7 days, Wednesday, July 23rd, after the bell.TSLA As I pointed out above, I have added to my position and now have a full size lot as it has retaken the 50 DMA (red). I still plan on adding more if / when it can break the downtrend line. (TBD). My stop on todays add will be just below the LOD.TSLA I posted this original chart 12 days ago. It is still consolidating in the wedging pattern. It now seems to be having trouble getting up and over both the 50 DMA (red) and the upper wedge's downtrend line. I have an alert on the upper trendline. This can still break either way. Patience is in order.TSLA Looks like it is trouble here. It has broken below the lower trendline and the shorter term MAs. But, it has happened in a weak overall market and could be an overshoot. For the moment we do have a series of higher lows. However, the most recent low (today) could continue lower which would then give us a lower low. I am sitting out for now.
jaxdog
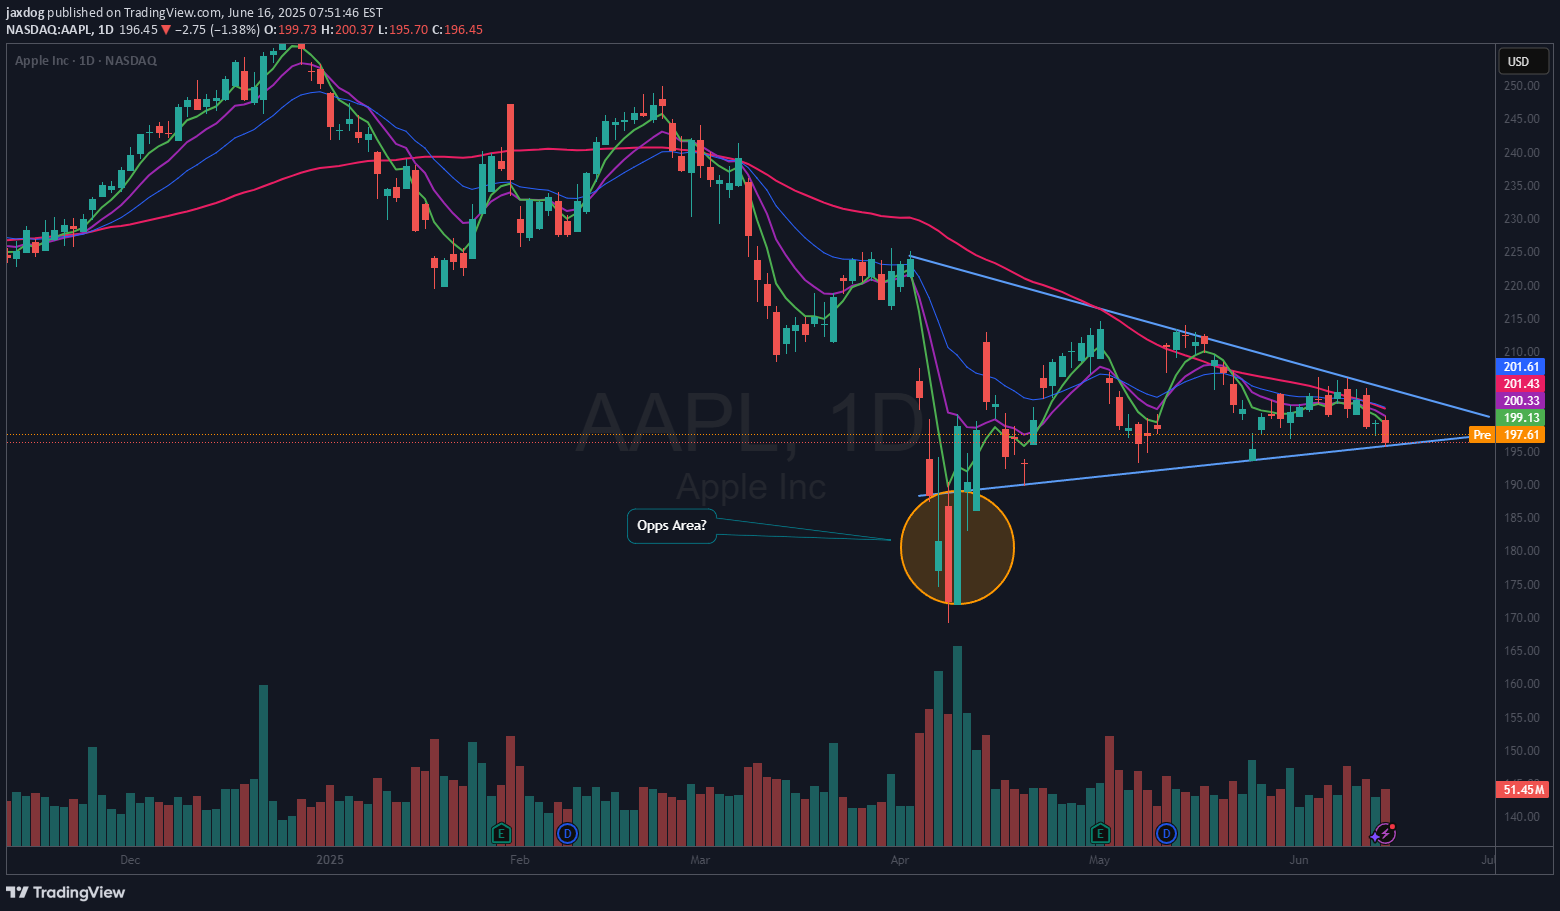
AAPL is consolidating here in a wedging pattern. I do not know which way this will resolve. But, since I rarely if ever short, I am looking on the long side of a trade. The thing I like about a consolidation pattern like this is, you know when you are wrong very quickly. My plan is to take a ¼ size long position if / when it moves above the 50 DMA (red) with a stop just below the most recent low (which would also correspond to dropping below the lower wedging trendline. Then if it can break out over the upper downtrend line, I will look to build out my position. I thought this would be a good one to put on your watchlist. If you like the idea, please make it your own so that it fits within your trading plan.I have been long AAPL for about a week. I have added progressively and as of today have a 125% position as it looks like it is breaking out here.AAPL Building a nice bull flag here... I am looking to add to my position.
jaxdog
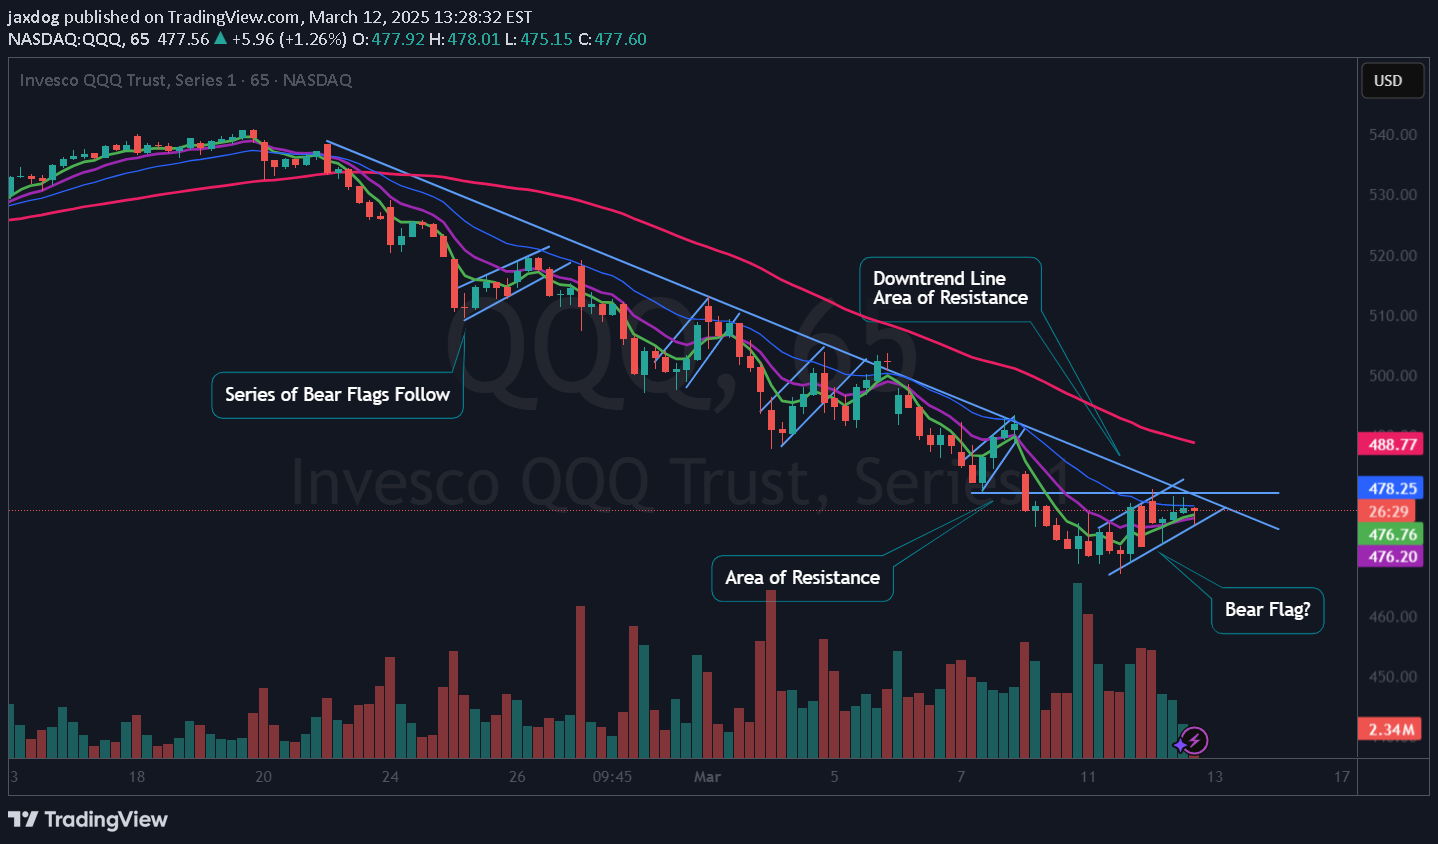
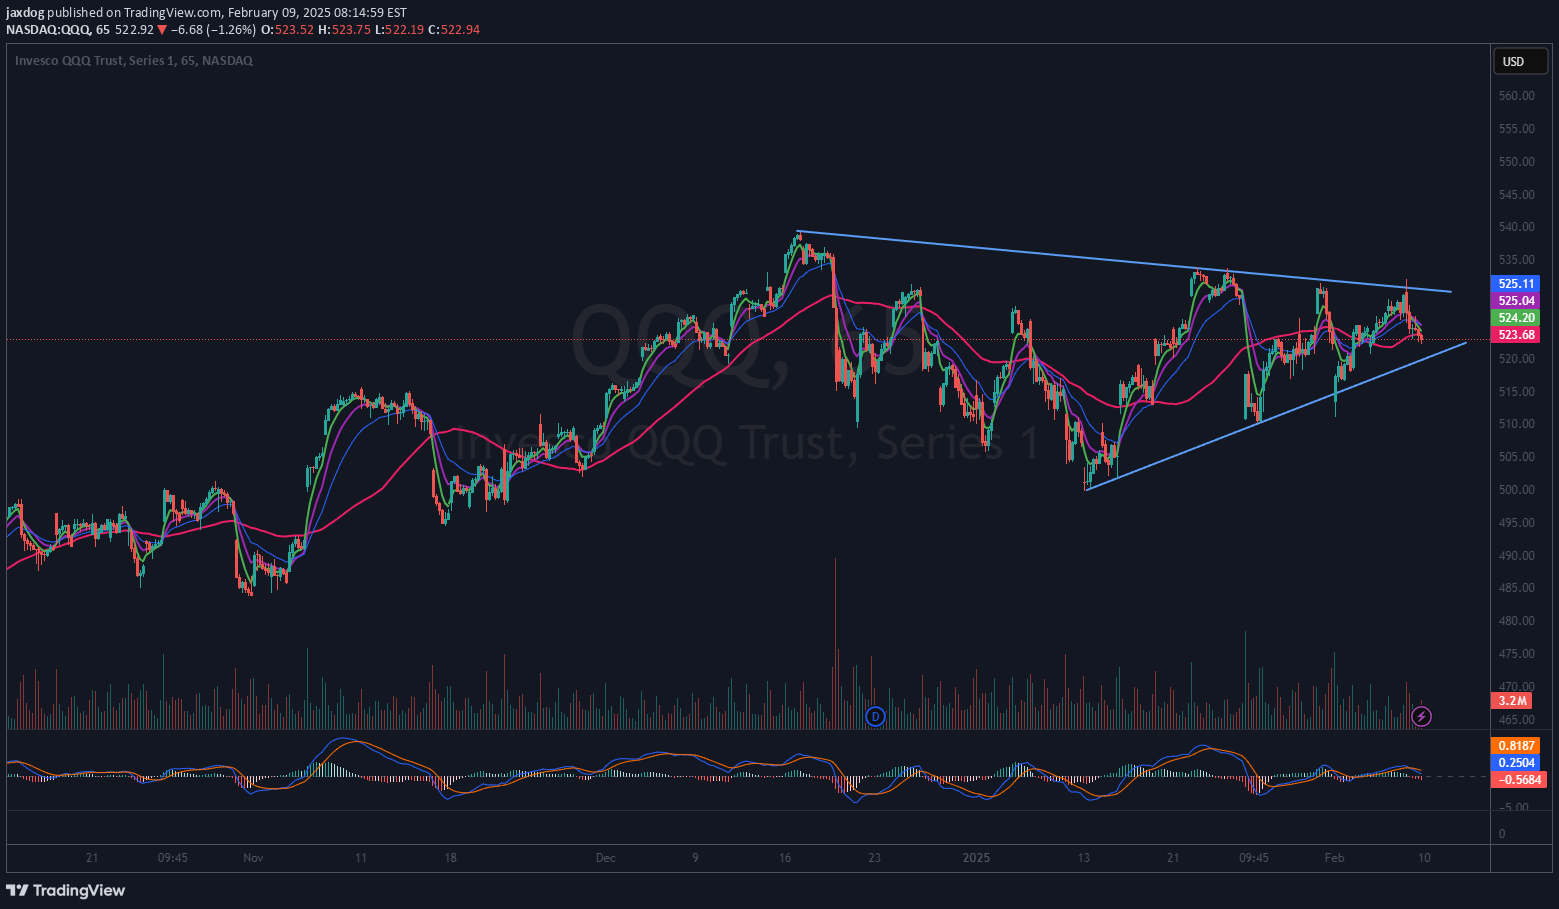
QQQ For a bull case, I need to see this get above both the horizontal area of resistance and the downtrend line on this 65 minute chart. It looks like it could be forming yet another bear flag. All TBD. If it breaks the flag down, I would expect another leg lower. So what we have here is a case of do or die. Hope this helpsIt needs to put in a higher low as well.
jaxdog
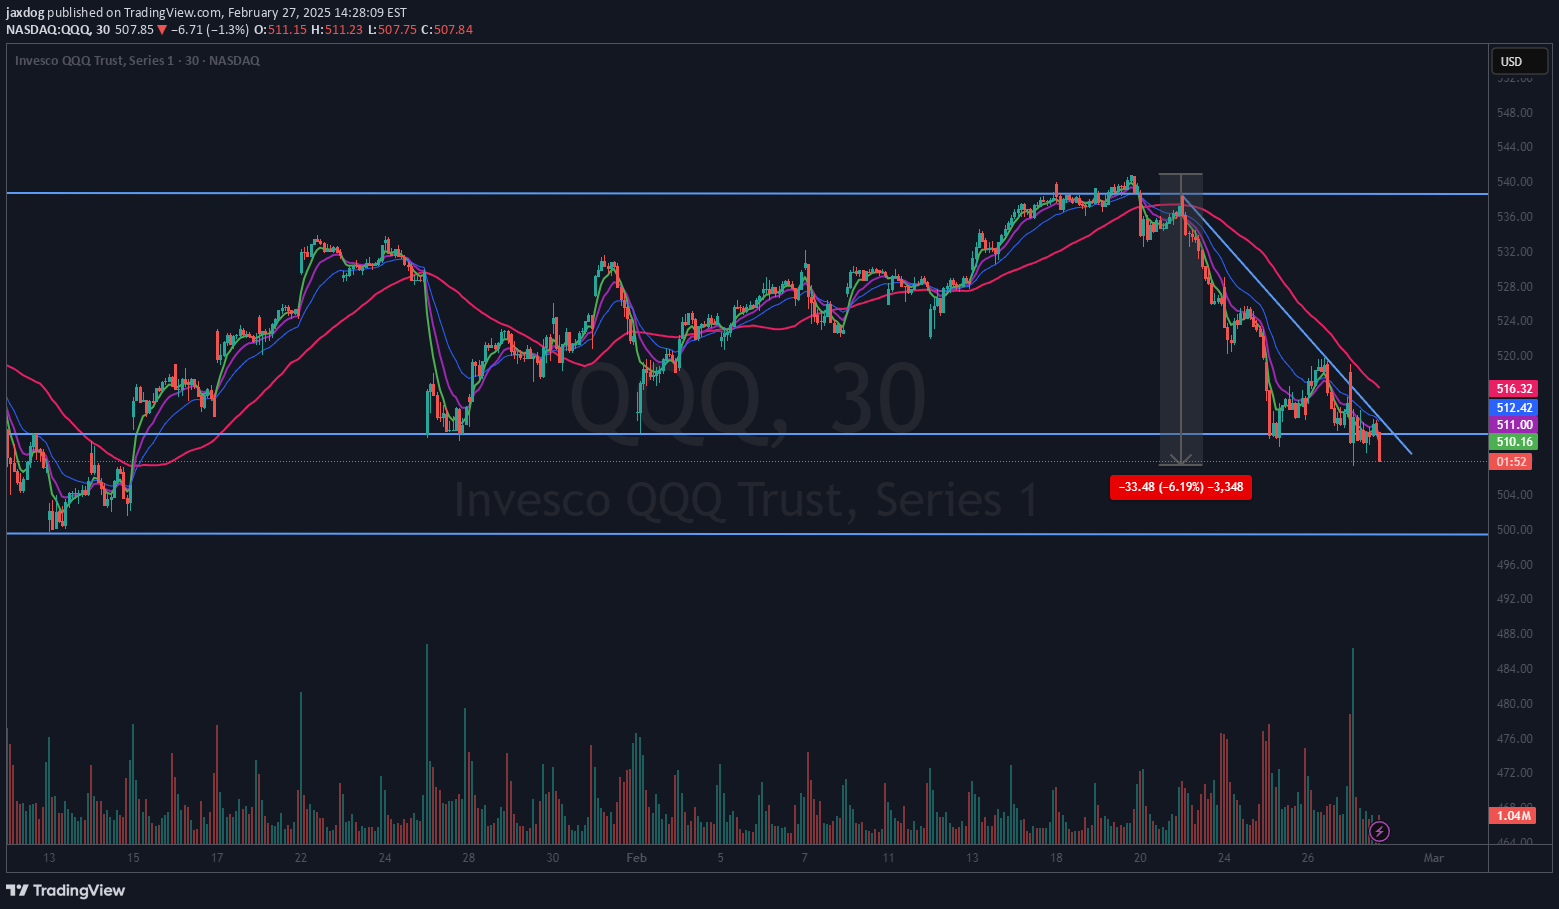
QQQ I am stalking a bounce on the Q’s. From an intraday high (all time high) to an intraday low on this chart is about 6.2%. I would expect at least a dead cat bounce in the short term, but the market may not deliver for me. Having said that, I have an alert set on this 30-minute chart on the Downtrend line. “If” that triggers, I will go to a 5- or 10-minute chart to see if there is a good risk reward entry. And if I take the trade, it will be meant to be a day trade (of which I am not a fan) but it could turn to a swing trade “if” it gives me at least a 2% cushion. I know I have a lot of "ifs" on this one, but isn't that the way it is? I had posted another chart on the QQQ index with a link below. I had said in that one that a pullback to the 510 “area” would not negate the longer-term uptrend. But one must be open to all outcomes.
jaxdog
QQQ had a big bearish candle on Friday. If you look left on the chart there were 2 comparable recent days. On Dec 18, 2024, and Jan 7, 2025, both lead to further downside. On Dec 18, the decline before a rally was about 5.3% and the Jan 7 decline was around 4.9%. Friday’s decline was about 2.4%. “If” those declines are any guide, we could expect another 2.5% to 3% additional deterioration. Which portends a pullback to around 512 to 510. Think of those as areas of concern, not a prediction. I have also drawn in horizontal lines that “may” become areas of support or resistance. In addition, we are touching an area of upward sloping line (area) that has defined a series of higher lows over the last 4 weeks. In summary, it is a good idea to have an open mind about any outcome over the next few days to weeks and simply look at these areas to see if they do indeed end up being turning points. One more point, this is an index fund and as such looks at heavily weighted stocks. We are likely in a period of picking individual stocks that are leading and using this index simply as a guide to overall market health. I hope that helps.QQQ Just in case we get a 10% pullback (considered a normal correction or pullback in an uptrend) we are looking like this:That is around 486...
jaxdog
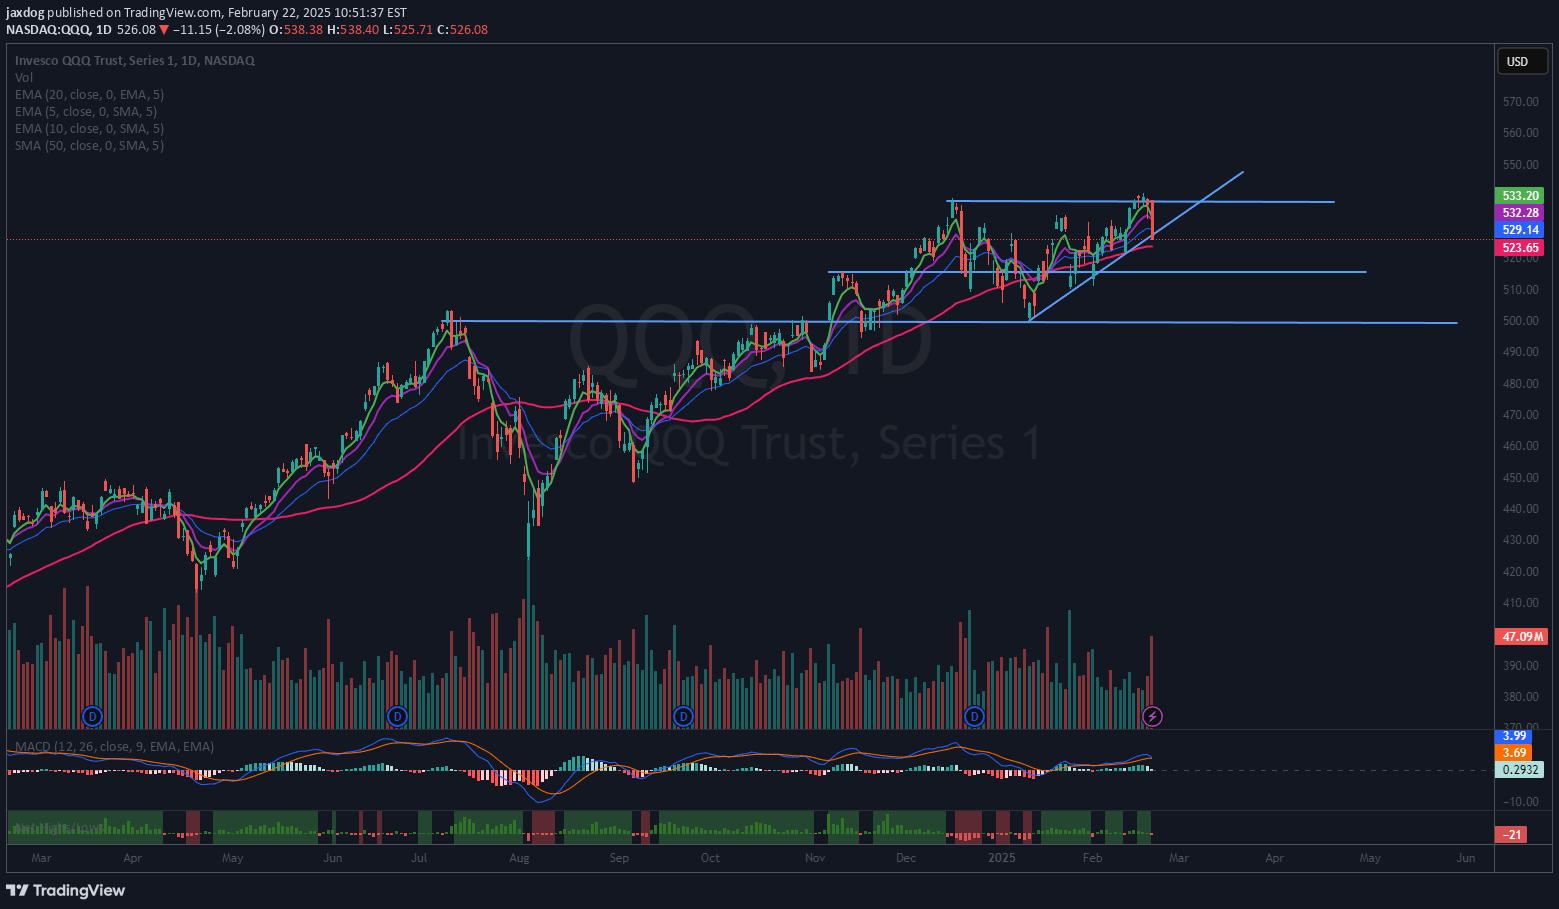
QQQ is clearly in a wedging pattern. These types of patterns “usually” resolve in the direction of the larger trend. In this case that trend is still up. This is a news driven market now so anything can happen. I have an alert set at both the top and bottom of the wedge lines. I do not plan to short this market, but should it break down, I may want to reduce my exposure. And if it breaks to the upside, I may add more exposure. I am giving my observation of the market. Nothing more.
jaxdog
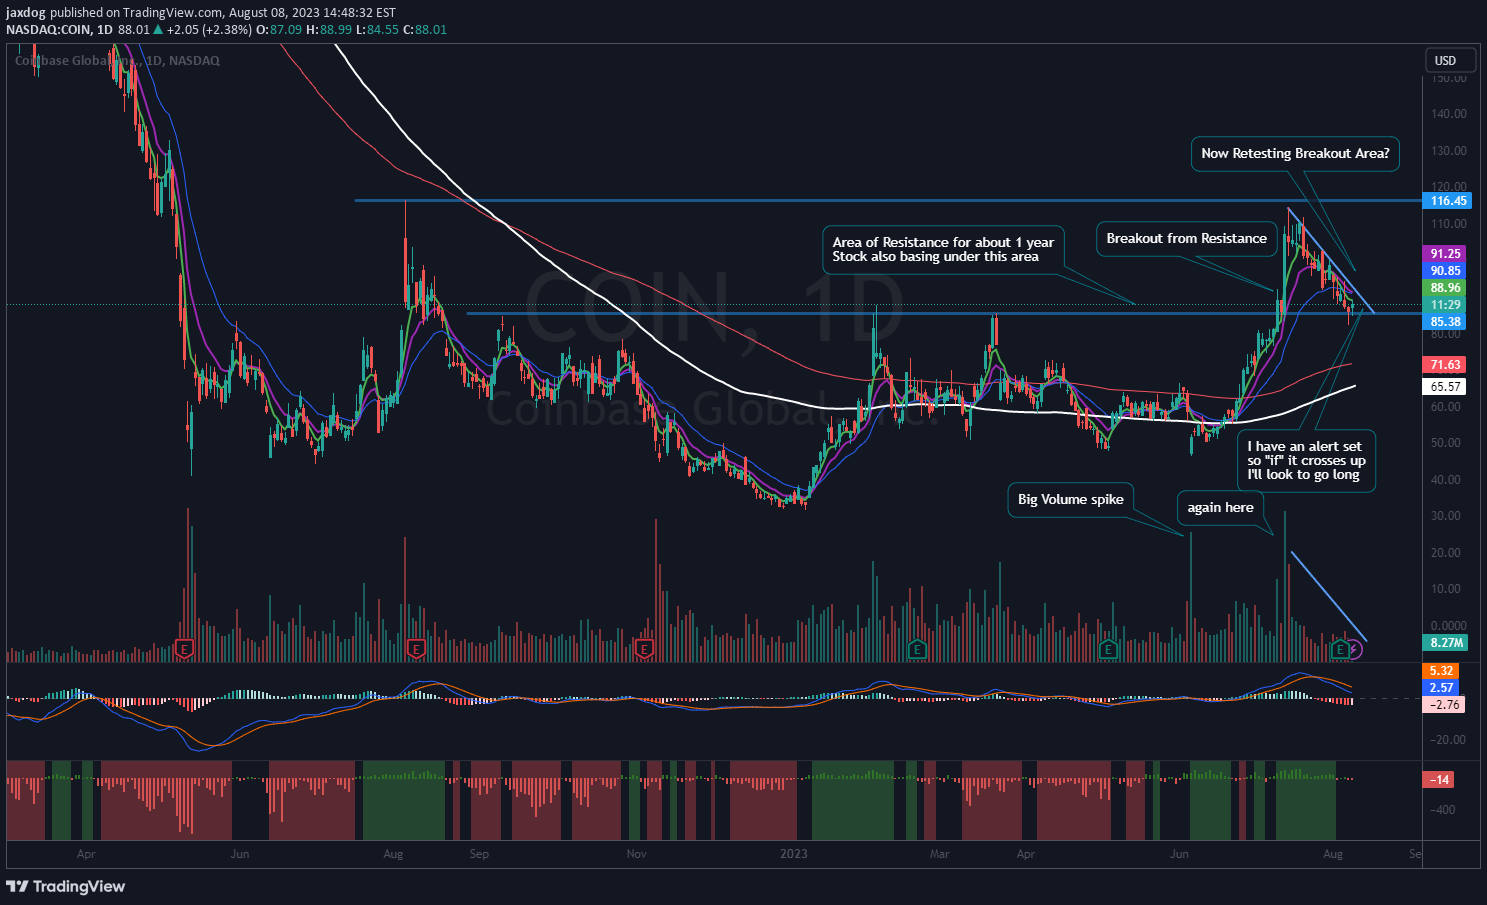
There is a lot to like about this COIN chart. First, it has had a long stage one base (about a year). It seems to have established an area of resistance during that basing period. Then on July 11, 2023, it broke-out with big volume, retested the next day the then on July 13th it had the biggest volume day since May 2022. Since that breakout it has consolidated and pulled back to the breakout area on lesser volume. I have no idea if it will take off again, but I like the prospects. See notes on chart for my thought process. Ideas, not investing / trading advice. Comments always welcome. Thanks for looking.
Disclaimer
Any content and materials included in Sahmeto's website and official communication channels are a compilation of personal opinions and analyses and are not binding. They do not constitute any recommendation for buying, selling, entering or exiting the stock market and cryptocurrency market. Also, all news and analyses included in the website and channels are merely republished information from official and unofficial domestic and foreign sources, and it is obvious that users of the said content are responsible for following up and ensuring the authenticity and accuracy of the materials. Therefore, while disclaiming responsibility, it is declared that the responsibility for any decision-making, action, and potential profit and loss in the capital market and cryptocurrency market lies with the trader.