
jasperlawler
@t_jasperlawler

What symbols does the trader recommend buying?
Purchase History
پیام های تریدر
Filter
Signal Type
jasperlawler
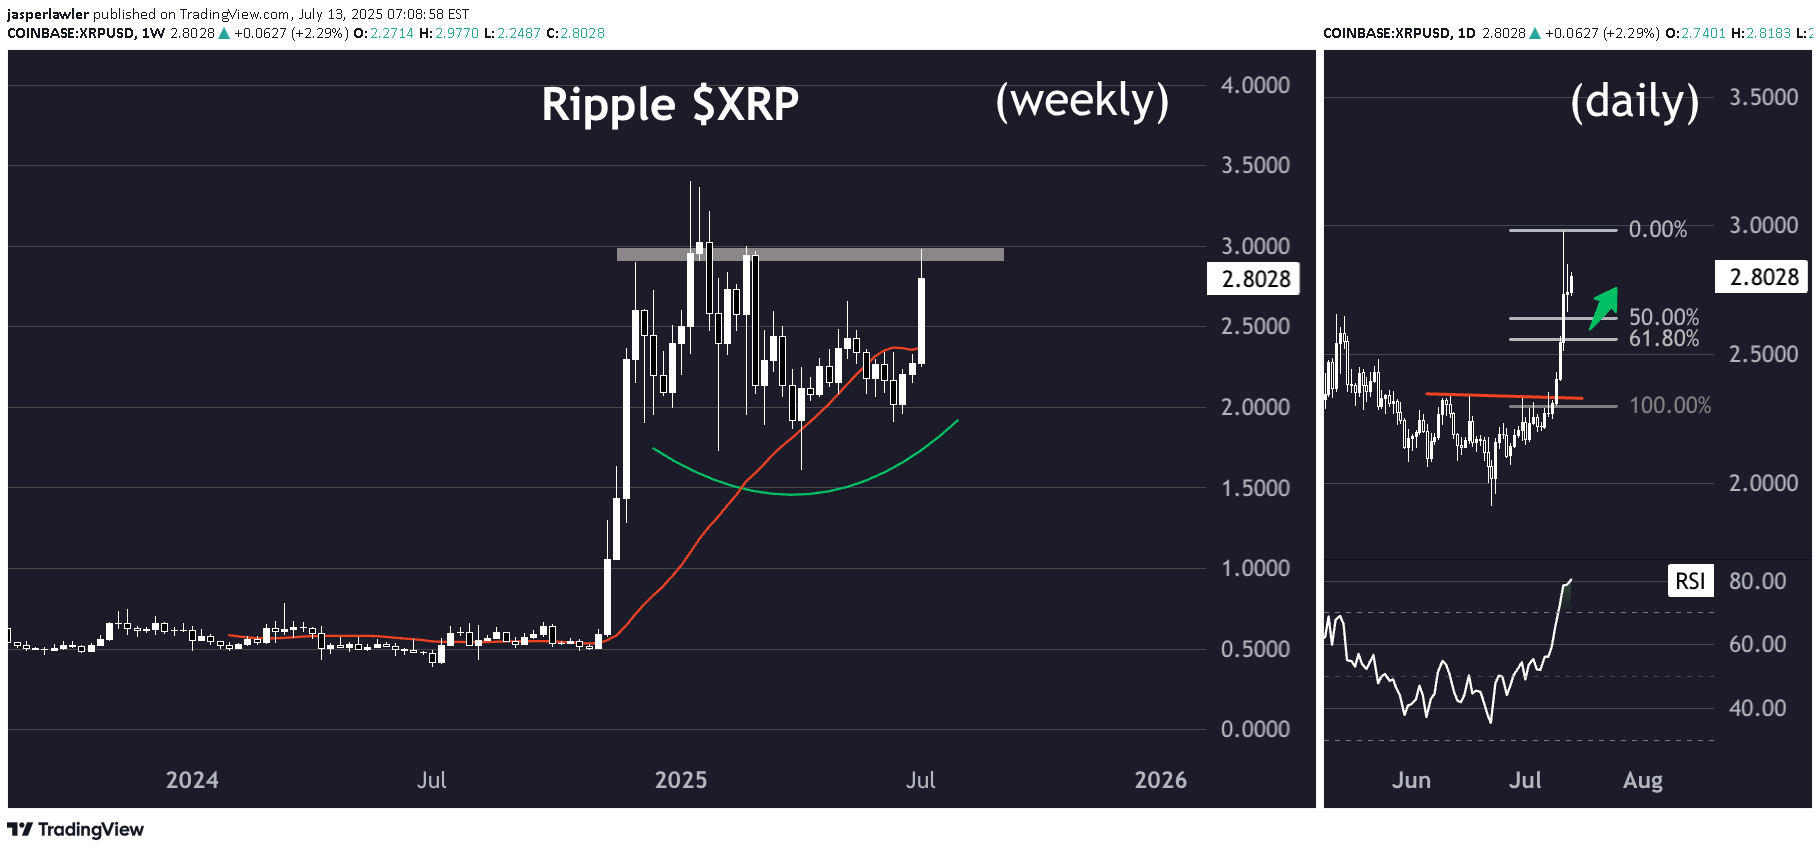
Setup The price has been consolidating since the explosive move from ~50c to $3 last year. There has been a wide $1 price range between $2 and $3. A failed breakdown below a still rising 30-week moving average and new 4-month high suggest underlying bullishness. Signal Should there be any follow-through to last week's big up-move, then any pullback to the golden pocket between the 50% and 61.8% Fibonacci retracement levels could trigger a rebound.
jasperlawler
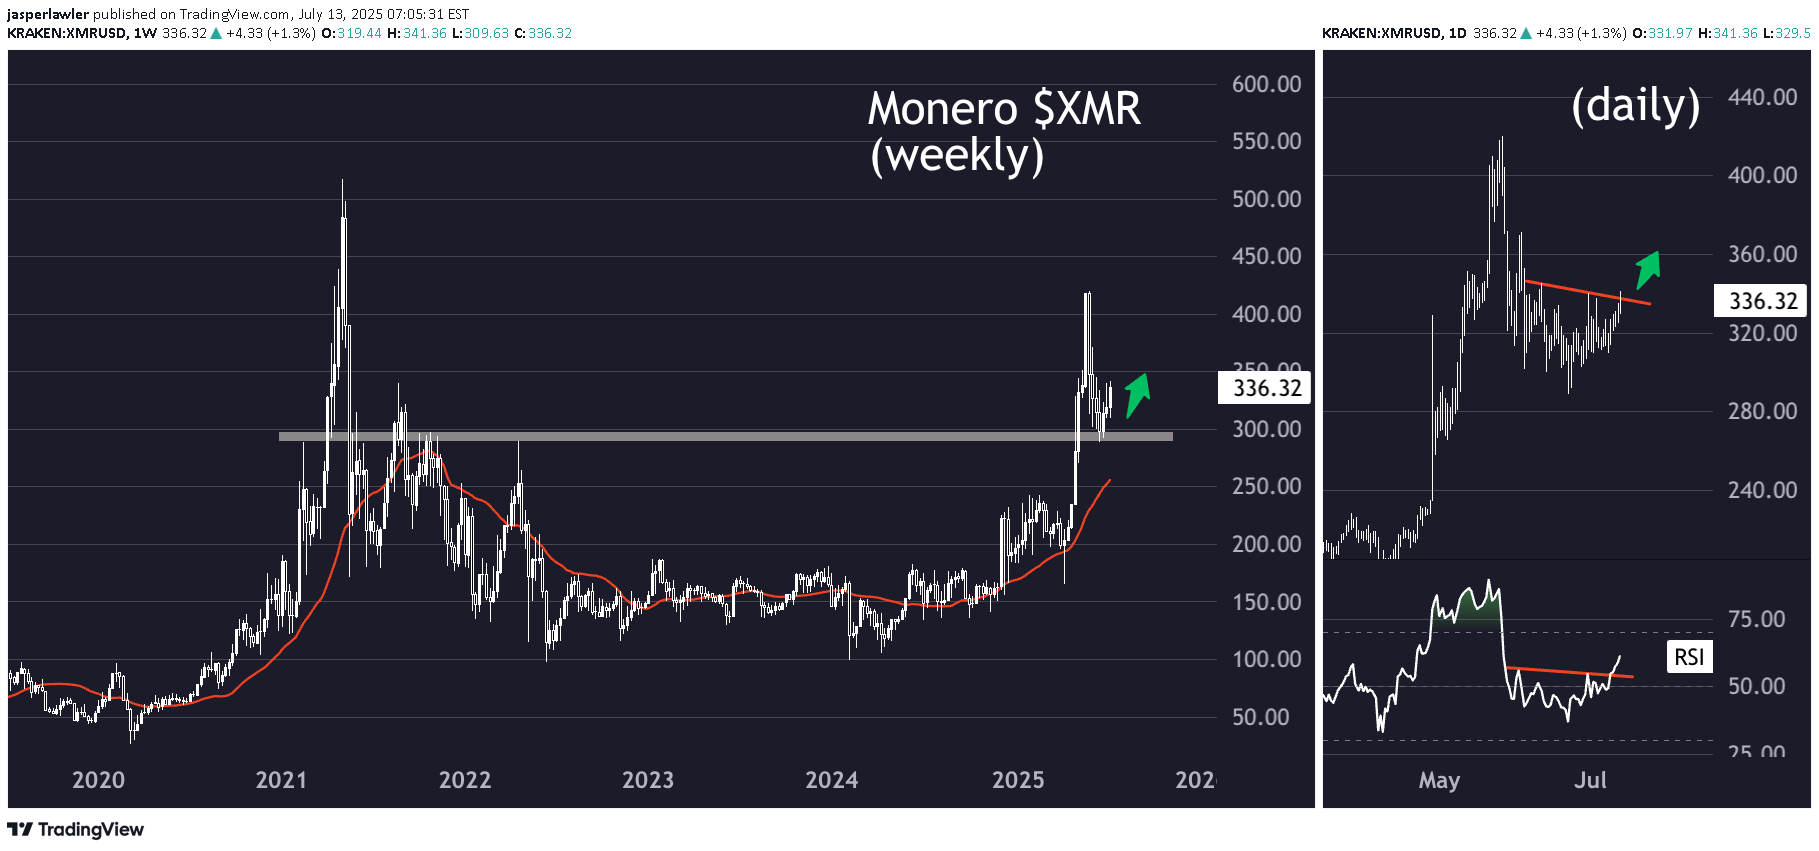
Setup The price has pulled back to a formerly significant price pivot at 300 after hitting a 4-year high over 400 in April. The price is well above its up-sloping 30-week moving average. Signal The daily chart shows a potential breakout from a base formed above 300 with RSI also confirming the bullish turn with a break over the 50 level.
jasperlawler
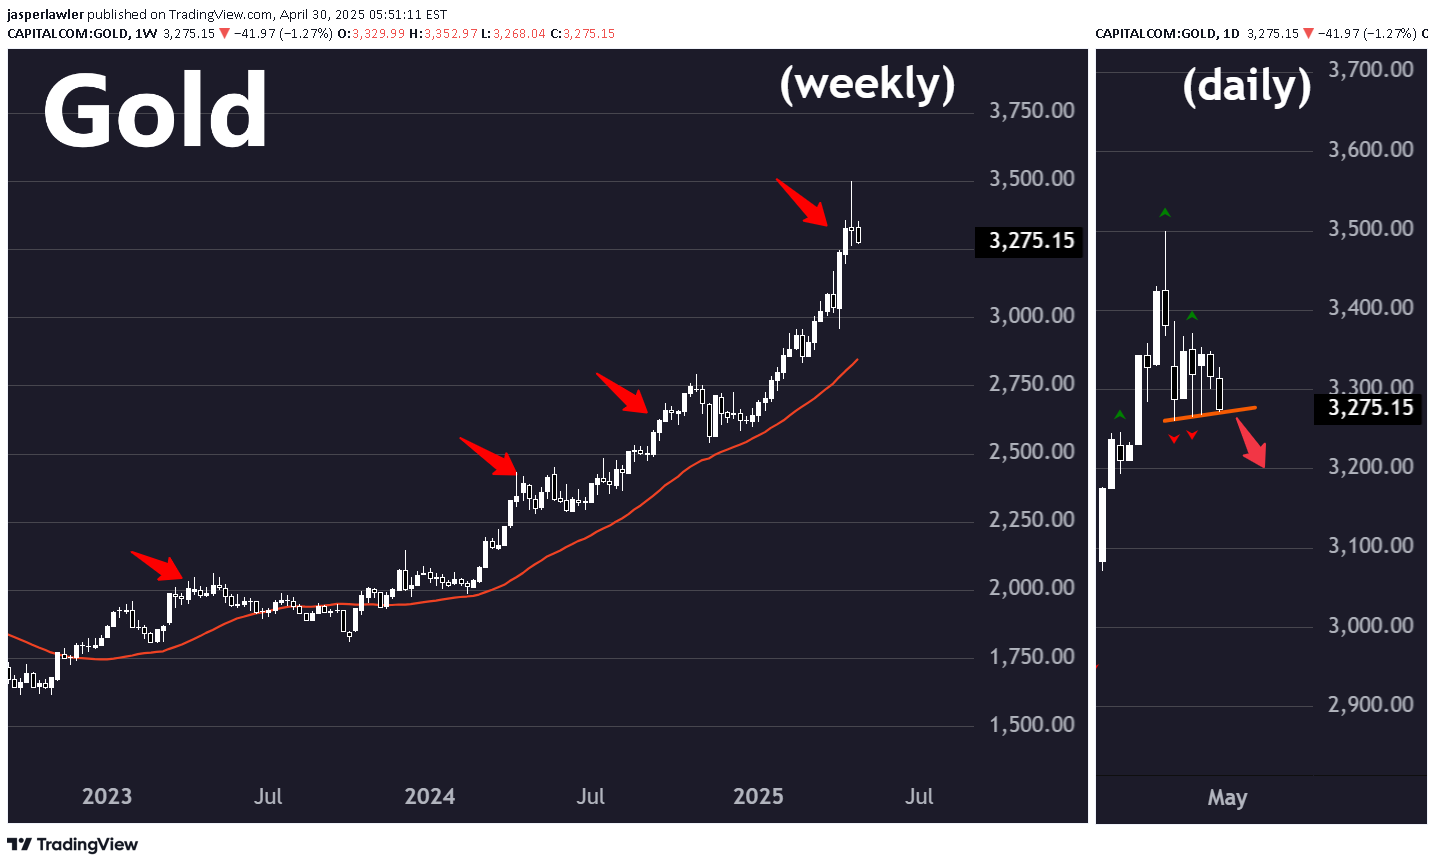
The trend in gold is higher and no doubt it can go higher still.. BUTThere is a possible short setupbecause:A) It's very overbought relative to its weekly averageB) A Weekly shooting star reveral pattern took place on the weekly chartC) The daily chart shows a possible breakdownThoughts?
jasperlawler
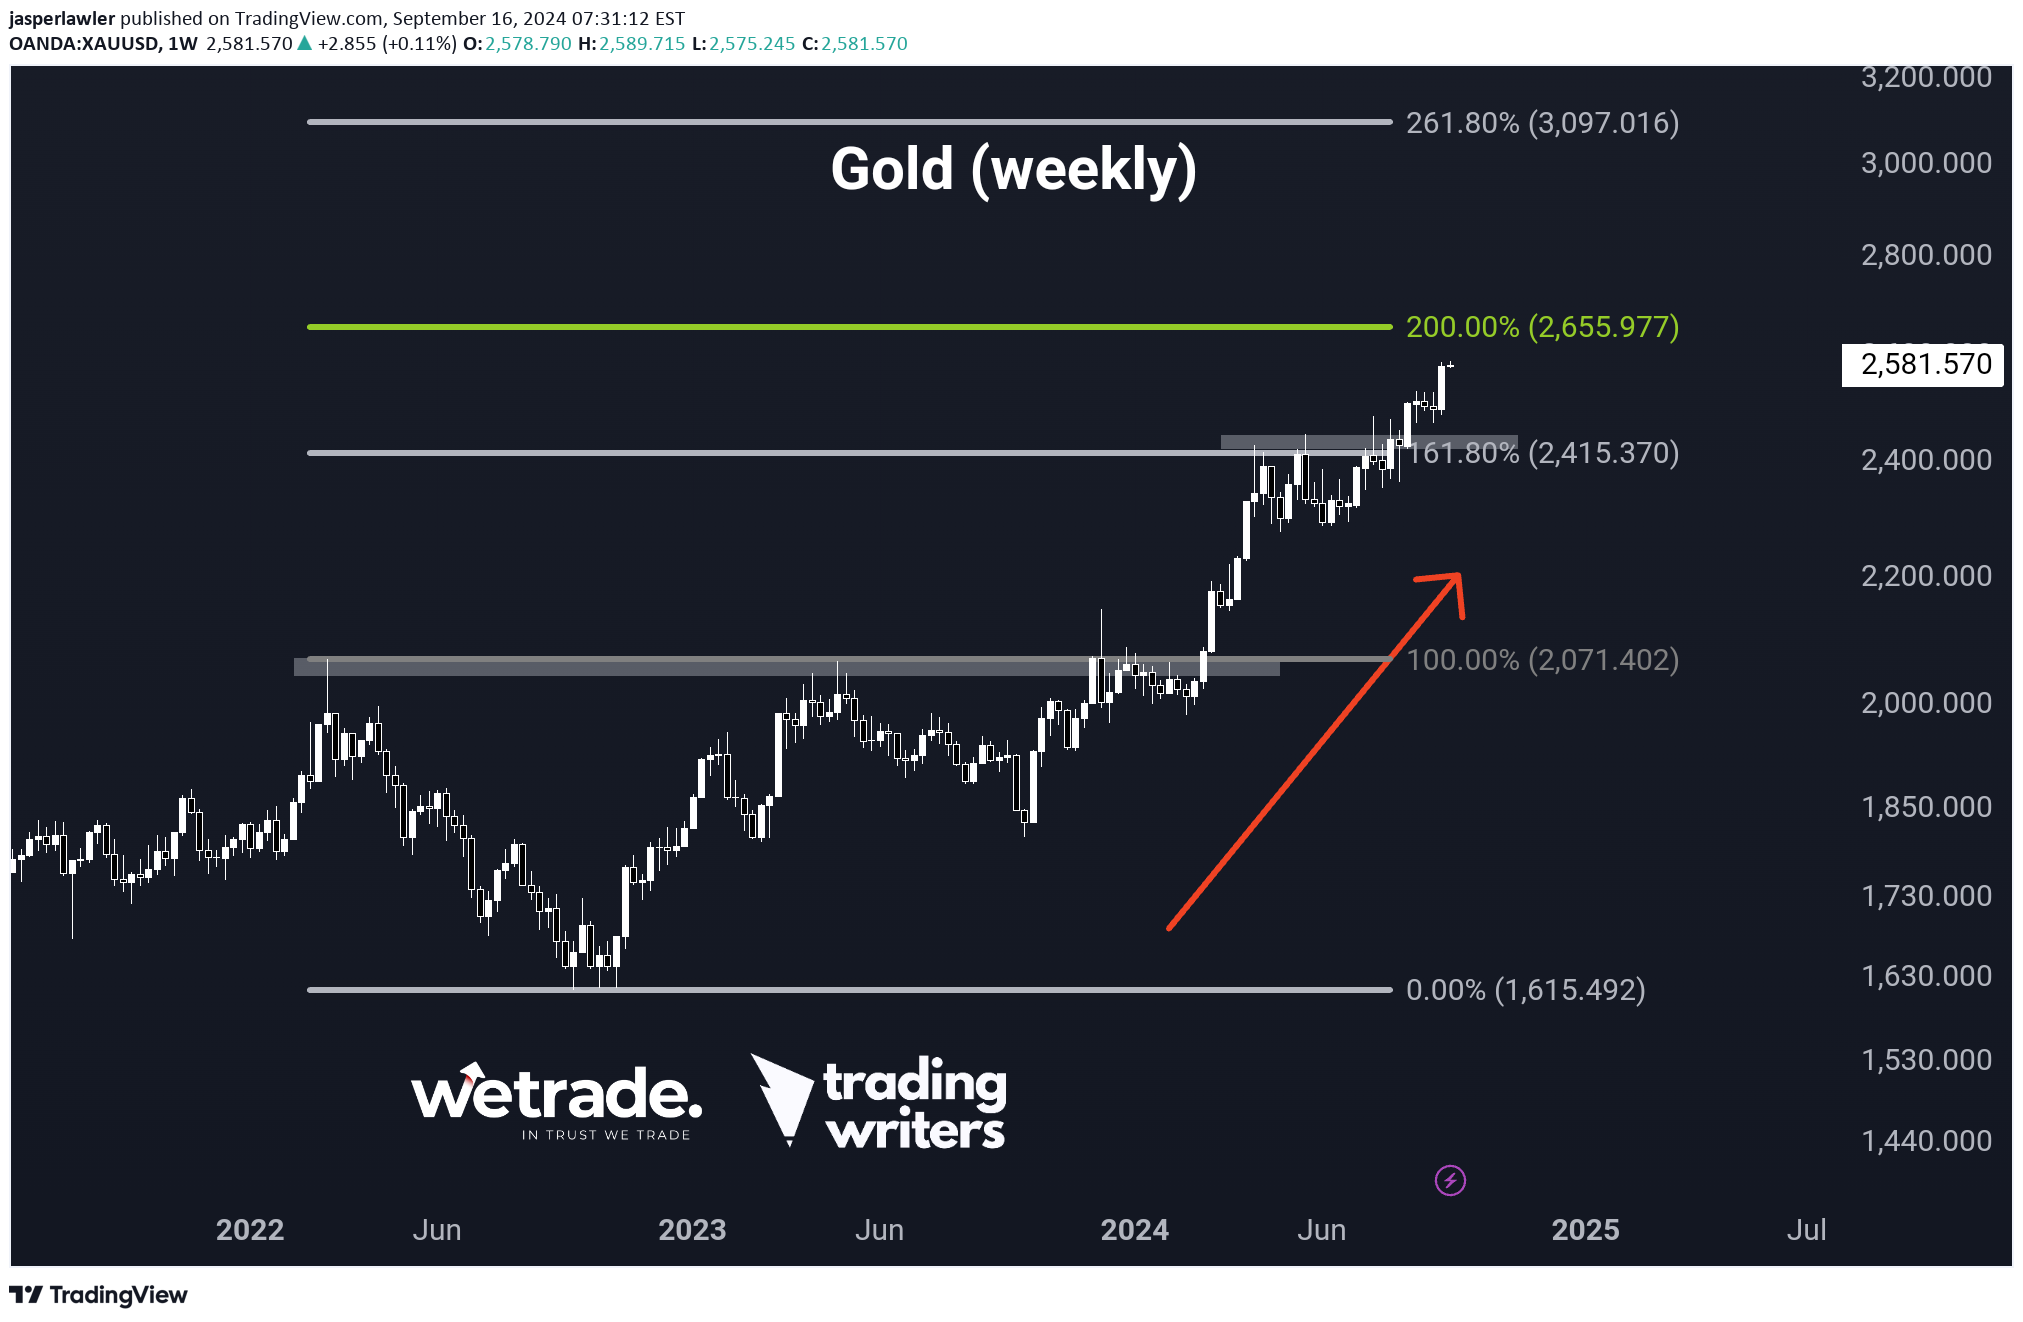
Gold broke out again last week after a 3 week rest.You can visually see gold traders ‘taking a breather’ with 3x weekly doji candlesticks. Last week was the breakout - again - and notice how much quicker it took to break out this time versus the multi-month sideways action that started in May and lasted through August.This is a much more bullish market now and bulls have less patience to get positions on.But where do we go from here, if there is no resistance above a record high?A tool we have found a lot of success with is the Fibonacci extension.Do you see how the 161.8% extension called the top of the 4-month range we just mentioned?The 200% extension, i.e. not just retracing all of the move lower but then doubling it - comes in at 2655. The 261.8% is the big one - that would get us over 3000 (3K!!). Given the bullish nature of this market, we’d be surprised to see gold retest former highs at 2520 but if it did that would be first natural support.But somewhere between 2520 (support) and 2550 interim round number could offer a good risk:reward for a move up to our first target at 2655.But that’s just what we think, do you agree or disagree?Send us a message and let us knowHappy Trading! Jasper, WeTrade Market Analyst and Founder of Trading Writers.
jasperlawler
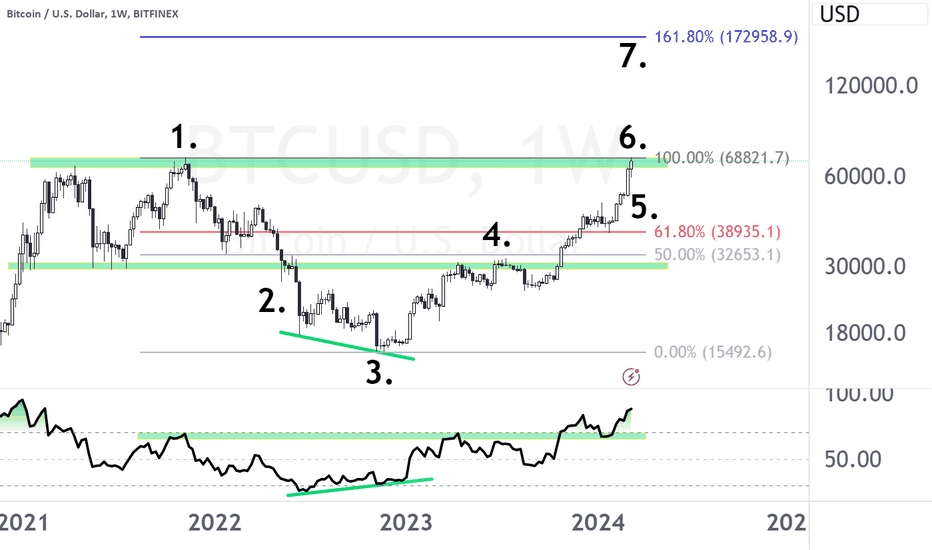
1. Previous ATH at $60,000 in 2021 formed a double top.2. Support ~$30,000 broke.3. Bottom in late 2022 after a bullish RSI divergence.4. 50% retracement at $30,000 (support-turned-resistance)5. The 61.8% Fibonacci retracement matched RSI overbought at 70.6. Price fully retraced 100% of its decline to hit a new ATH.7. 161.8% Fibonacci extension has objective of ~$170,000.Also if interested, check out my full guide to predicting crypto here:How to Predict Cryptocurrency Prices for 2024 & Beyond: ‘Trade Facts, Not Wishes’techopedia.com/how-to-predict-cryptocurrency-prices
jasperlawler
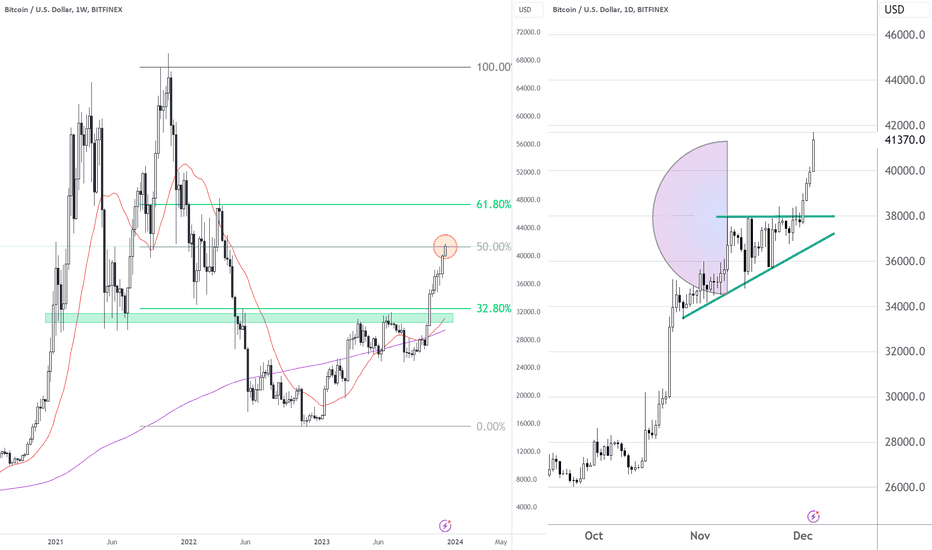
Just under 42K in BTCUSD is the 50% Fib of the entire drop from record highs to the 2022 low. It is also the objective from the recent triangle breakout.Note: this is very counter momentum - which are usually works out pretty quickly - either in profit or loss! Also - the triangle is probably part of a bull pennant in which case the upside objective is more like 49K.
jasperlawler
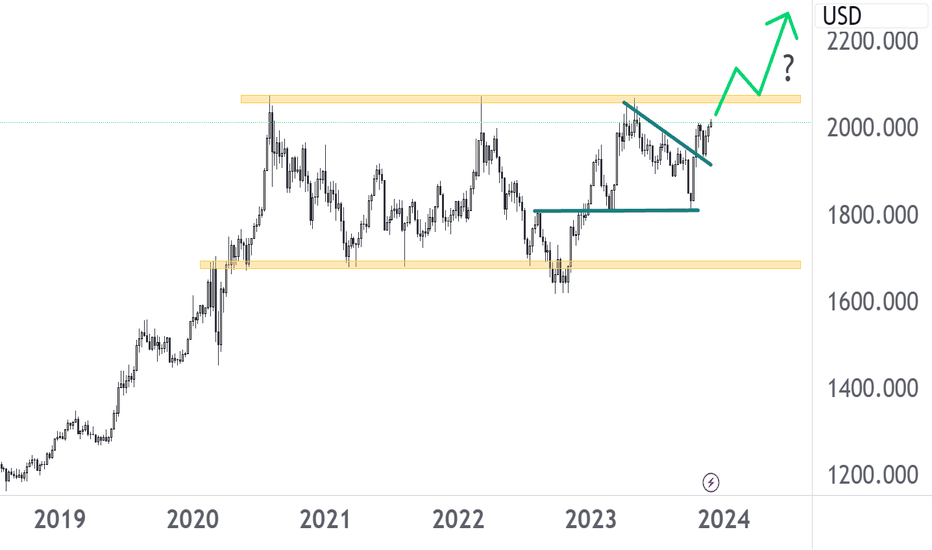
It's a pretty clear long-term horizontal range in gold.The break of a downtrend line suggests another test of the range top.Here is a bullish scenario for what follows.The Trade- enter at the breakout, add more on the pullback, cut losses if price moves back into the range or add more on the break of the high formed after the break - then ride it to 2200 and more...Crazy spike at the breakout to new highs - breakout still on unless a daily close under 2040 - then would abandon idea until closes back over it
jasperlawler
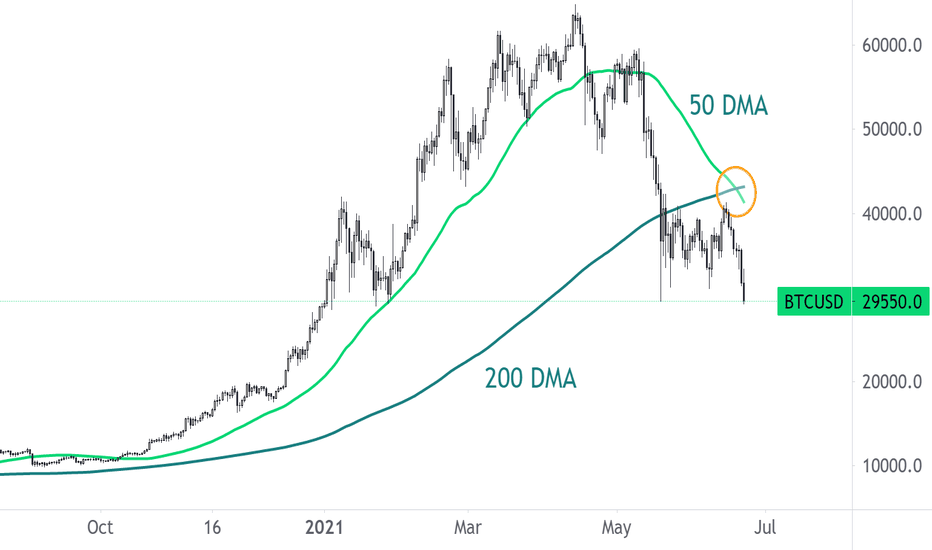
Bitcoin is moving below 30k and to new monthly lows after a death cross.What is the death cross? its the 5 day moving average crossing below the 200 day moving average.It suggests the longer term trend has turned bearish.
jasperlawler
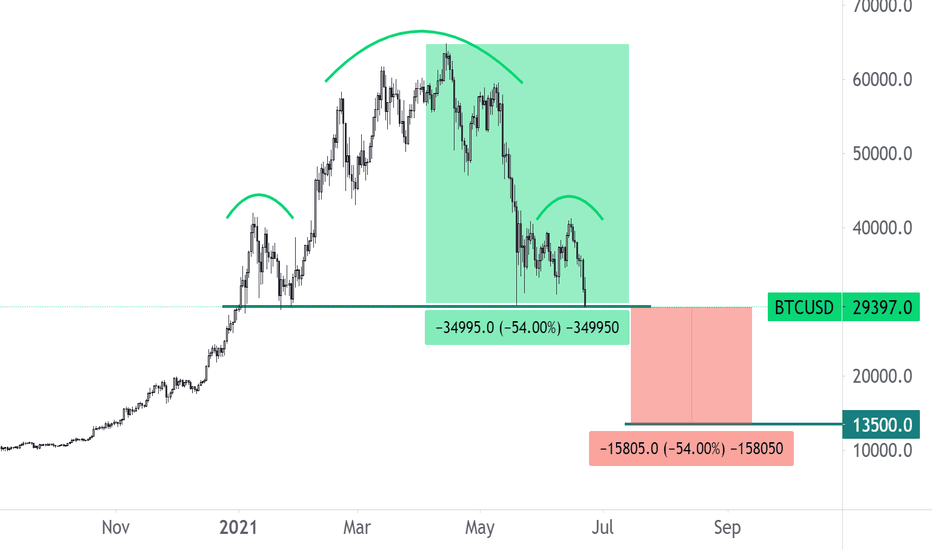
Using the 54% decline that has occured to current levels, and projecting them down from the current H&S neckline takes us down to $13,500 for BTC/USD
jasperlawler
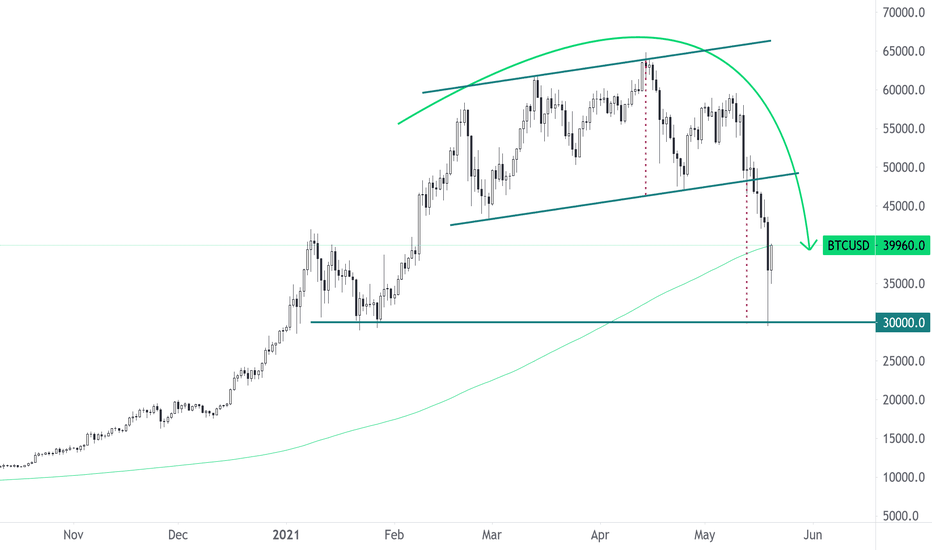
When the fundamentals are inexplicable, sometimes there is some sense in the technicals...The drop in BTC/USD over thep ast 5 days is a near-perfect measured move below the rising channel it had been in since March. The 30k level where the priced bounced yesterday found support from the February lows.The price is now back at its 200-day moving average, which will one hurdle to overcome if the price is headed back to 50k again.
Disclaimer
Any content and materials included in Sahmeto's website and official communication channels are a compilation of personal opinions and analyses and are not binding. They do not constitute any recommendation for buying, selling, entering or exiting the stock market and cryptocurrency market. Also, all news and analyses included in the website and channels are merely republished information from official and unofficial domestic and foreign sources, and it is obvious that users of the said content are responsible for following up and ensuring the authenticity and accuracy of the materials. Therefore, while disclaiming responsibility, it is declared that the responsibility for any decision-making, action, and potential profit and loss in the capital market and cryptocurrency market lies with the trader.