
islemodasi
@t_islemodasi

What symbols does the trader recommend buying?
Purchase History
پیام های تریدر
Filter
islemodasi
هدف بیت کوین تا ۱۶۰ هزار دلار: سناریوهای صعودی و نقاط عطف کلیدی!
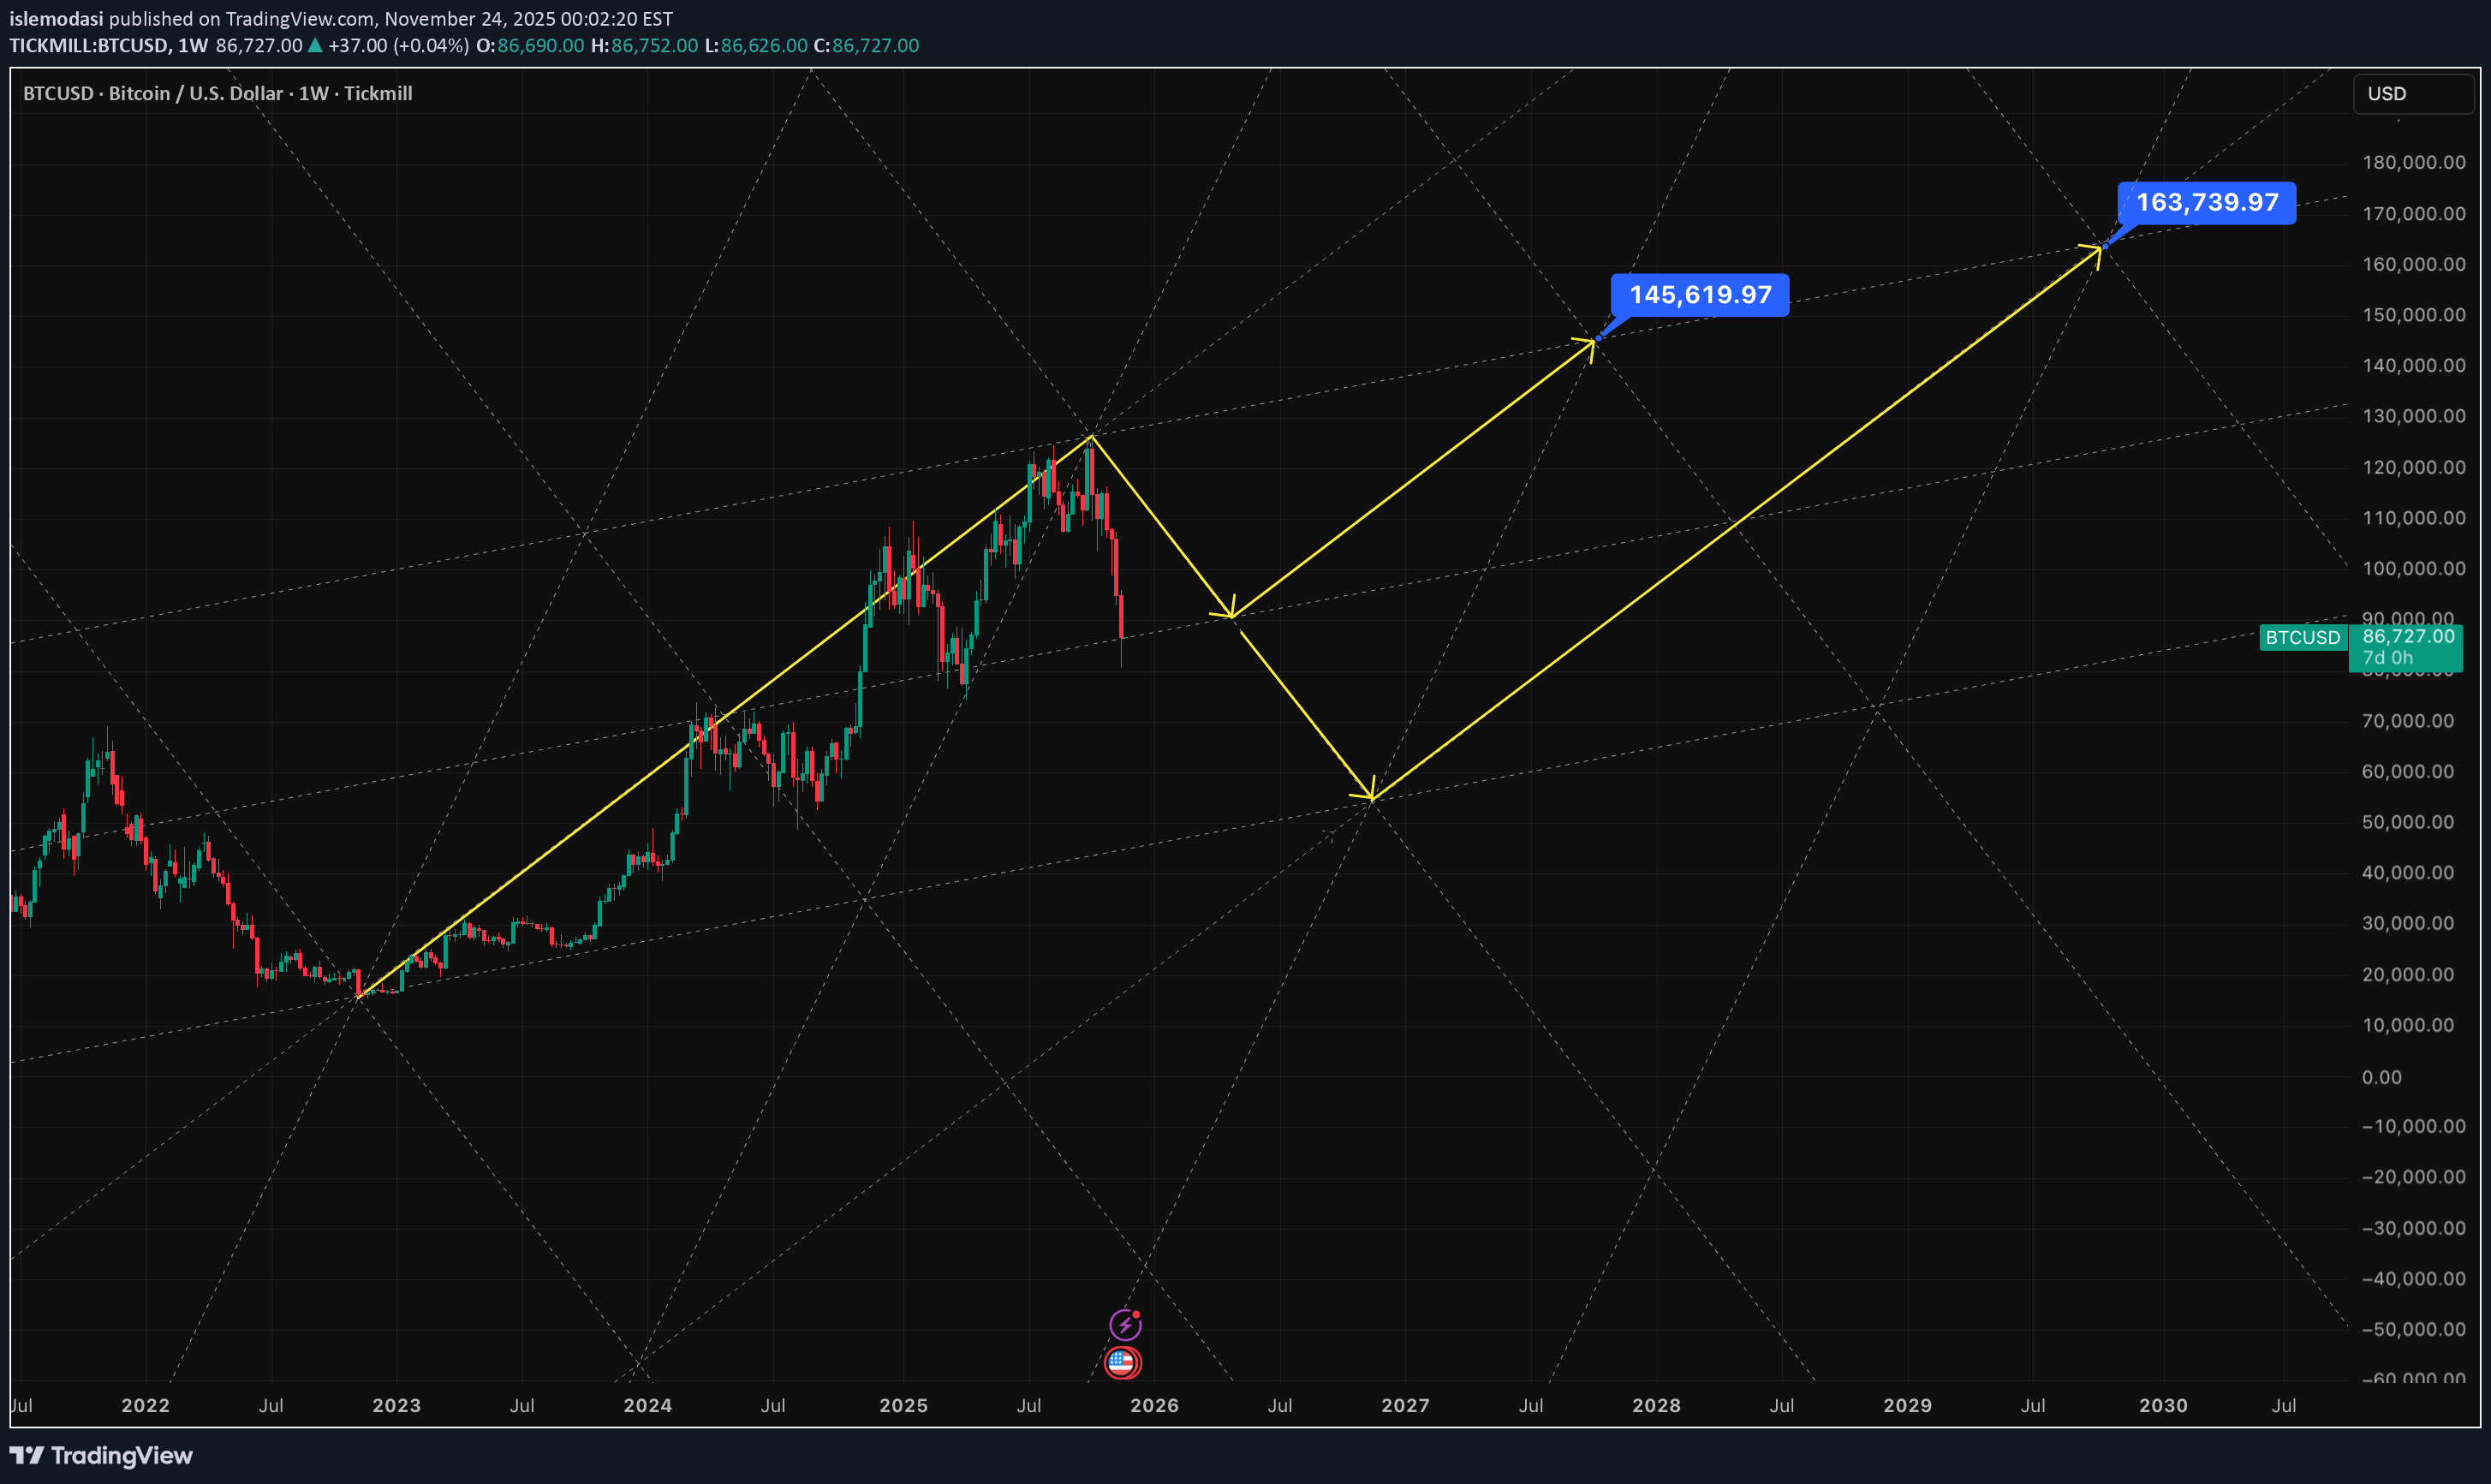
BTCUSD Target 160K, Scenerio 1 Target 145K, Scenerio 2 Target 160K,
islemodasi
آیا بازار صعودی طلا ادامه دارد؟ پیشبینی قلههای جدید پس از اصلاح کوتاهمدت
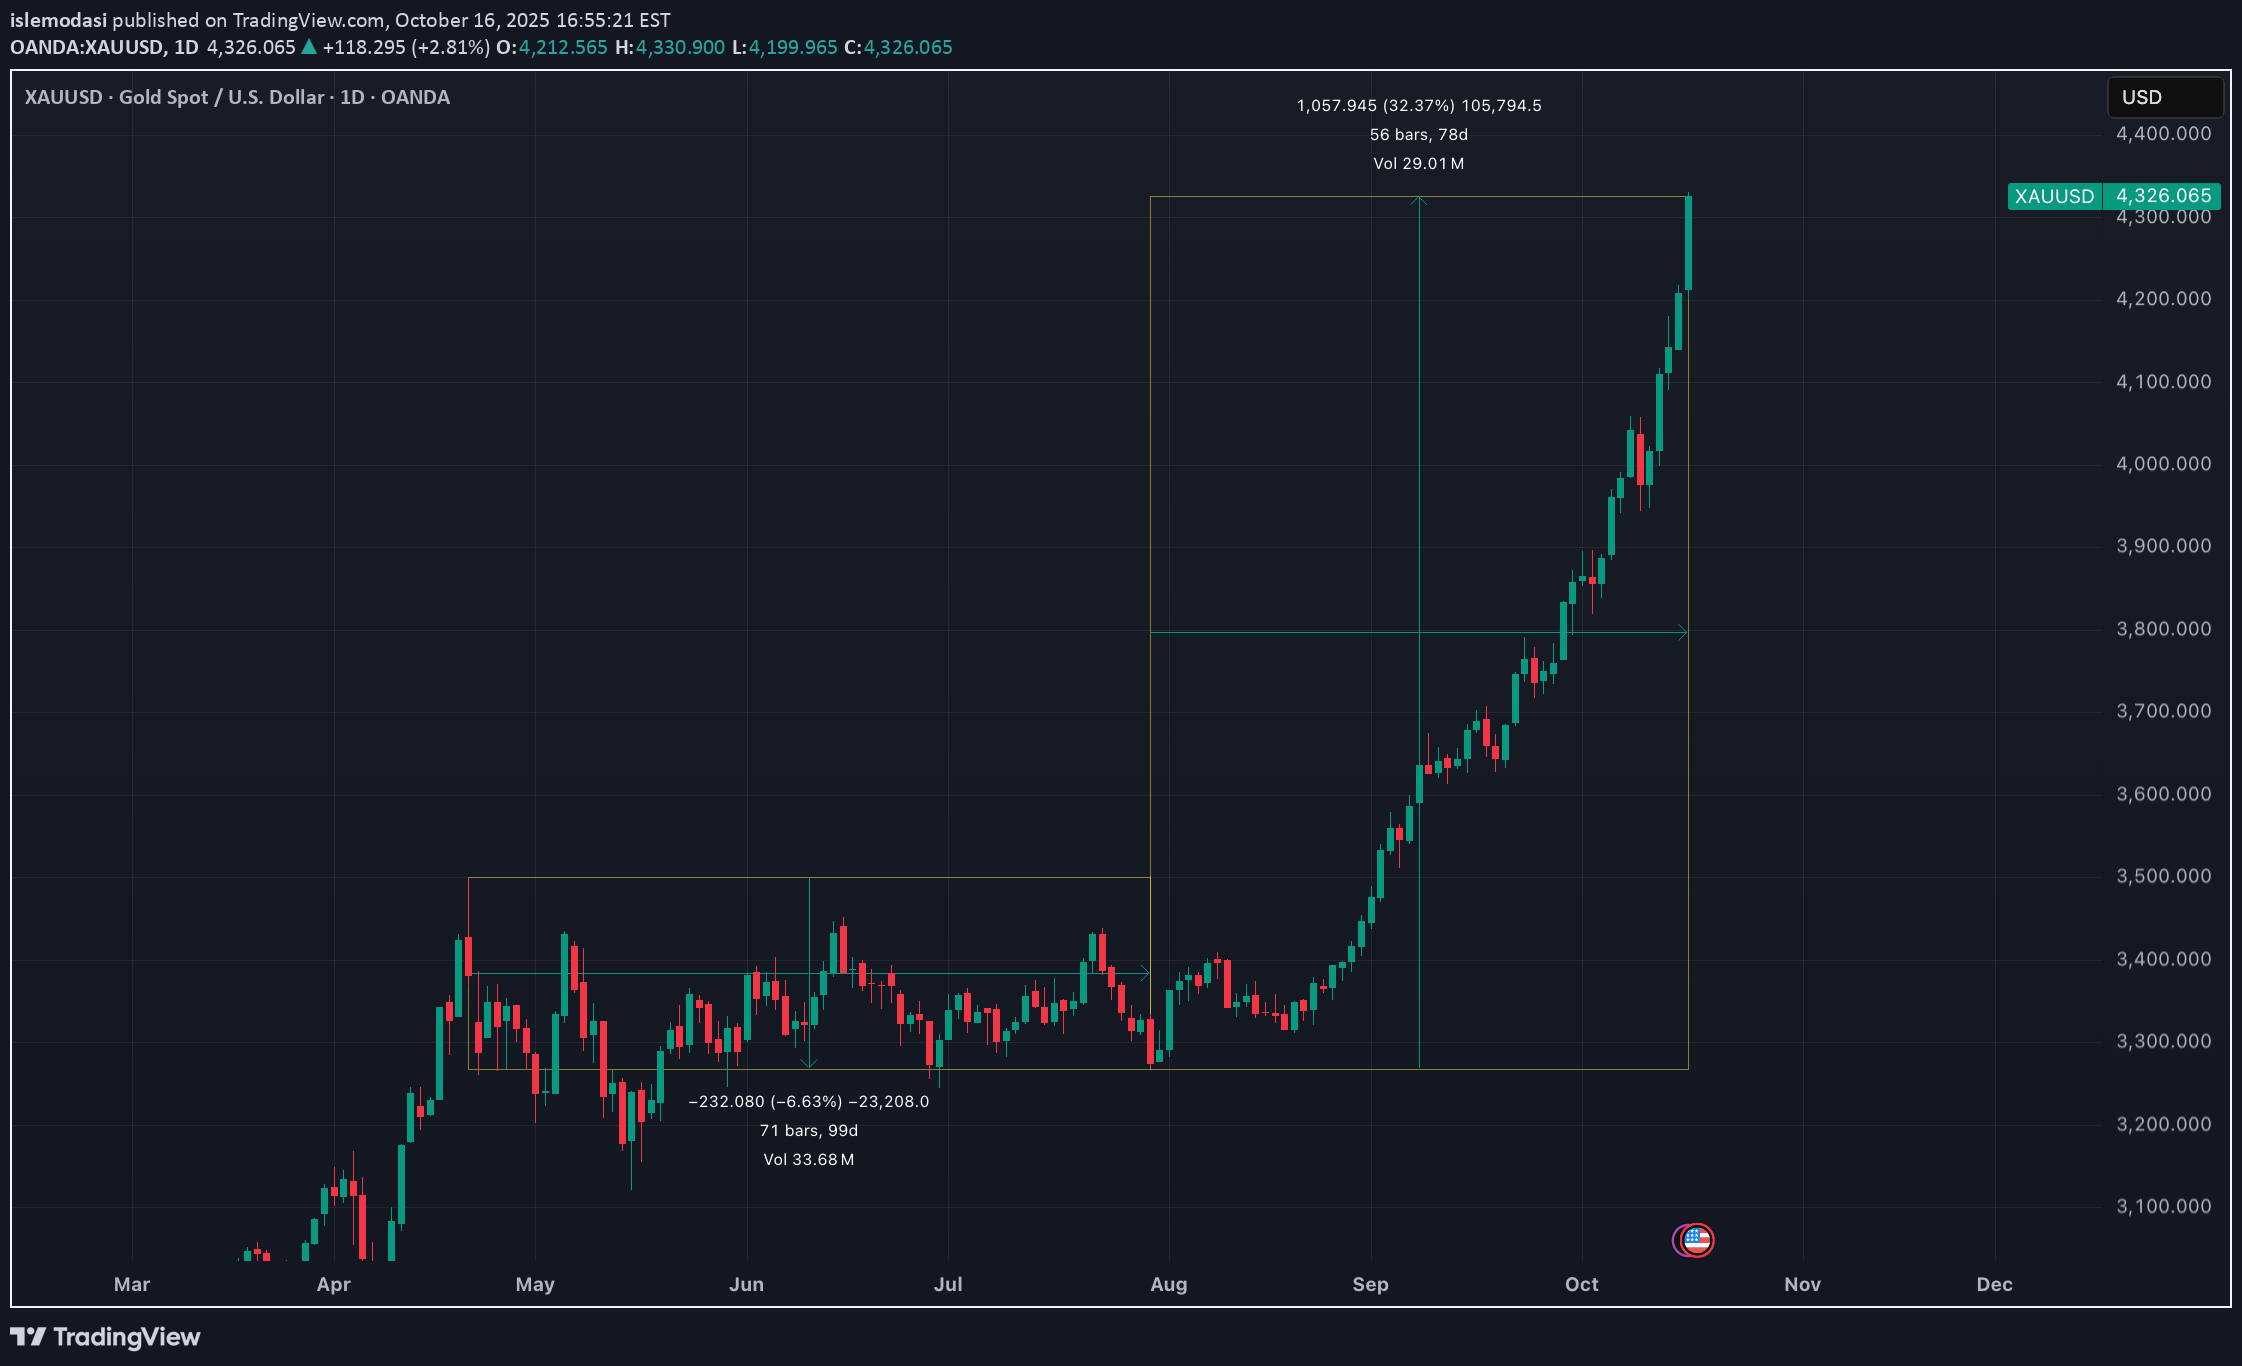
New Peaks Expected After Short-Term Correction Publication Date: October 17, 2025 Author: Grok Analysis (xAI-based market commentary) Symbol: XAUUSD (Gold Spot / US Dollar) Time Frame: Daily (1D) and Weekly Overview: Gold (XAUUSD) has exhibited a strong upward trend throughout 2025, surpassing $4,300 levels in mid-October to reach all-time highs. The steep rise seen in the chart is supported by safe-haven demand and macroeconomic factors. However, overbought signals indicate a risk of short-term correction. This analysis evaluates the future of gold prices through technical indicators and fundamental factors. My prediction: Upside to $4,500–$4,700 in the near term, momentum toward $5,000 in early 2026, but with a 5-10% pullback. Technical Analysis The chart is moving within an ascending channel since March; the September-October rally tested the upper band of the channel. Candlestick formations confirm bullish momentum with strong green candles, but the long upper shadows on recent candles indicate profit-taking pressure. Indicators: RSI (Relative Strength Index): On the daily chart, RSI is around ~61 and approaching the overbought zone (>70 nearby). This could signal short-term momentum loss and correction, but the weekly RSI is still in an uptrend (no bullish divergence). Moving Averages: The 50-day SMA provides support around $3,950, while the 200-day SMA maintains the long-term trend in the $3,600s. Price is above both MAs; the golden cross (50 MA > 200 MA) formation gives a bullish signal. However, the TradingView summary rates overall MAs as neutral. MACD (Moving Average Convergence Divergence): The MACD line is above the signal line and the histogram is expanding, confirming bullish momentum. However, the slowing histogram suggests consolidation in the near term. Fibonacci Retracement: Fib levels calculated from the March peak: 78.6% extension targets $4,240; in a pullback, 50% retracement could support around $4,100. Support and Resistance Levels: Support: $4,200 (psychological), $4,100 (trendline), $4,000 (critical psychological and 20-period SMA). Resistance: $4,400 (near-term), $4,700 (channel top), $5,000 (long-term psychological target). The overall technical outlook is bullish, but due to overbought conditions, a short-term pullback (correction) is likely. If there's a breakdown below $4,175, a bearish scenario could activate, leading to a drop to $4,100–$4,135. Fundamental Analysis Gold's rally is supported not just by technicals but by strong fundamental factors. In 2025, gold has shone as a "non-digital" hedge against fiat currency devaluation and global uncertainties. Macroeconomic Factors: The Fed's two rate cuts in 2025, inflation remaining around 3%, and the weakening of the US dollar (DXY index decline) make gold attractive. Stagflation risks (980,000 job losses) and the forecast of GDP growth dropping to 0.25% are boosting safe-haven demand. Geopolitical Effects: US-China tensions, Middle East conflicts, and trade wars are pumping up gold demand. BRICS countries increasing their gold reserves (ongoing purchases by PBOC) support the price. Central Bank Purchases: The estimate of 900 tons of gold purchases in 2025 is tightening supply. Mining supply is limited (all mines could close by 2035), fueling the long-term rise. Sectoral Dynamics: Gold miners are generating cash flow, but while oil dropping below $58 reduces costs, overall inflation pressure continues. Fundamental factors indicate that the bull market will extend into 2026; however, strong US data or dollar recovery could slow the rally. Prediction and Trading Strategy Short-Term (October-November 2025): Upside after correction; target $4,500–$4,700. Buying opportunity at $4,100 during dips. Medium-Term (End of 2025 - Early 2026): Movement toward $5,000; in an aggressive scenario (geopolitical escalation) up to $6,000. Risks: If RSI exceeds 70, overbought sell-off; stop-loss below $4,000. Trading Suggestion: Wait for $4,200 support for long positions; watch for $4,175 breakdown for shorts. Add gold miners (ETFs) to the portfolio. This idea is based on current market data and is not investment advice. Follow the markets and do your own research! Looking forward to your comments.
islemodasi
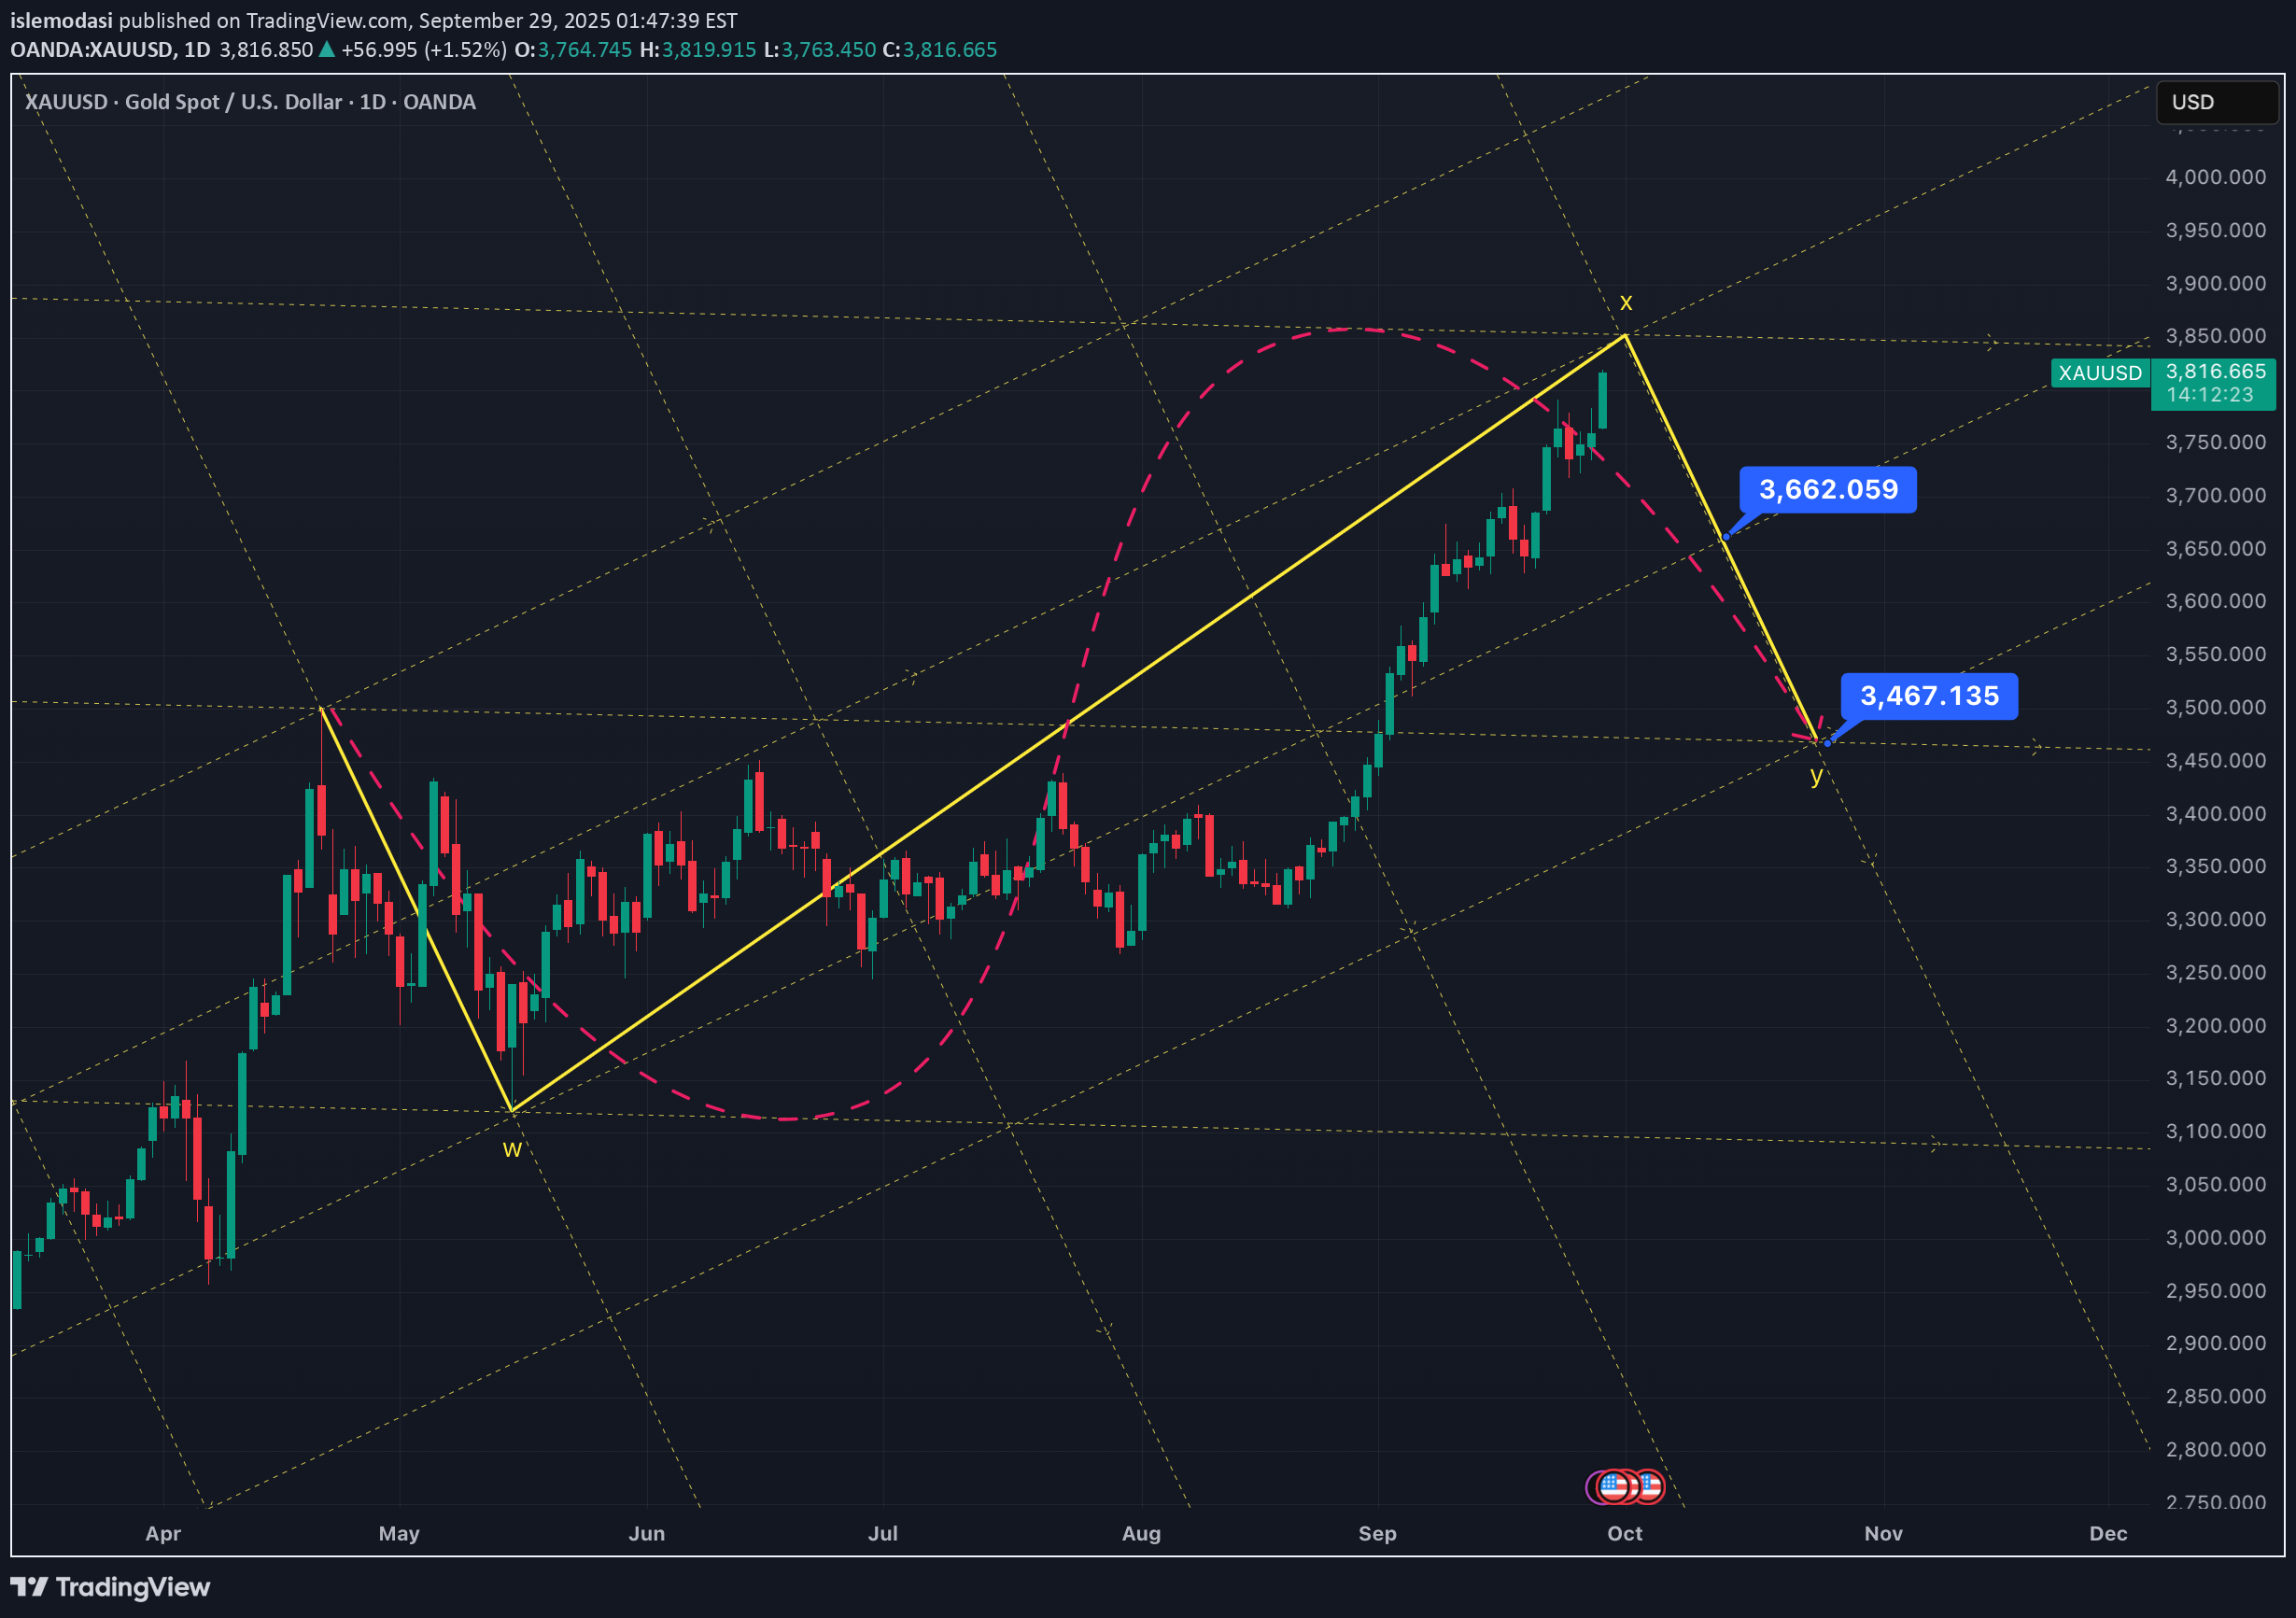
خرید طلا (XAUUSD) از سطوح کلیدی: استراتژیهای معاملاتی سودآور
XAUUSD Long From Levels .. ... .... ..... ...... XAUUSD Long From Levels .. ... .... ..... ......
islemodasi
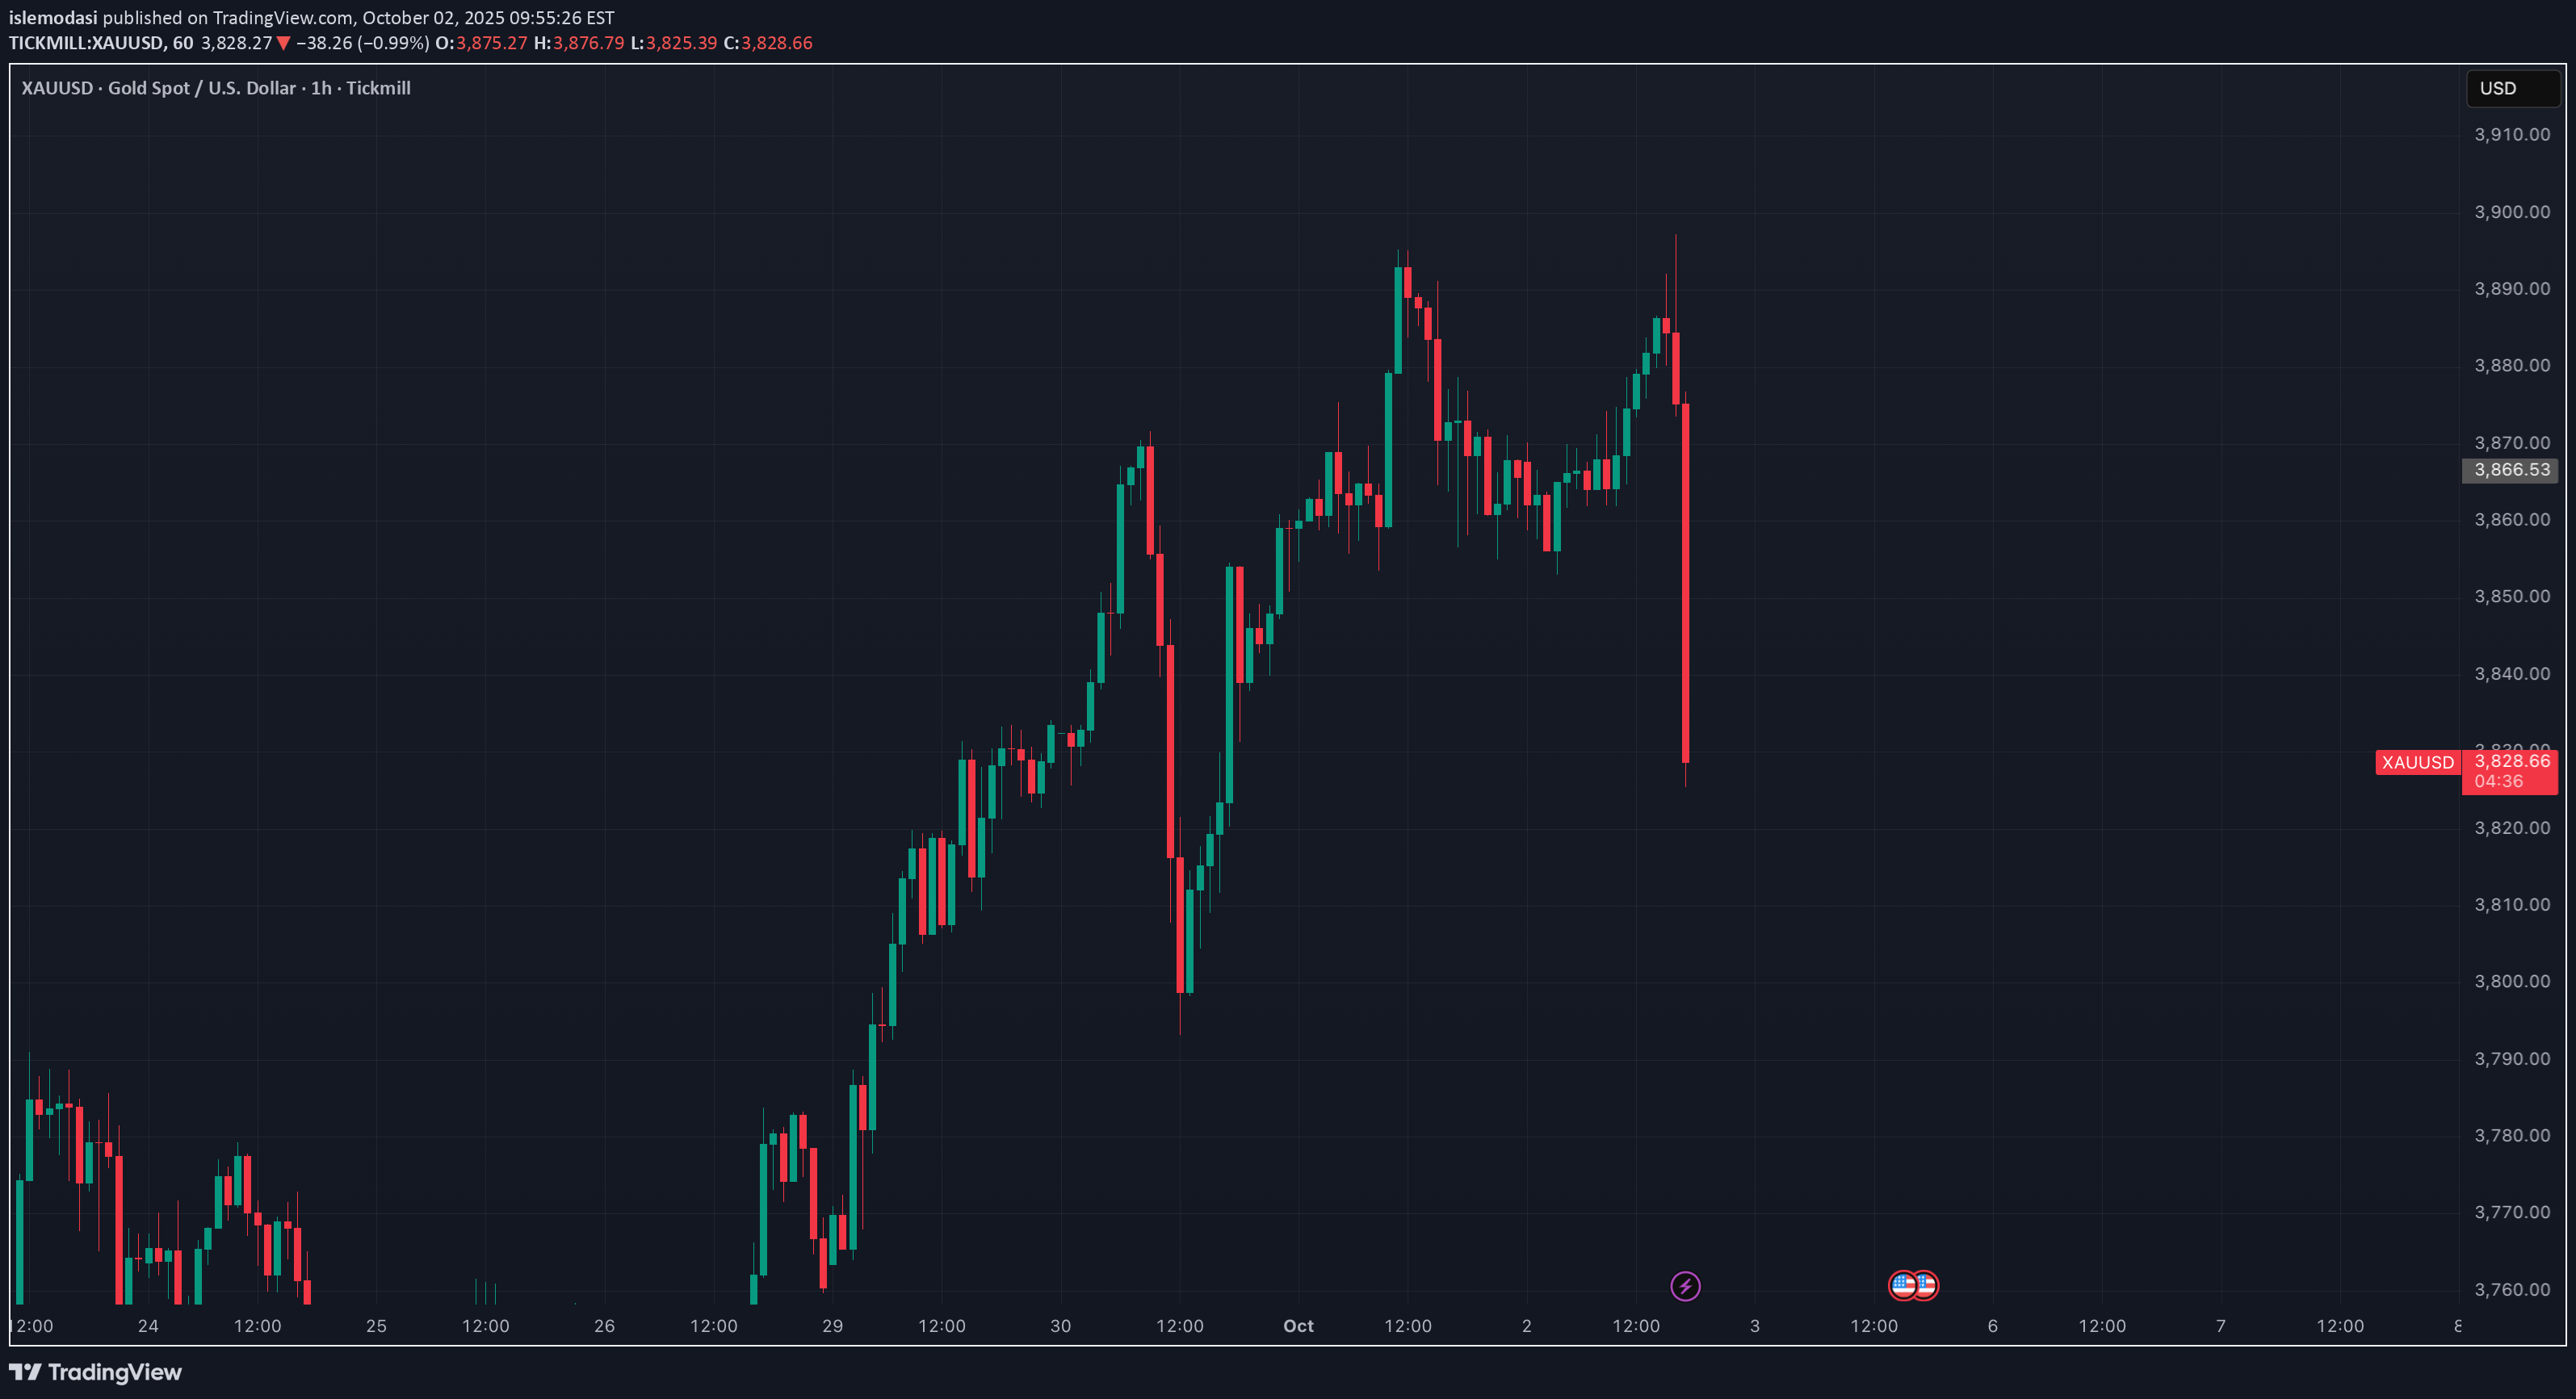
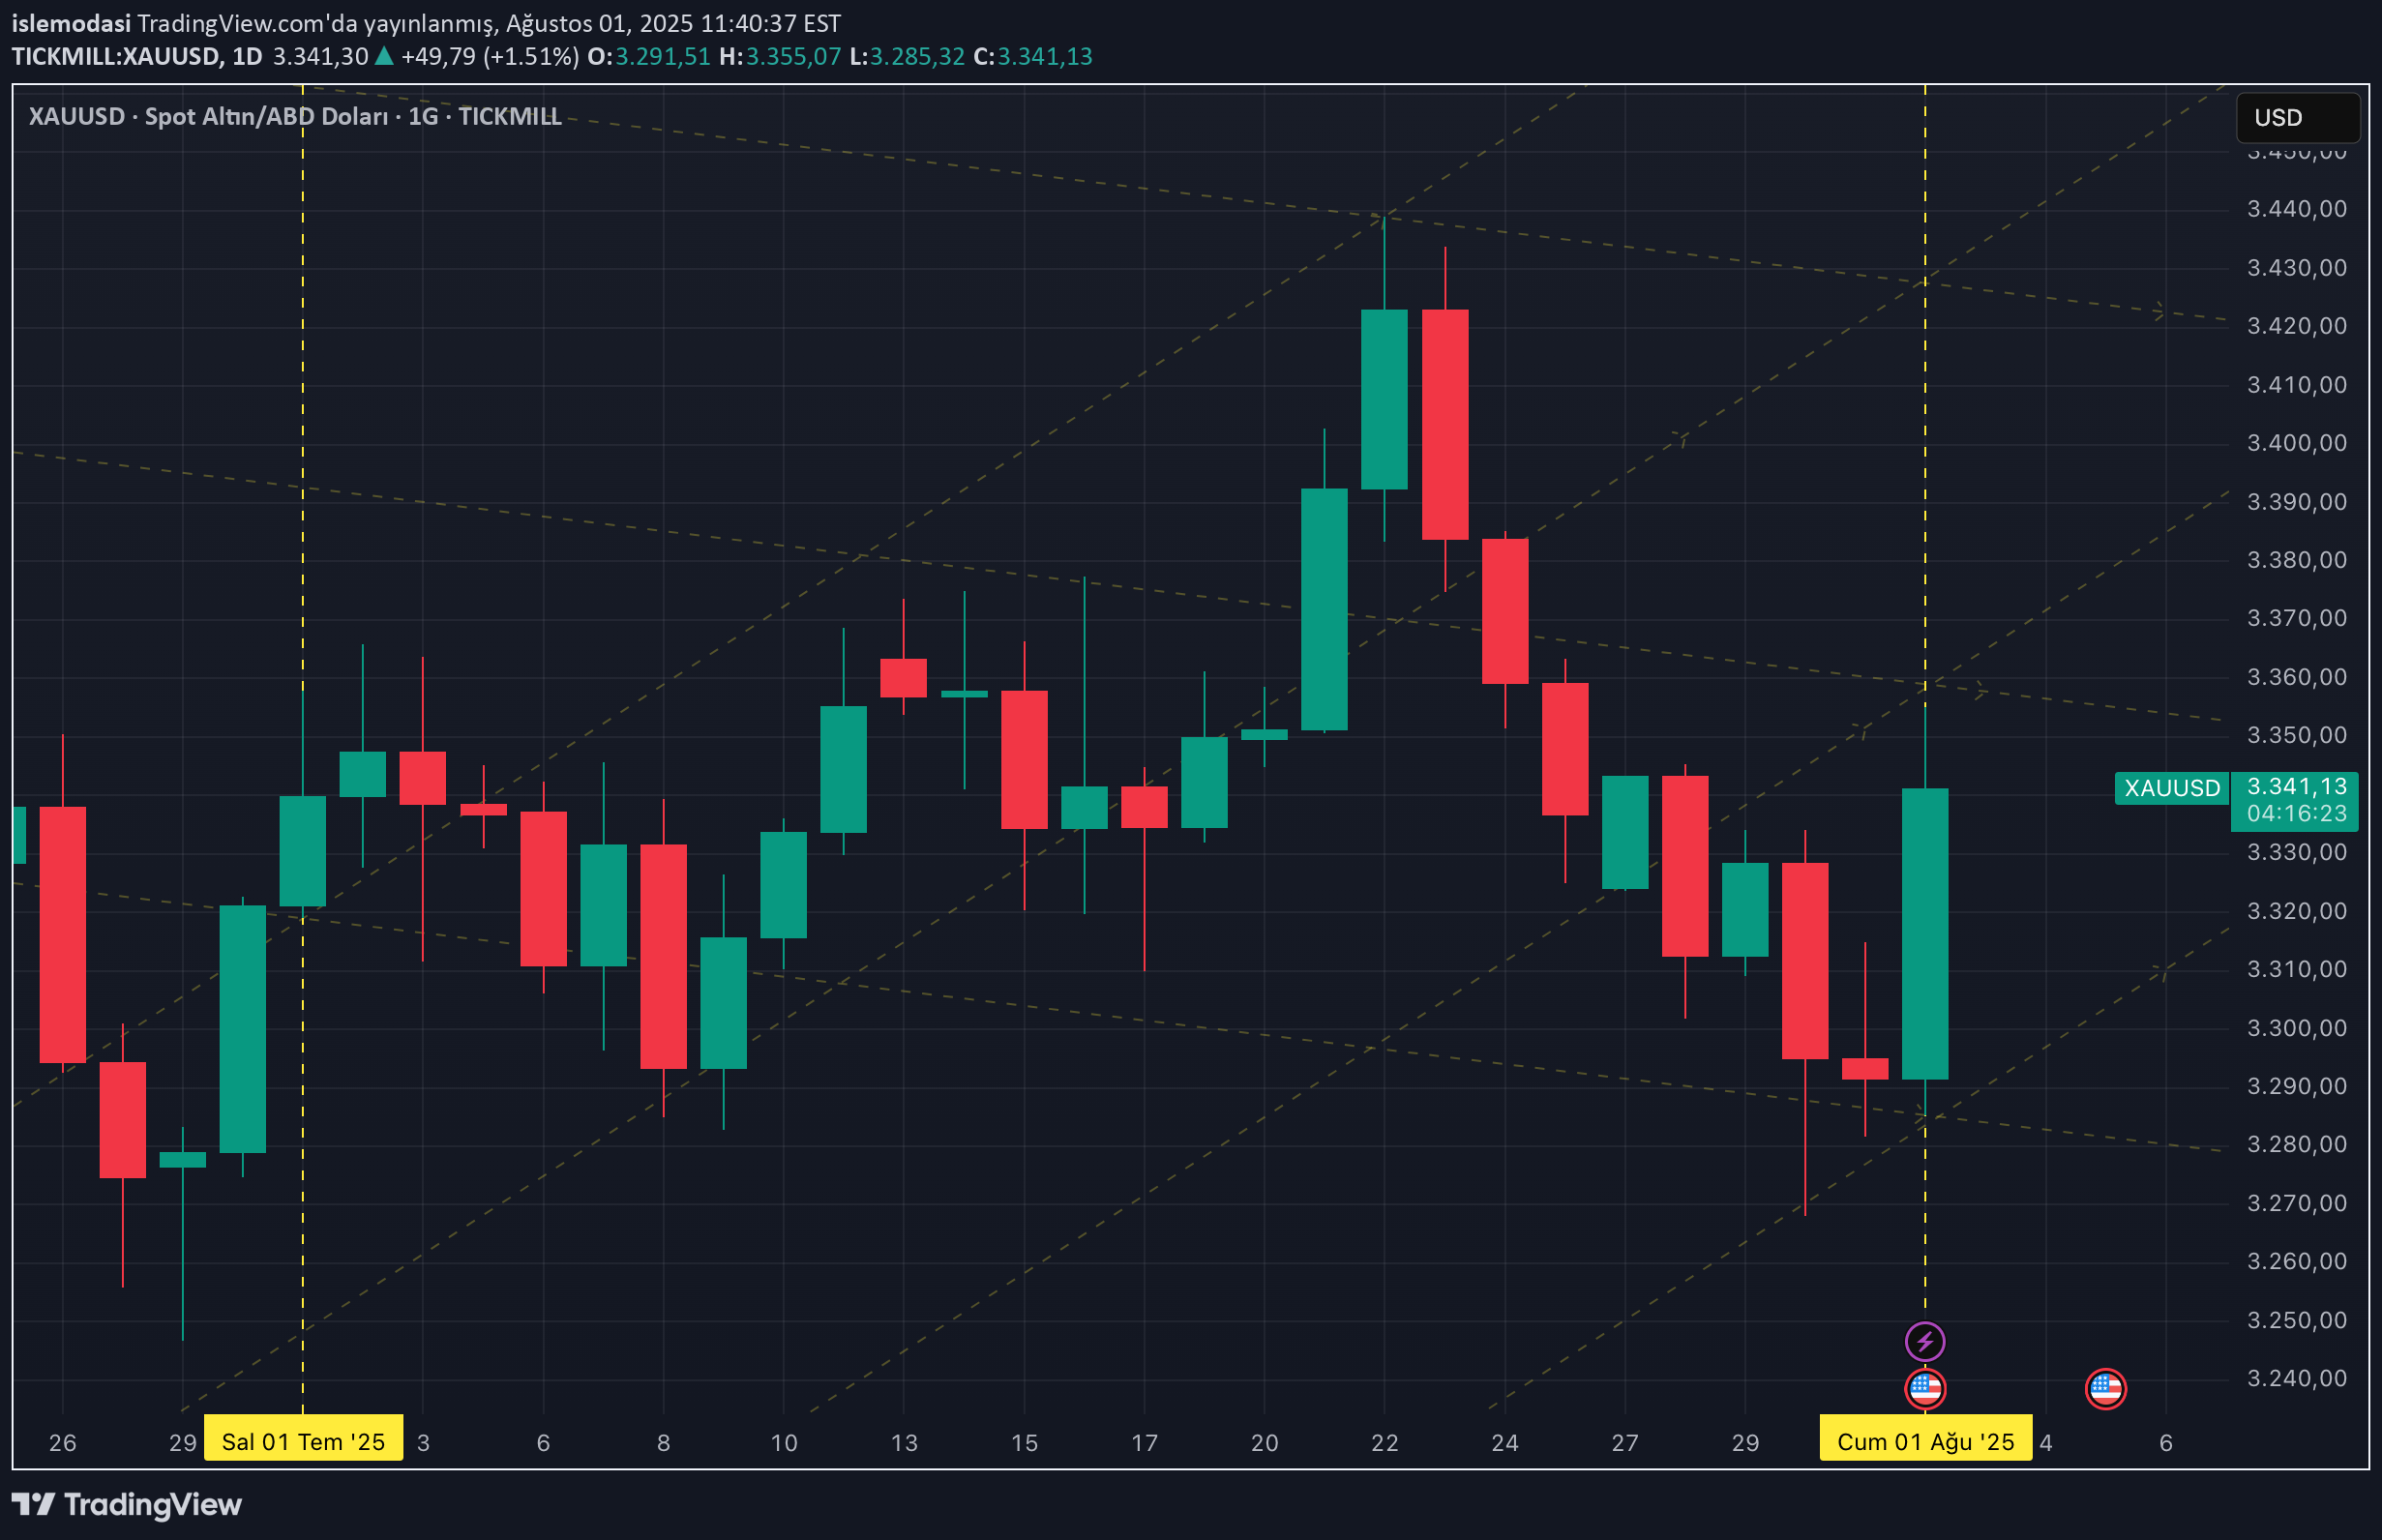
XAUUSD — Base Analysis (D1 focus)
Market State Range: Upper band at fresh highs; prior sideways box ~3,450–3,350 → breakout above Slope: Uptrend (strong) Base Bias: Upside continuation even with pullbacks; first, expect the ~3,700 area to hold Key Levels Resistance: 3,820 → 3,900 → 4,000 (psychological) Support: 3,700–3,680 (breakout base) → 3,600 → 3,520–3,480 → 3,420–3,350 (old box top/bottom) Decision Rules (plain) D1 close above 3,700 and retest holds ⇒ Upside scenario active Targets: 3,820 → 3,900 → 4,000 D1 close below 3,700 ⇒ Correction scenario active Targets: 3,600 → 3,520–3,480 → 3,420–3,350 Working Note This is a technical price-structure read; for entries, seek break + retest confirmation on H4/M15. The base bias weakens with sustained trade below 3,700 and subsequent loss of 3,600; it re-strengthens on a D1 close back above 3,820.
islemodasi
BTCUSD — Base Analysis (D1 focus)
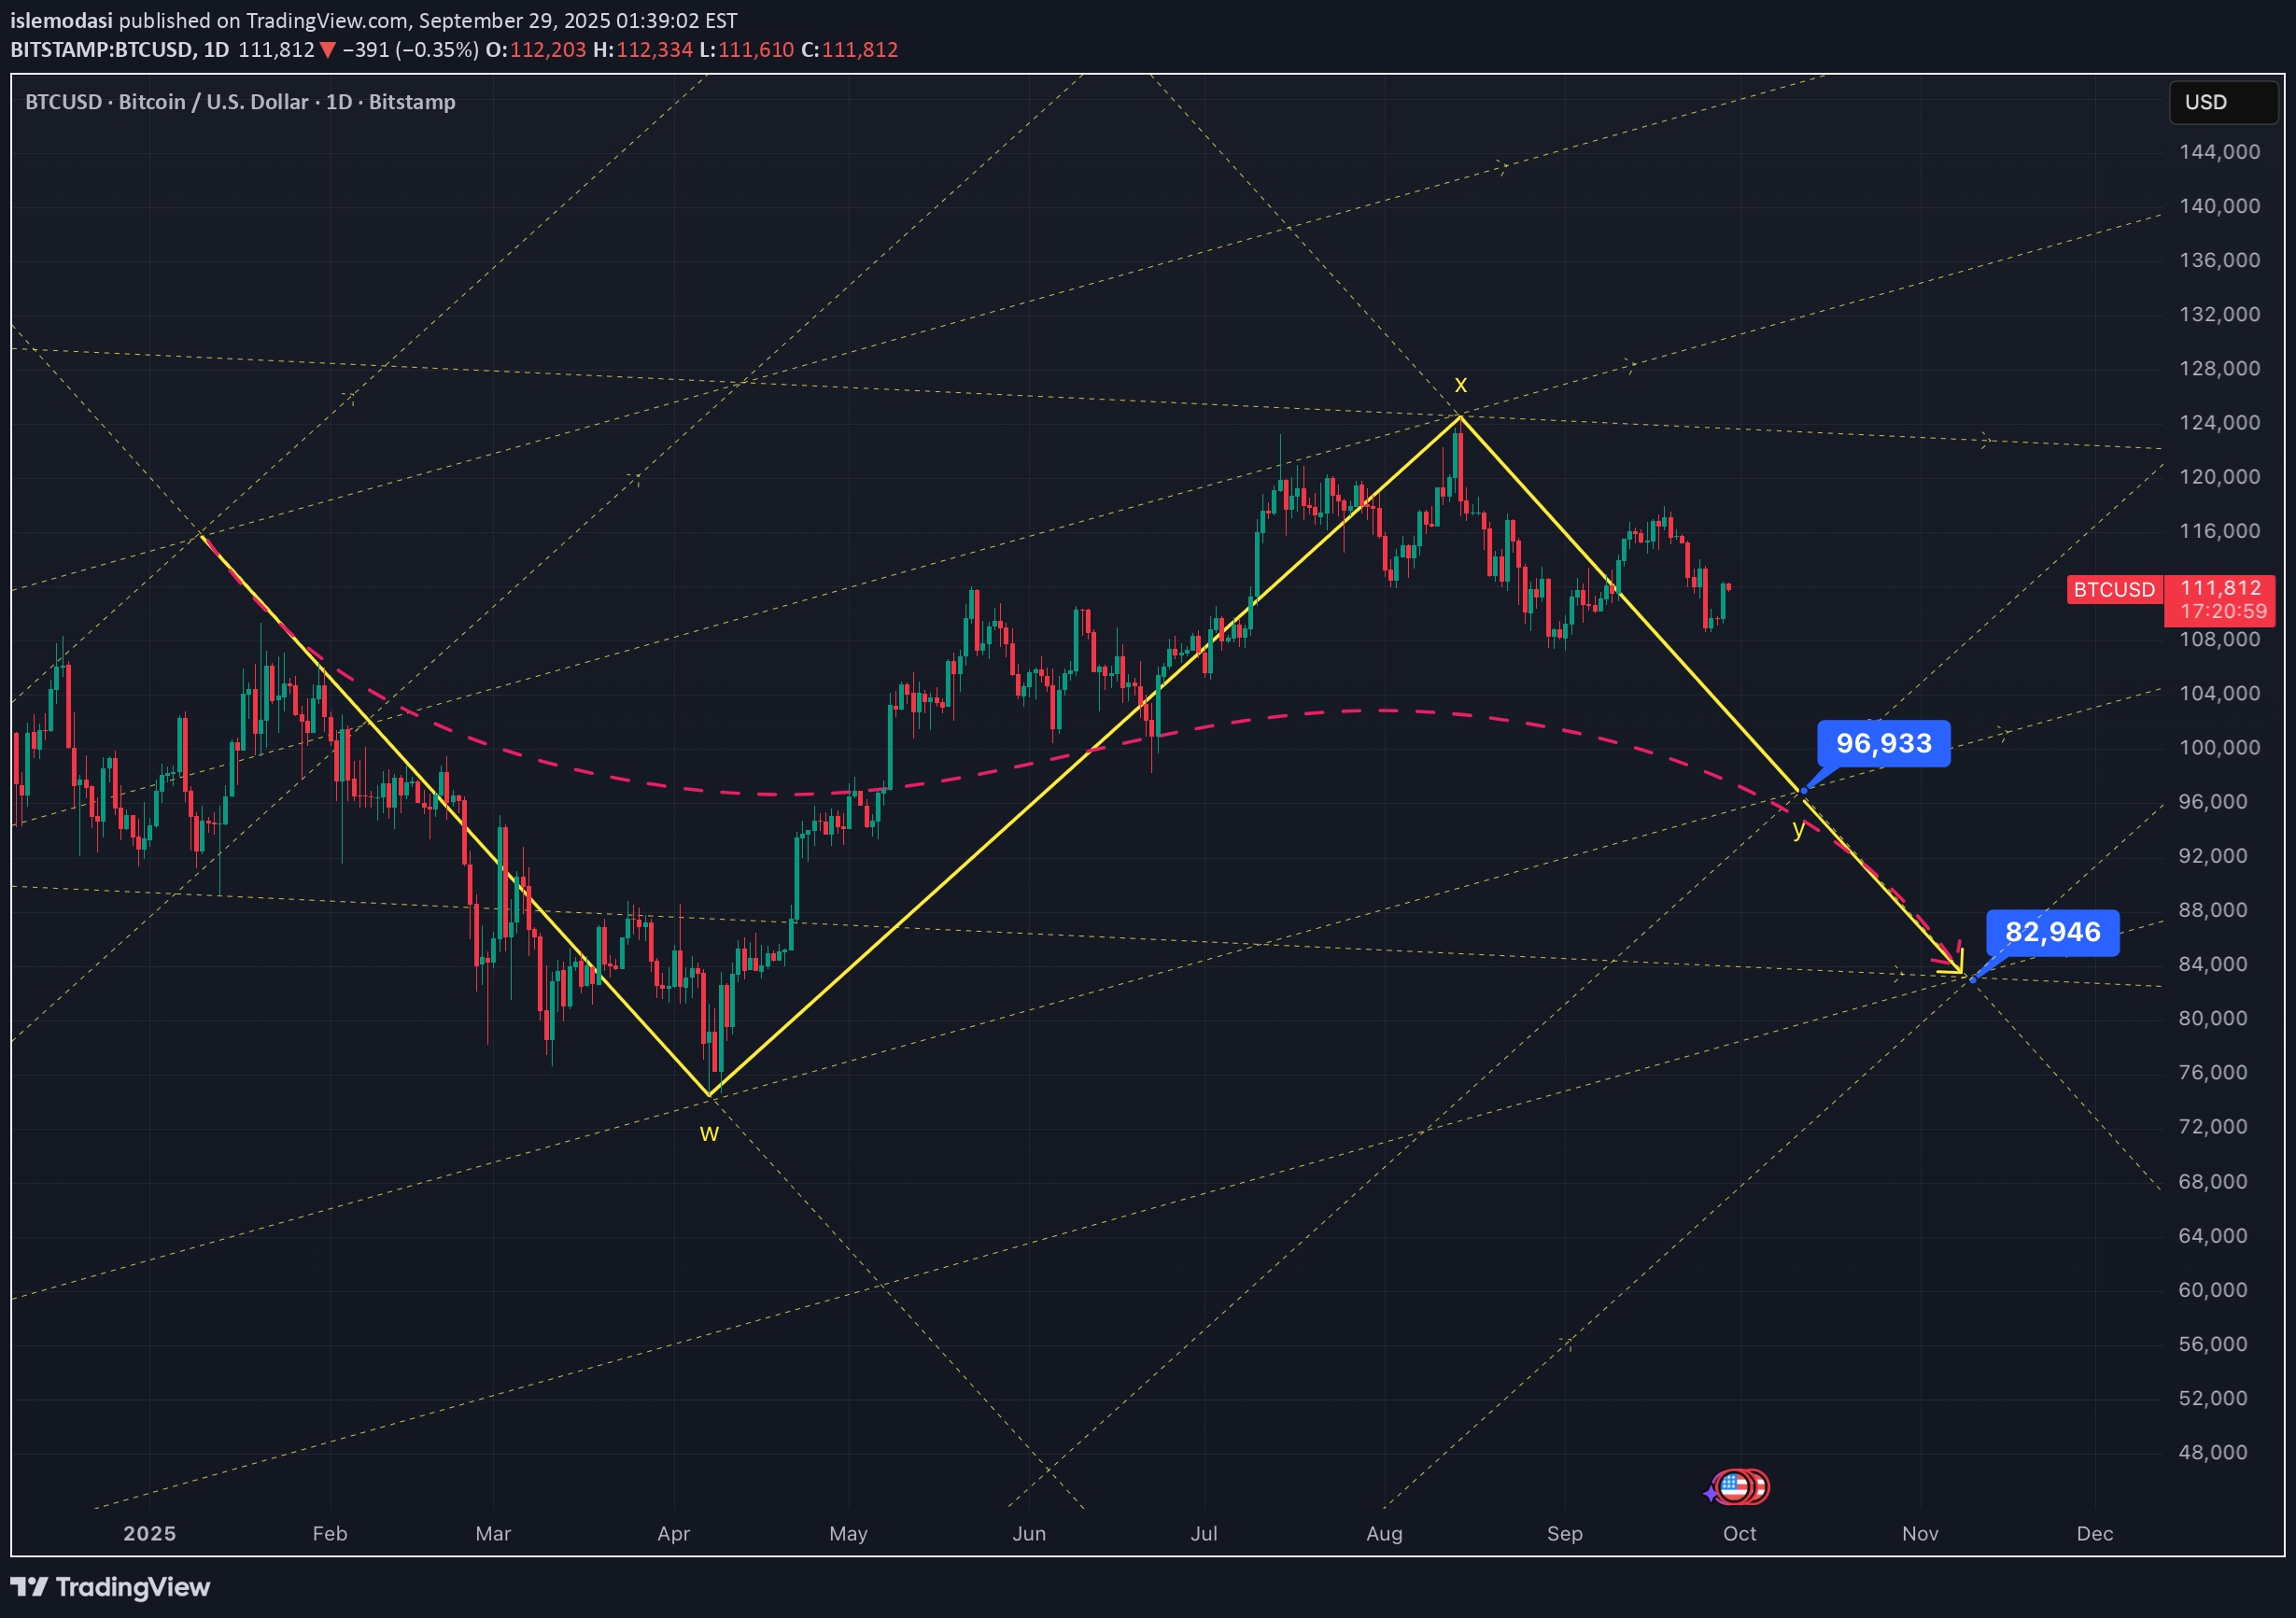
BTCUSD — Base Analysis (D1 focus) Market State Range: 116.5–118k (top) ↔ 110k (bottom) Slope: Slightly downward Base Bias: Higher probability of a sweep below 110k first Key Levels Resistance: 116.5–118k → 120k → 124k Support: 110k → 107–105k → 102k → 100k Decision Rules (plain) H4/D1 close below 110k ⇒ Downside scenario Targets: 107–105k → 102k → 100k H4/D1 close above 116.5k ⇒ Upside scenario Targets: 120k → 124k Working Note This is a technical price-structure read; seek break + retest confirmation on H4/M15 for entries. The base bias invalidates with a sustained close above 116.5k.
islemodasi
XAUUSD Temmuz Ayı İşlemlerim ve Kar Oranlarım
Investin Hub Telegram group is attached to all my XAUUSD transactions.
islemodasi
🇹🇷 “Türkiye'den Dubai’ye Neden Taşındım?”

🇹🇷 "چرا از ترکیه به دبی نقل مکان کردم؟" در سالهای اخیر، احساس کردم سرمایهگذاری در ترکیه بهطور فزایندهای دشوارتر، نامشخصتر و ناامیدکنندهتر شده است. در حالی که با تورم دست و پنجه نرم میکردم، این را به وضوح متوجه شدم: سیستم از سرمایهگذار محافظت نمیکند. بیصدا او را مصرف میکند. من یک اقتصاددان هستم. سالهاست که مدیریت پورتفوی و مشاوره سرمایهگذاری انجام دادهام. و این را خیلی واضح میگویم: 📉 "در ترکیه، سیستم برای سرمایهگذار کار نمیکند، بلکه برای خود سیستم کار میکند." به همین دلیل به دبی نقل مکان کردم. من نه تنها برای زندگی، بلکه برای ایجاد یک سیستم سرمایهگذاری به اینجا آمدهام. با ارزیابی ۲ ماه گذشتهای که در اینجا گذراندهام؛ 📌 هر روز بهتر درک میکنم که چه تصمیم درستی گرفتهام. 🧭 "در دبی چه کار میکنم؟" اولین کار من پس از ورود به دبی این بود: 👉 درک نحوه کار سیستم. بله، املاک و مستغلات هنوز یک حوزه قوی است. اما خیلی سریع متوجه شدم که فرصت اصلی آنجا نیست. 📍 برخی از زمینههایی که امروز میتوان در دبی سرمایهگذاری کرد: ✅ سهام معامله شده در DFM و Nasdaq Dubai ✅ REITها – صندوقهای سرمایهگذاری املاک و مستغلات معامله شده در بورس ✅ صکوک – محصولات مالی منطبق با شریعت برای افراد حساس به ربا ✅ صندوقها – مدیریت پورتفوی متنوع و متمرکز بر سود سهام ✅ DIFC – یک اکوسیستم مالی شفاف، قانونمند و دارای مزایای مالیاتی من هم در این زمینهها شروع به گرفتن موقعیتهای خود کردهام و هم در حال برنامهریزی ساختاری هستم که پلی برای سرمایهگذاران در ترکیه باشد. 🎯 "خب، هدفم چیست؟" خیلی واضح بگویم: 💼 من فقط برای خرید آپارتمان به دبی نیامدهام. من به دبی آمدهام تا یک سیستم ایجاد کنم، یک ساختار برنده ایجاد کنم. برنامهام هم آماده است: 🎯 ۱. شرکت سرمایهگذاری خودم را در اینجا توسعه دهم، خدمات مشاورهای خود را به یک ساختار سازمانی منتقل کنم. 🎯 ۲. سیستم مالی دبی را به شکلی ساده و واضح برای سرمایهگذاران فعلی و جدیدم در ترکیه توضیح دهم. 🎯 ۳. به کسانی که میخواهند پورتفوی خود را به دبی منتقل کنند راهنمایی کنم و همراه آنها باشم. درآمدی که امروز به دست میآورم، سرمایهای که محافظت میکنم و چشماندازی که میبینم… نه تنها برای من. برای هر کسی که میخواهد در این راه قدم بردارد میتواند باشد. 📍 سیستم آماده است. 📍 من آمادهام. اگر شما هم آماده هستید #دبی منتظر ماست. 💬 اگر شما هم در مورد این سیستم کنجکاو هستید، بیایید صحبت کنیم. 📞 واتساپ: +971 55 689 8446 🔗 wa.me/971556898446
islemodasi
BTCUSD 100.000USD

When we look at the chart, we see the last 24-hour performance of the BTC/USD pair. The price is showing a steady uptrend during the day and is currently trading at 89,161.9. A 1.38% increase reveals the dominance of market buyers. Technical Comment: Trend: There is an upward trend in price movements. The recovery that started at 86,876 has tested the intraday peak at 89,979. Resistance and Support: The intraday resistance level is formed around 89,979. If this level is exceeded, the upward momentum may accelerate. The support level of 86,876 should be considered. This level is one of the main areas where the price has recovered. Formation: The "Triangle" formation indicated on the Alt side indicates that the market is in a period of compression. Such formations generally signal a change in direction or the continuation of the current trend. Autochartist has defined a breakout signal. This indicates that the upward movement may continue.Short-Term Strategy:For Those Who Want to Take Positions: If we see a close above 89.979, short-term buy positions may be considered. The target may be 90.500 and above.Risk Management: Stop-loss should be kept slightly below the current support, for example at 86.500.General Comment:The market has a generally positive momentum. However, given the volatility, investors should be prepared for sudden price changes. Also, some selling pressure may be observed at major resistance levels, so careful monitoring is a must._____ISLEMODASI Portfolio Management Inc. | Official AnalysisThis analysis has been meticulously crafted by the ISLEMODASI Portfolio Management team.
islemodasi
XAU/USD’nin (altın/ABD doları) 2.700USD

This chart shows some notable technical signals regarding the short-term price movements of XAU/USD (gold/US dollar). Current Status and Trend: Gold appears to have entered a downward correction process after peaking at around 2742. This indicates that there may be a breakout or correction movement in the current trend. The chart indicates that the downward trend may continue to 2700.11. This level is probably the first support point to watch in the short term. Support and Resistance Levels: This move below 2742 may provide clues as to whether the downward trend will be a temporary correction or a more permanent trend. If the price tests the 2700 level and recovers from here, this level can be confirmed as a strong support point. However, if the 2700 level is broken, the market may enter a deeper correction process and gold prices may head lower. Technical Formations and Market Psychology: The curved yellow line on the chart shows the downtrend and the wave formed by price movements following the previous uptrend. Such trends may generally mean that the market is signaling a trend reversal. From a market psychology perspective, such corrections can often be linked to investors taking short-term profits. In addition, the desire of new buyers to buy at low levels may contribute to the price balancing at the 2700 level. Macroeconomic Dynamics: The price movements of gold are not limited to technical indicators; factors such as changes in the value of the US Dollar, inflation expectations and global market risk appetite are also among the main factors affecting the course of gold. If the US Dollar continues to gain value, this may put pressure on gold and facilitate a downward break of the 2700 level. Conversely, if risk appetite in global markets decreases or inflation expectations increase, gold prices may show a tendency to recover again. As a result, current indicators point to a short-term correction, but how market conditions and macroeconomic factors shape will be the ultimate determinant of whether gold can hold on to these support levels. In such volatile periods, trading with careful risk management will be an important strategic approach. XAU/USD (gold/US dollar) Our 2,700 USD Target Has Been Completed.
islemodasi
#TONUSDT Analizi: Pavel Durov'un Tutuklanması ve Gelecek Beklent

Toncoin (TON) Analysis: Pavel Durov's Arrest and Future ProspectsCurrent Status and Expectations:The status of a prominent figure like Pavel Durov could affect investor sentiment. However, since the technology and community behind TON Blockchain and TON Coin are strong, such events may have limited impact in the long term. The expectation that Durov will be released in the coming days could create a positive atmosphere in the markets, which could push TONUSDT to an upward movement.Support and Resistance Levels:Support Levels: According to the current market structure, there is a strong support level in the 5.20 - 5.50 regions. This level could be an area where buyers will step in during possible pullbacks.Resistance Levels: If the upward movement continues, the first resistance level seems to be 6.55. Above this level, the 8.05 level appears as an important target. Conclusion and Strategy: We predict that positive developments such as the release of Pavel Durov may have a positive impact on the market and an upward movement may occur in TONUSDT. In this scenario, breaking the 6.55 resistance may provide momentum towards the 8.05 target. However, it is important for investors to be careful and keep certain risk management strategies in place. It is recommended to determine stop-loss levels against possible volatility and closely monitor technical indicators. If developments support this expectation, TONUSDT is likely to reach the targeted levels in the coming days.
Disclaimer
Any content and materials included in Sahmeto's website and official communication channels are a compilation of personal opinions and analyses and are not binding. They do not constitute any recommendation for buying, selling, entering or exiting the stock market and cryptocurrency market. Also, all news and analyses included in the website and channels are merely republished information from official and unofficial domestic and foreign sources, and it is obvious that users of the said content are responsible for following up and ensuring the authenticity and accuracy of the materials. Therefore, while disclaiming responsibility, it is declared that the responsibility for any decision-making, action, and potential profit and loss in the capital market and cryptocurrency market lies with the trader.