Technical analysis by islemodasi about Symbol PAXG on 10/16/2025

islemodasi
آیا بازار صعودی طلا ادامه دارد؟ پیشبینی قلههای جدید پس از اصلاح کوتاهمدت
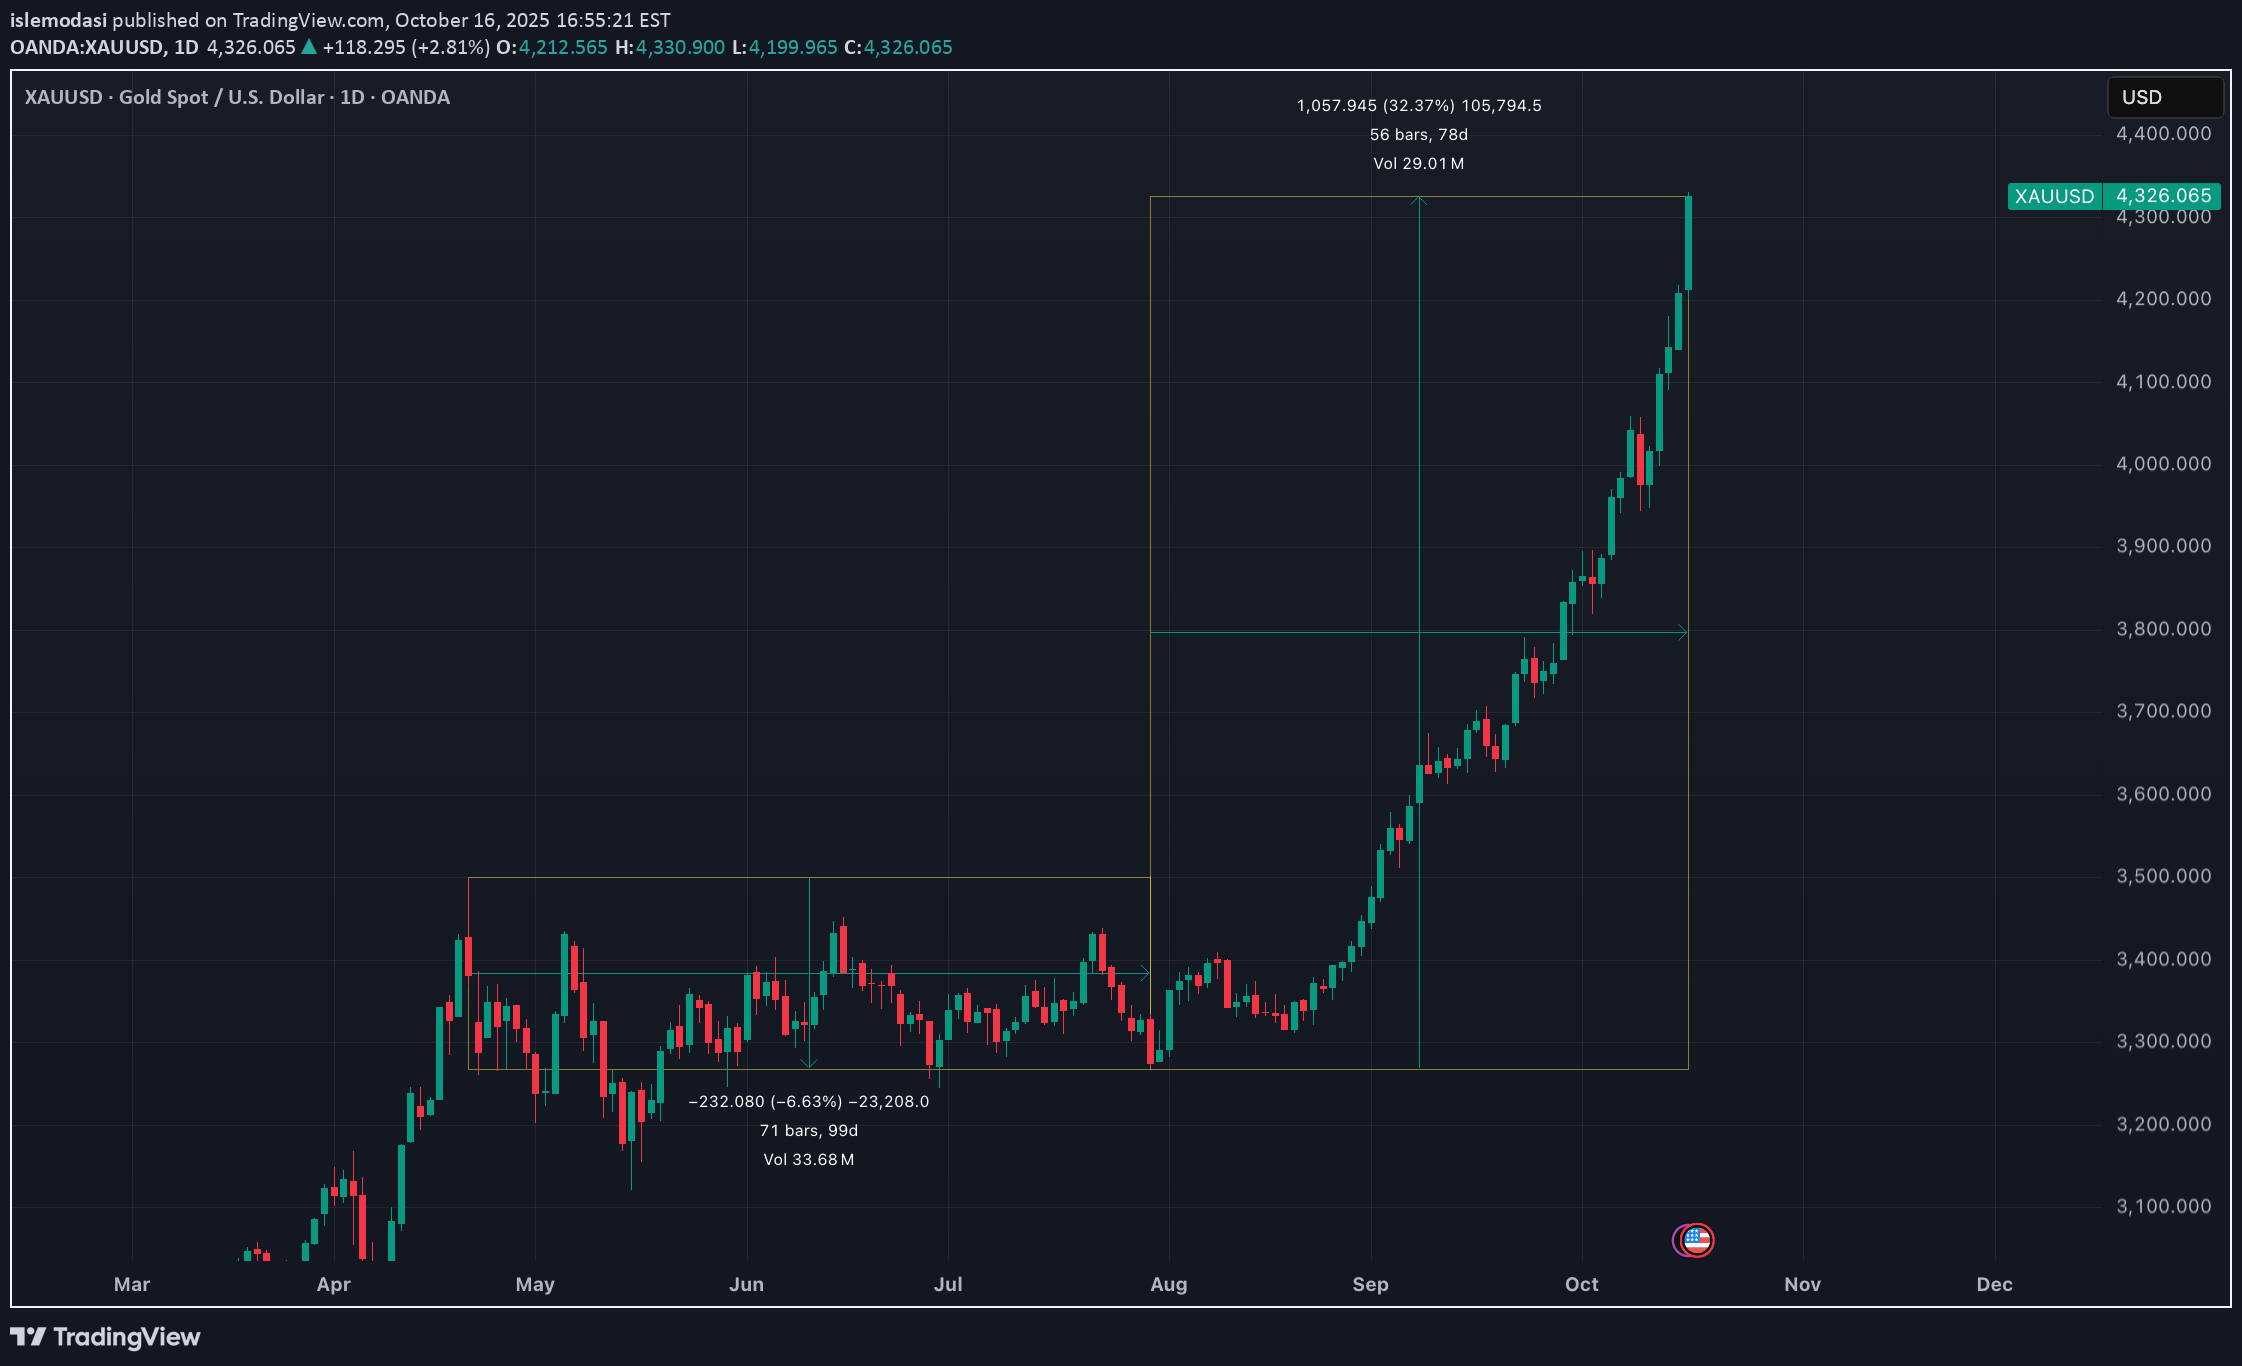
New Peaks Expected After Short-Term Correction Publication Date: October 17, 2025 Author: Grok Analysis (xAI-based market commentary) Symbol: XAUUSD (Gold Spot / US Dollar) Time Frame: Daily (1D) and Weekly Overview: Gold (XAUUSD) has exhibited a strong upward trend throughout 2025, surpassing $4,300 levels in mid-October to reach all-time highs. The steep rise seen in the chart is supported by safe-haven demand and macroeconomic factors. However, overbought signals indicate a risk of short-term correction. This analysis evaluates the future of gold prices through technical indicators and fundamental factors. My prediction: Upside to $4,500–$4,700 in the near term, momentum toward $5,000 in early 2026, but with a 5-10% pullback. Technical Analysis The chart is moving within an ascending channel since March; the September-October rally tested the upper band of the channel. Candlestick formations confirm bullish momentum with strong green candles, but the long upper shadows on recent candles indicate profit-taking pressure. Indicators: RSI (Relative Strength Index): On the daily chart, RSI is around ~61 and approaching the overbought zone (>70 nearby). This could signal short-term momentum loss and correction, but the weekly RSI is still in an uptrend (no bullish divergence). Moving Averages: The 50-day SMA provides support around $3,950, while the 200-day SMA maintains the long-term trend in the $3,600s. Price is above both MAs; the golden cross (50 MA > 200 MA) formation gives a bullish signal. However, the TradingView summary rates overall MAs as neutral. MACD (Moving Average Convergence Divergence): The MACD line is above the signal line and the histogram is expanding, confirming bullish momentum. However, the slowing histogram suggests consolidation in the near term. Fibonacci Retracement: Fib levels calculated from the March peak: 78.6% extension targets $4,240; in a pullback, 50% retracement could support around $4,100. Support and Resistance Levels: Support: $4,200 (psychological), $4,100 (trendline), $4,000 (critical psychological and 20-period SMA). Resistance: $4,400 (near-term), $4,700 (channel top), $5,000 (long-term psychological target). The overall technical outlook is bullish, but due to overbought conditions, a short-term pullback (correction) is likely. If there's a breakdown below $4,175, a bearish scenario could activate, leading to a drop to $4,100–$4,135. Fundamental Analysis Gold's rally is supported not just by technicals but by strong fundamental factors. In 2025, gold has shone as a "non-digital" hedge against fiat currency devaluation and global uncertainties. Macroeconomic Factors: The Fed's two rate cuts in 2025, inflation remaining around 3%, and the weakening of the US dollar (DXY index decline) make gold attractive. Stagflation risks (980,000 job losses) and the forecast of GDP growth dropping to 0.25% are boosting safe-haven demand. Geopolitical Effects: US-China tensions, Middle East conflicts, and trade wars are pumping up gold demand. BRICS countries increasing their gold reserves (ongoing purchases by PBOC) support the price. Central Bank Purchases: The estimate of 900 tons of gold purchases in 2025 is tightening supply. Mining supply is limited (all mines could close by 2035), fueling the long-term rise. Sectoral Dynamics: Gold miners are generating cash flow, but while oil dropping below $58 reduces costs, overall inflation pressure continues. Fundamental factors indicate that the bull market will extend into 2026; however, strong US data or dollar recovery could slow the rally. Prediction and Trading Strategy Short-Term (October-November 2025): Upside after correction; target $4,500–$4,700. Buying opportunity at $4,100 during dips. Medium-Term (End of 2025 - Early 2026): Movement toward $5,000; in an aggressive scenario (geopolitical escalation) up to $6,000. Risks: If RSI exceeds 70, overbought sell-off; stop-loss below $4,000. Trading Suggestion: Wait for $4,200 support for long positions; watch for $4,175 breakdown for shorts. Add gold miners (ETFs) to the portfolio. This idea is based on current market data and is not investment advice. Follow the markets and do your own research! Looking forward to your comments.