
impossiblebull
@t_impossiblebull

What symbols does the trader recommend buying?
Purchase History
پیام های تریدر
Filter
Signal Type
impossiblebull
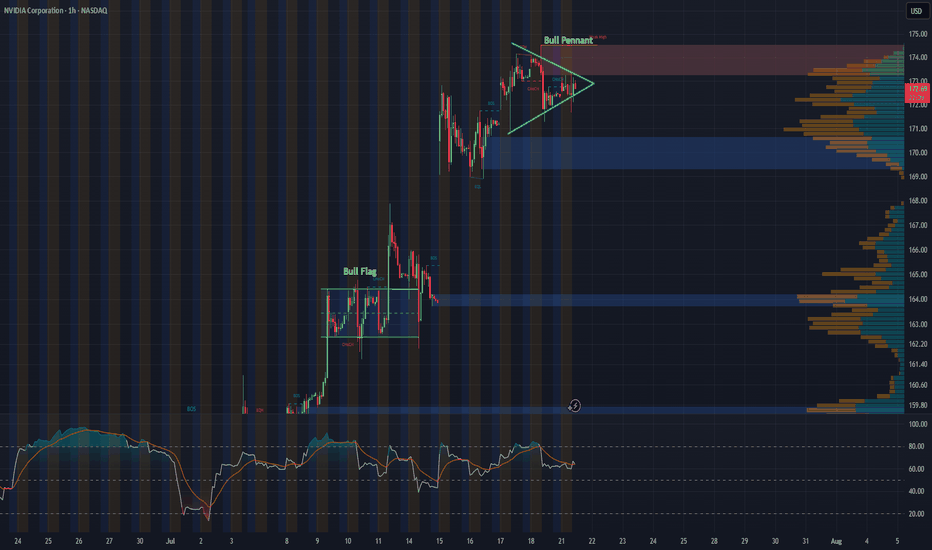
Hey everyone, just wanted to share a quick update on NVDA’s 1-hour chart. Following last week’s bull flag breakout, the stock appears to be consolidating into what looks like a solid bull pennant formation. With major tech earnings on the horizon and the recent approval to sell H20 chips to China, this pattern could be setting the stage for another breakout. Will NVDA continue its impressive rally, or is this just a breather before the next move?
impossiblebull
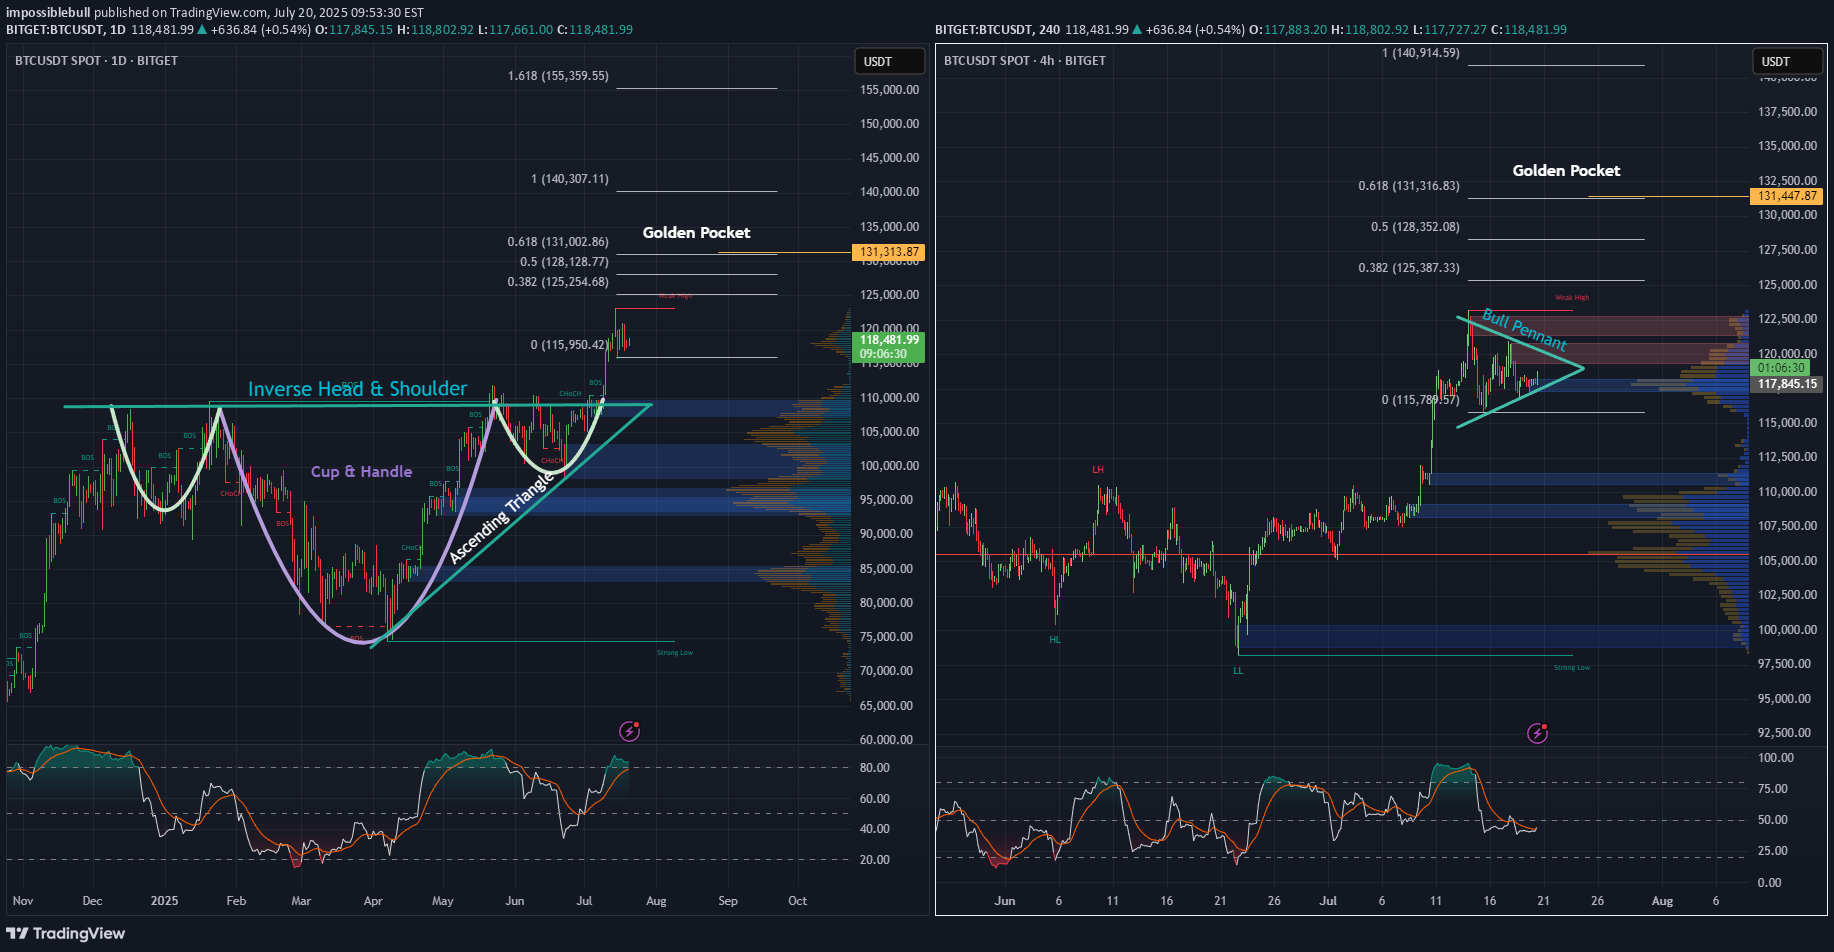
Looking at the Daily and 4-hour charts for BTC, we can see multiple bullish formations unfolding. An inverse head and shoulders - daily A cup and handle - daily An ascending triangle - daily Price action looks strong, as we’ve begun the breakout from the neckline on the inverse H&S, as well as the cup and handle and ascending triangle simultaneously, and momentum is building fast. Also, on the 4-hour chart, there’s a pretty substantial bull pennant taking shape. A breakout here could be the next leg up, and the push needed to keep momentum alive. Zooming out, when we apply the trend-based Fibonacci extension, it reveals a $131,000 golden pocket, on both the the daily as well as the 4 hr. And that could be a major upside target if these bullish structures hold. Stay tuned to see if BTC continues its move and sets a new all-time high.
impossiblebull
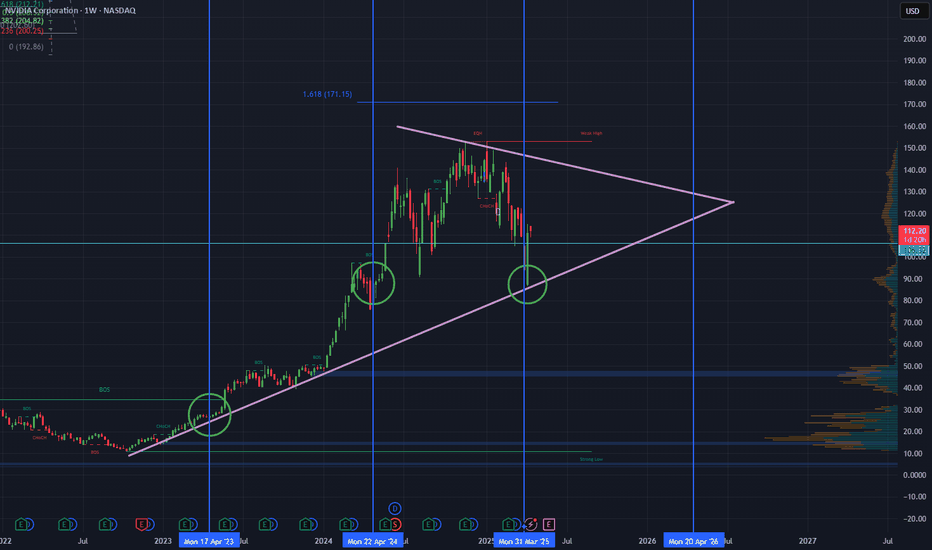
Looking at NVIDIA (NVDA) on the weekly chart over the past two years, a significant gap up becomes apparent around April, which persisted for much of the year. Considering the recent news and the stock's pullbacks lately, this may be the moment for NVDA to resume its upward grind. The coming weeks will reveal its direction. Additionally, it's worth noting the formation of a massive bull pennant on the weekly chart. If history repeats itself and this pattern holds, the next 2 to 6 weeks could prove to be a thrilling period for NVDA.
impossiblebull
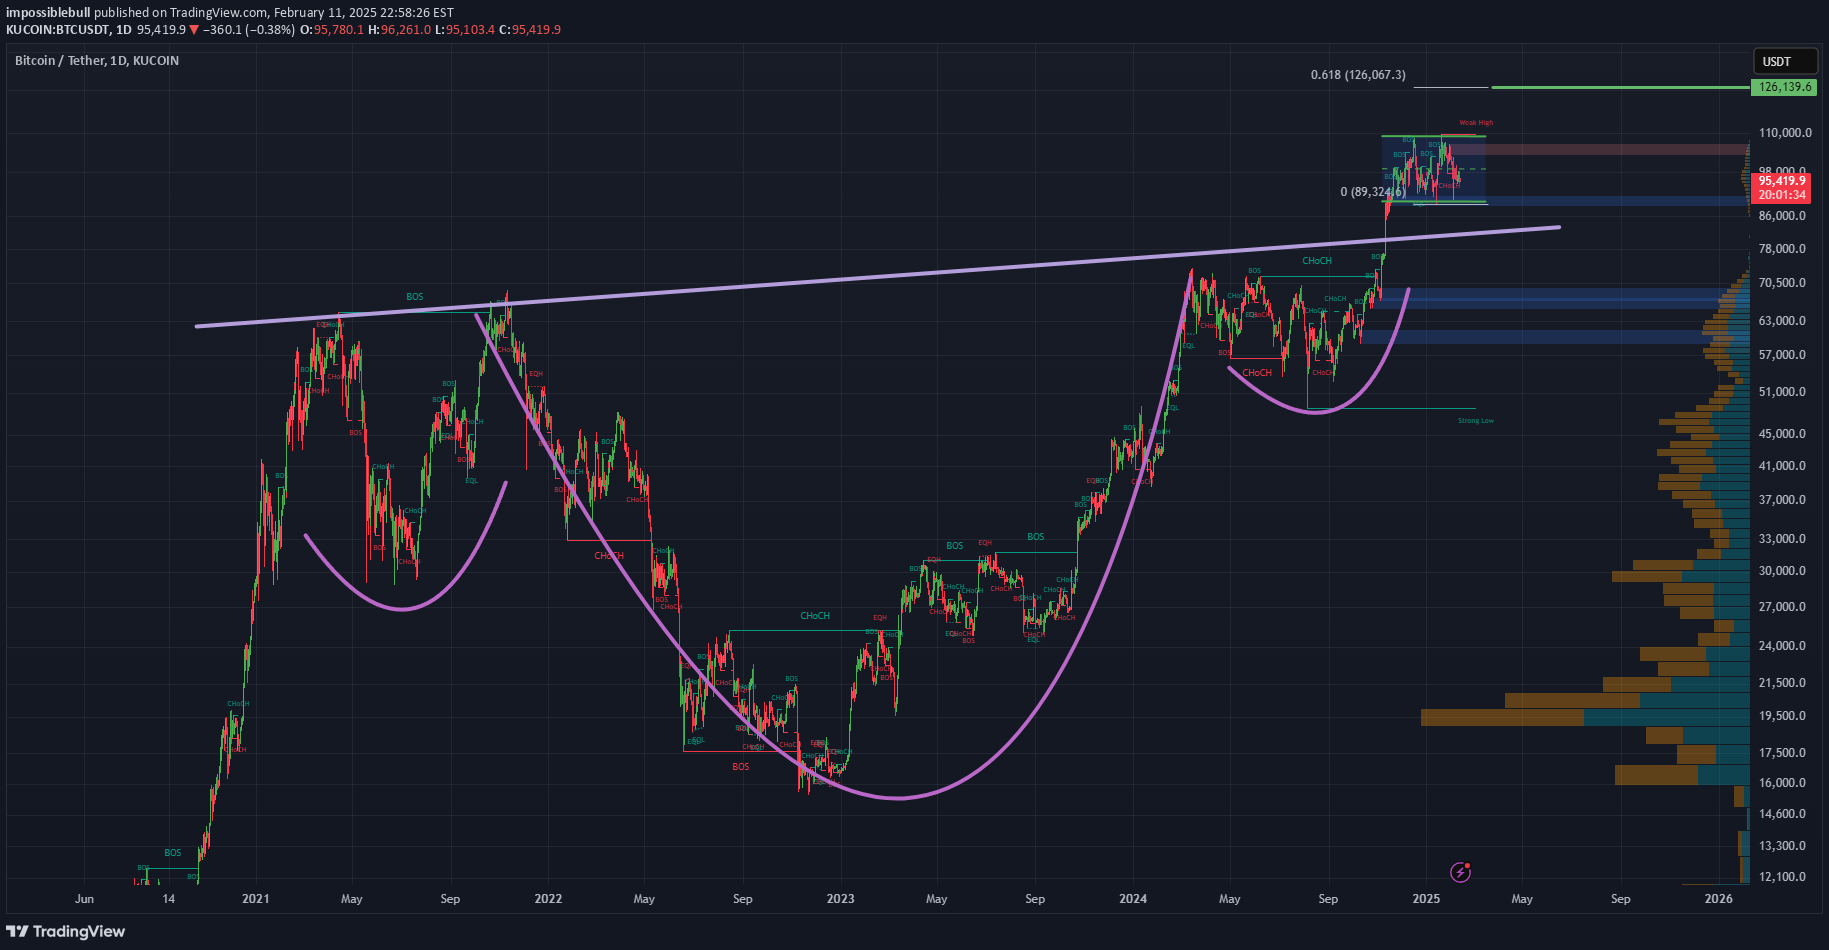
Bitcoin's recent price action has been nothing short of captivating for traders and analysts alike. On the daily chart, we've observed the formation of an Inverse Head & Shoulders and a Cup & Handle pattern, both of which have now transitioned into a Bull Flag. These bullish signals suggest a strong potential for upward movement. Zooming into the 4-hour and 1-hour charts, we can see prominent Ascending Triangles taking shape. These patterns are often harbingers of significant breakouts, and it appears that Bitcoin is winding up for a substantial move. Moreover, when utilizing a Trend-based Fibonacci Extension on the daily timeframe, the golden pocket points to a target of $126k, with the next pocket at $185k. This aligns with historical data and technical indicators, suggesting that Bitcoin might be poised to rewrite history once again. Stay tuned as we monitor these developments and anticipate what could be a historic breakout for Bitcoin!🎯
impossiblebull
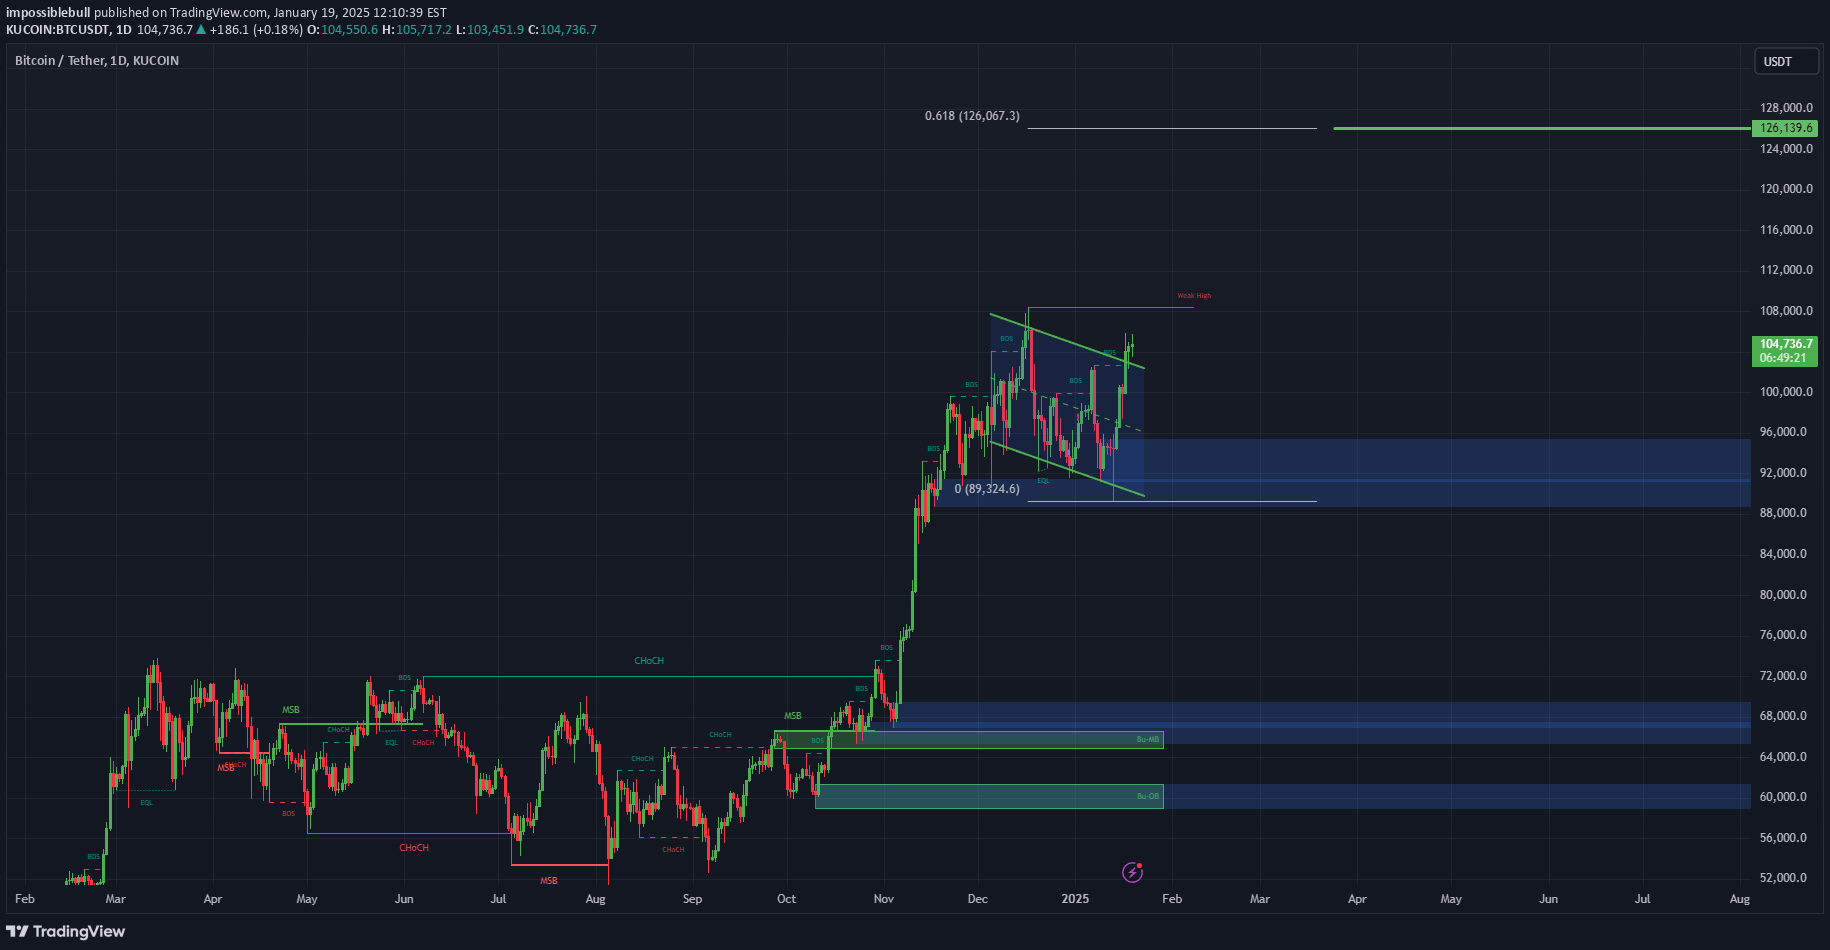
The cryptocurrency market is once again at the edge of a seismic shift. Following the recent uptrend, Bitcoin (BTC) has established a formidable Bull Flag on the daily chart. By utilizing a trend-based Fibonacci extension on top of the current Bull Flag, we can identify the coveted 'golden pocket' positioned at $126,000, with the subsequent target level at an impressive $185,000. If historical patterns hold true, this year is set to be another record-breaking period for Bitcoin and the broader crypto market. Investors and enthusiasts alike should prepare for a potentially parabolic movement. Fasten your seat belts, an exciting journey awaits.
impossiblebull

The breakout of this Bull Flag is going to bring BTC once again to heights we have yet to see. When we use a Trend Base Fib Ext, we can see the next Golden Pocket sitting up at $85.600. This is a continuation of the monster Cup & Handle we broke out from earlier this year.
impossiblebull
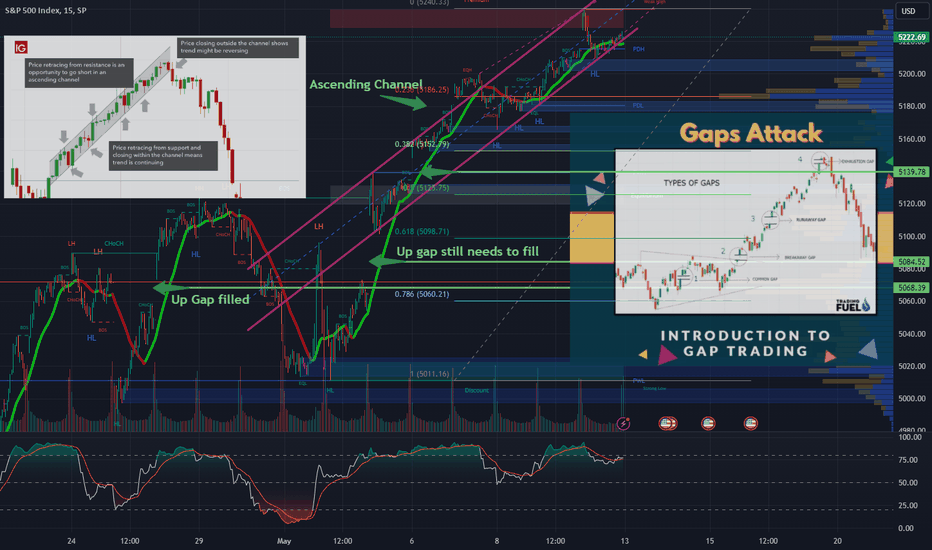
Taking a look at SPX on the 15, has 2 up gaps to fill and is nearing the top of this Ascending Channel. If it decides to break down, we could see a $100-120 gap down.
impossiblebull

impossiblebull

The 15 min is showing a text book bull pennant. Possible breakout.
impossiblebull

Pretty big cup and handle on the 1hr. A breakout out of the handle could bring 20s into BTCs near future
Disclaimer
Any content and materials included in Sahmeto's website and official communication channels are a compilation of personal opinions and analyses and are not binding. They do not constitute any recommendation for buying, selling, entering or exiting the stock market and cryptocurrency market. Also, all news and analyses included in the website and channels are merely republished information from official and unofficial domestic and foreign sources, and it is obvious that users of the said content are responsible for following up and ensuring the authenticity and accuracy of the materials. Therefore, while disclaiming responsibility, it is declared that the responsibility for any decision-making, action, and potential profit and loss in the capital market and cryptocurrency market lies with the trader.