
ijaz_crypto
@t_ijaz_crypto

What symbols does the trader recommend buying?
Purchase History
پیام های تریدر
Filter
ijaz_crypto
بیت کوین در نقطه حساس: صعود مجدد یا سقوط بزرگ؟
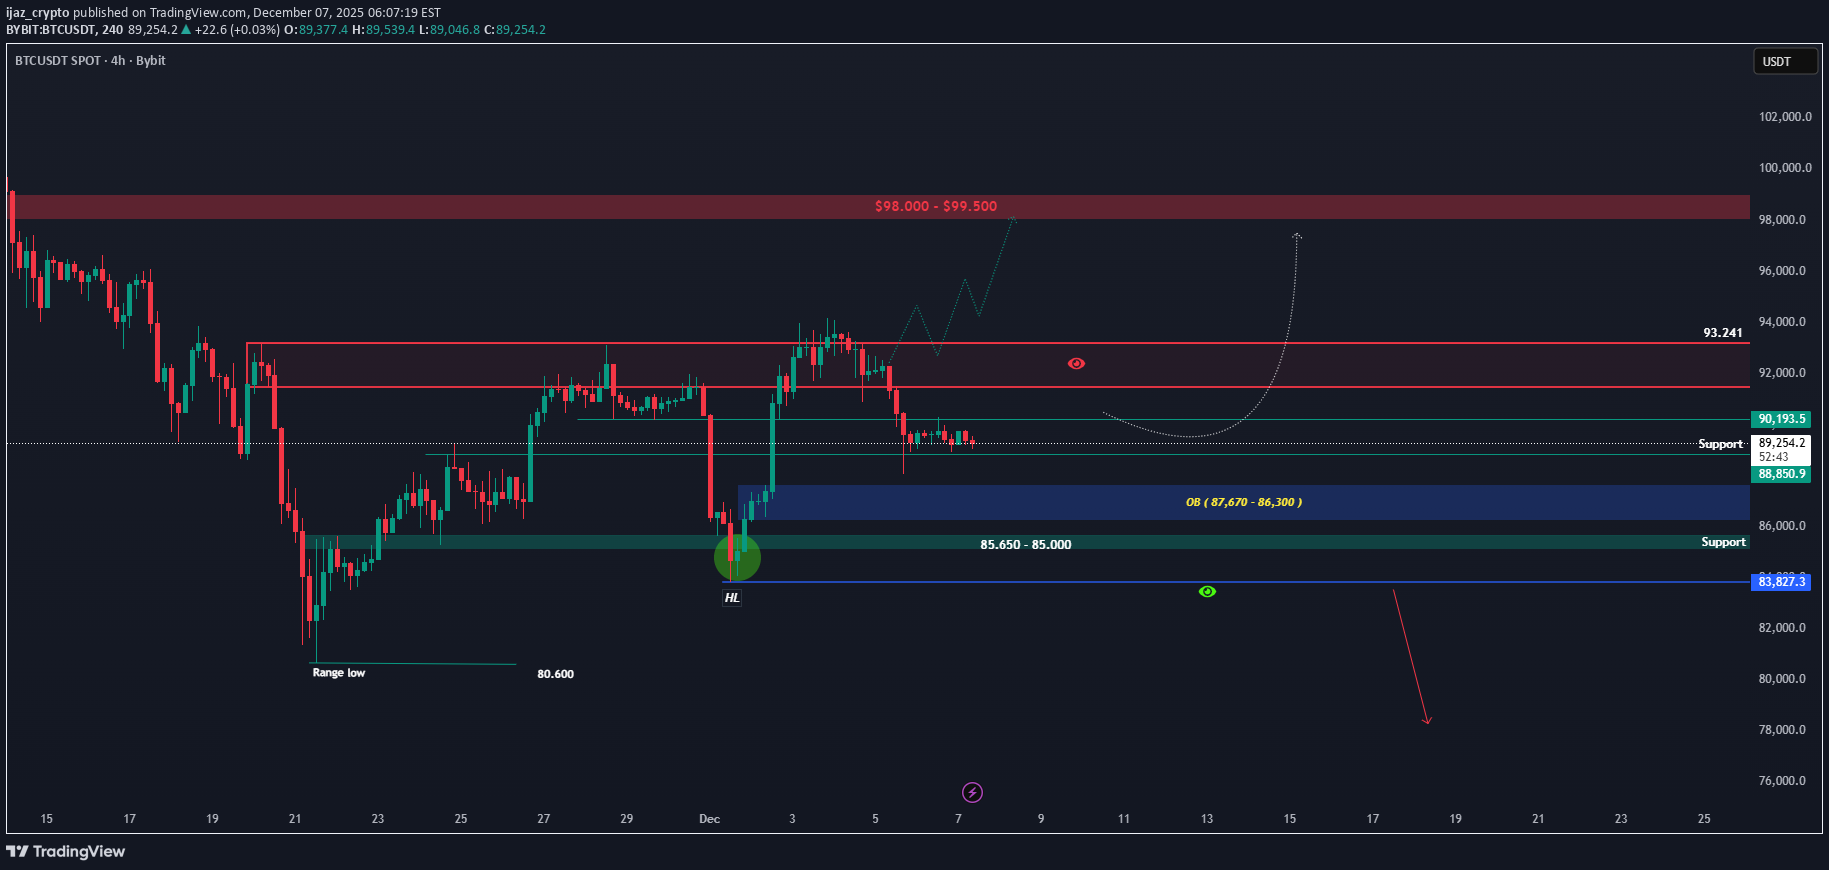
BTC 4H Update BTC is still moving in a controlled pullback after failing to break the 93,241 resistance. The rejection shows the market continues to respect this supply zone, and price is now hovering just above short-term support. The key area to watch is the 88,850–89,200 support zone. If BTC can hold this level, a rebound toward 90,193 is likely, followed by another attempt to break the major resistance. A successful breakout would open the path toward the 98k–99.5k zone shown on the chart. However, if this support breaks, price may slide into the OB 87,670–86,300 or even revisit the 85,650–85,000 support area — the same zone that created the recent higher low. Losing that level would weaken the bullish structure. For now, structure is still intact, and BTC just needs a clean bounce to maintain upward momentum.
ijaz_crypto
سقوط سوئی تمام شد؟ علائم ورود به موج صعودی بزرگ!
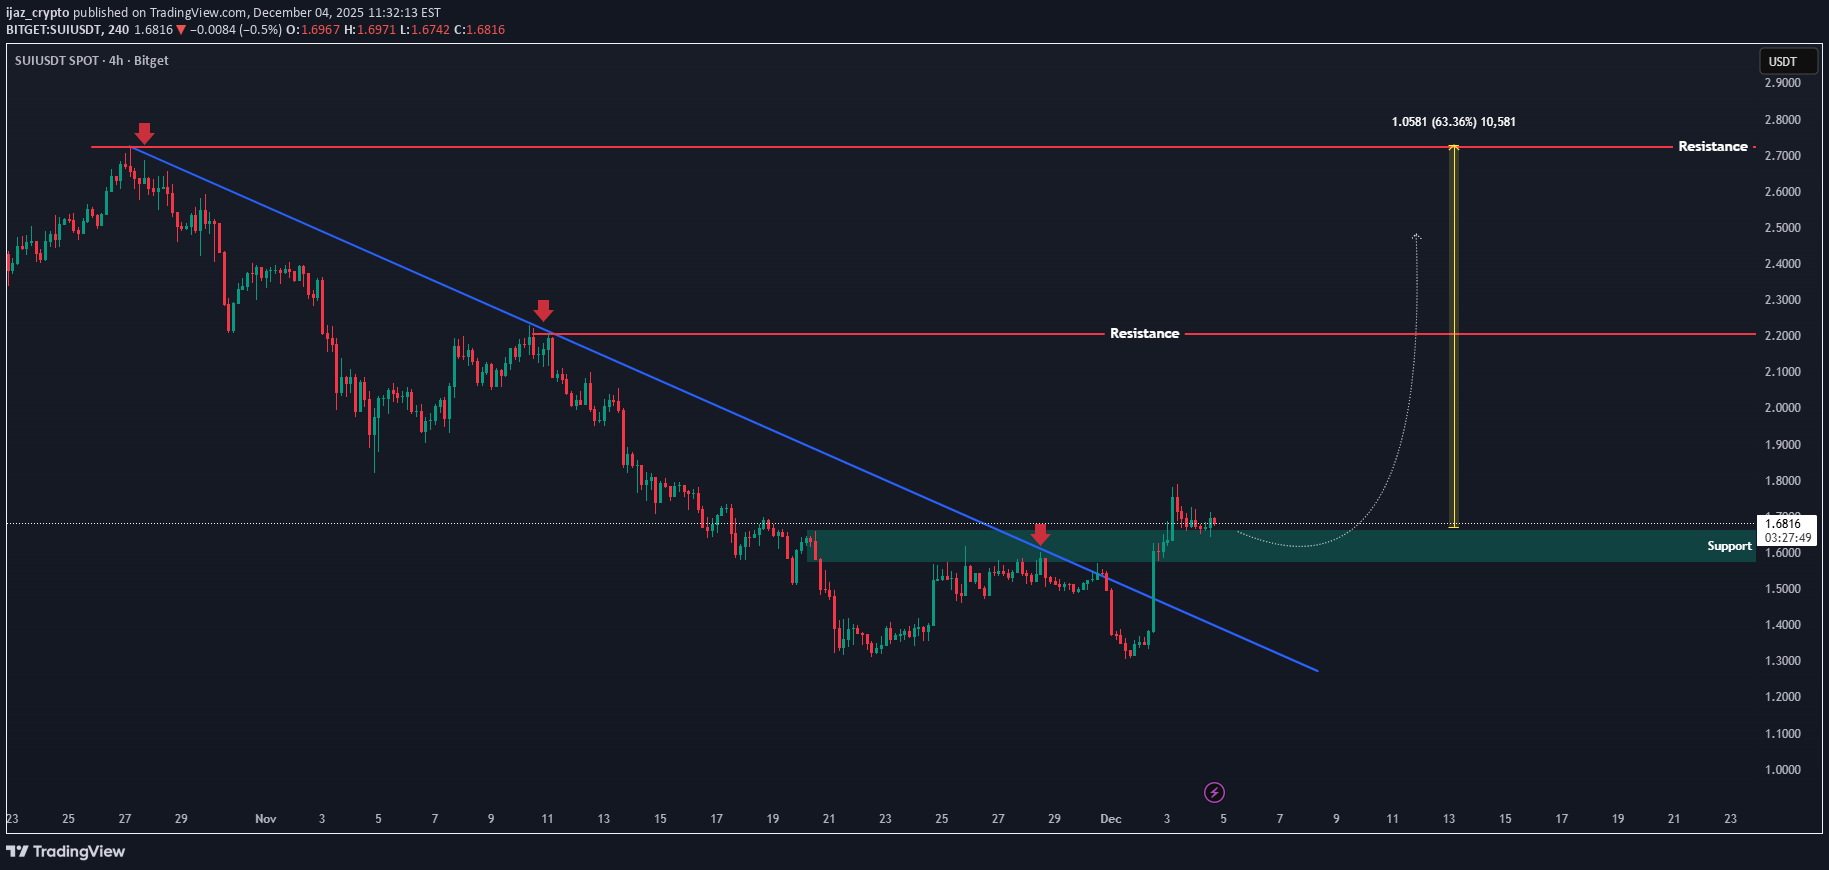
SUI has finally broken out from its extended downtrend, showing a clean breakout above the descending structure. Price is now retesting the previous rejection zone, which has flipped into an important support area after the breakout. If this retest holds, the chart suggests a potential continuation toward the next major resistance zone. The structure is showing early signs of a bullish reversal, with momentum beginning to shift to the upside. For now, the key focus is how price reacts at this reclaimed zone — a strong confirmation here could open the path for a larger move upward.
ijaz_crypto
اتریوم در آستانه یک جهش بزرگ: راز تغییر روند پنهان در قیمت ETH چیست؟
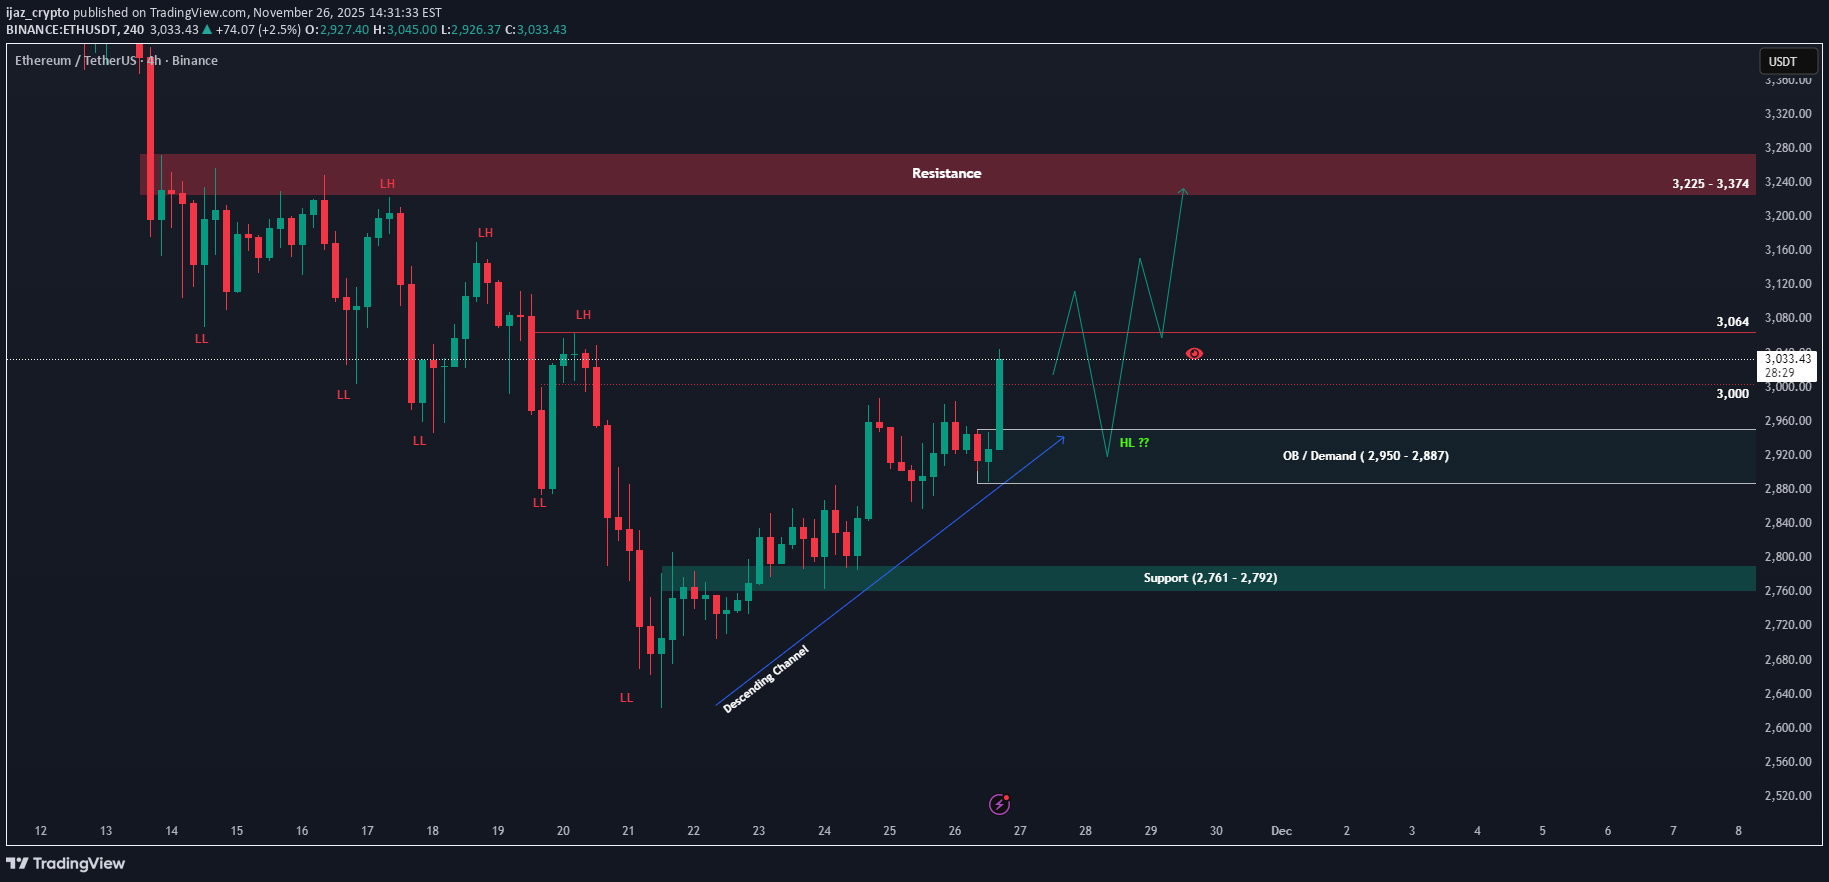
ETH 4H & Daily Outlook Update ETH continues to follow the broader plan we've been watching over the last few days. After tapping the monthly demand zone, price reacted strongly and rebounded from the daily order block, confirming that the higher-timeframe accumulation area is still holding well. This zone remains the key foundation for ETH’s medium-term structure. On the 4H timeframe, the trend is still technically bearish, with a series of lower highs visible. Price is now testing the supply zone and sitting right around the previous lower low at 3,064. If ETH can break and hold above this level, it would be the first meaningful sign of a trend shift, opening the door for a move toward the major resistance band at 3,225 – 3,374. If buyers can push higher, a pullback into support or even a revisit of the 2,950 – 2,887 order block is still likely, forming a higher low before continuation. As long as this OB area remains intact, ETH maintains a strong chance to extend upward and retest the resistance zone. But if this OB breaks, the structure weakens and price could slide back toward the deeper support at 2,761 – 2,792. Overall, ETH returning to the monthly OB was a healthy reset. As long as this region is protected, the higher-timeframe accumulation narrative remains valid.ETH - Daily OutlookETH 4H Update ETH is moving exactly as expected. After getting rejected from the 3,225–3,374 resistance zone, price has now pulled back to retest the 3,064–3,000 area — which was previously a resistance and is now acting as support. This retest is important. As long as ETH holds this zone, the structure remains bullish, and price has room to rebound for another attempt toward the resistance. A successful breakout would open the path toward the next major zone shown on the chart. If this support fails, ETH may slide into the FVG + 0.618 area, but for now the market is still respecting the higher-low structure and maintaining upward momentum. ETH just needs a clean bounce here to continue the bullish shift.
ijaz_crypto
بیت کوین در آستانه سقوط یا صعود بزرگ؟ سطوح کلیدی حمایت و مقاومت BTC را از دست ندهید!
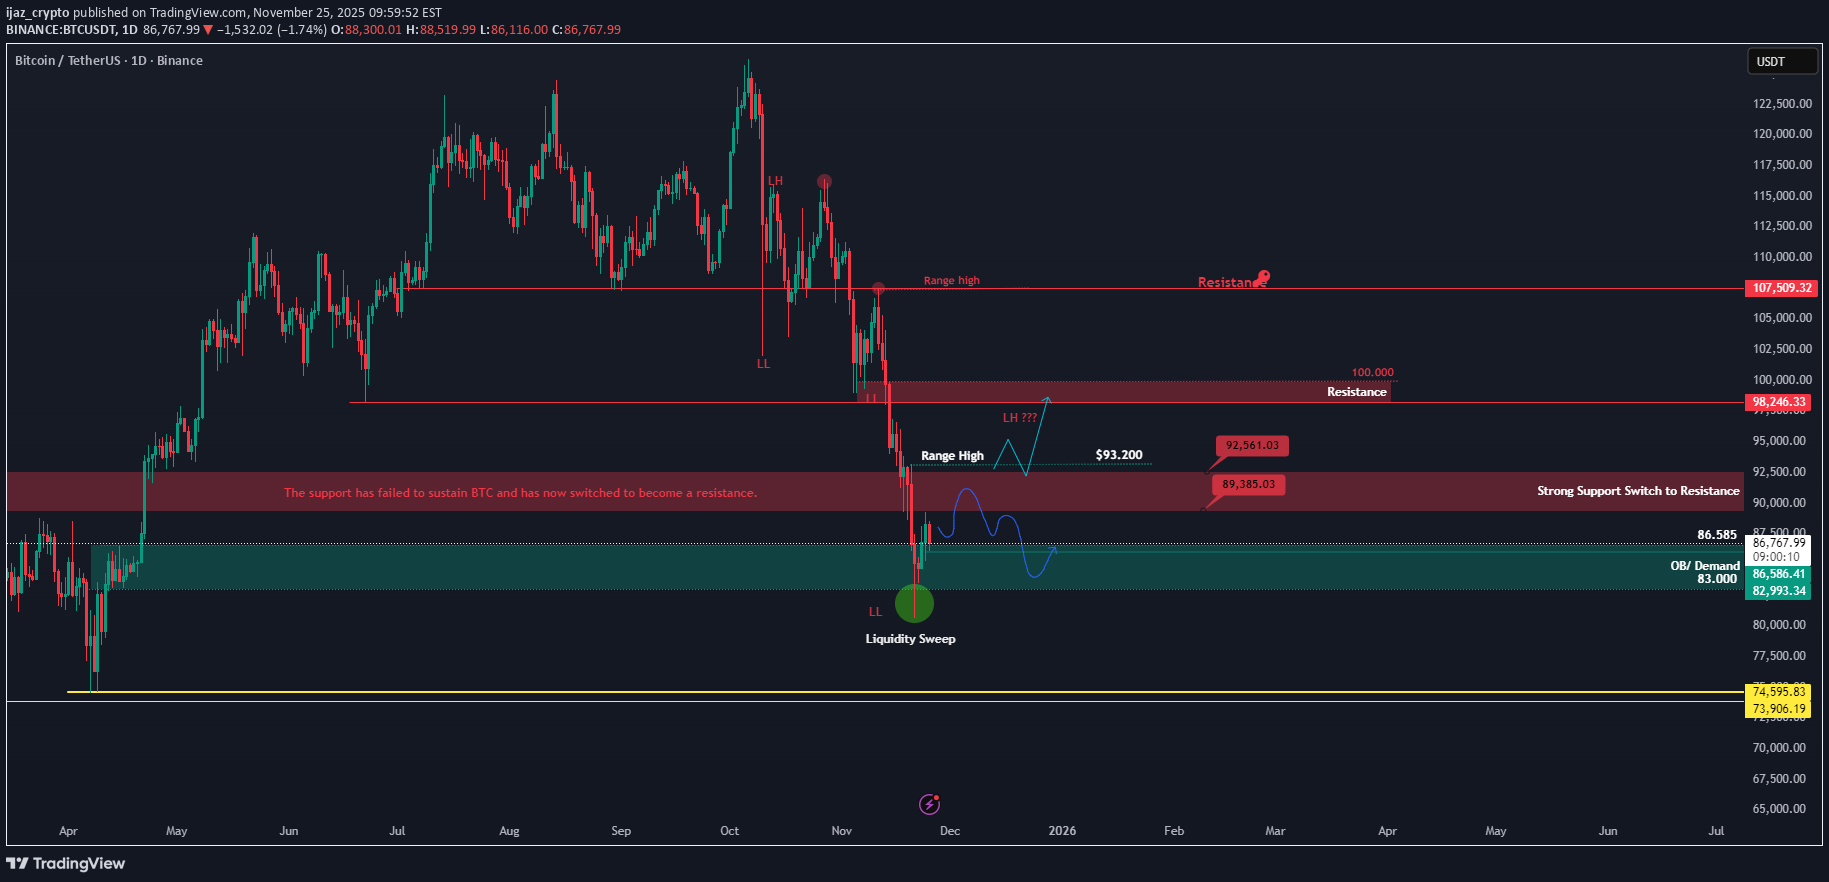
BTC Daily & 4H Outlook Bitcoin is showing mixed signals across the 1D and 4H timeframes. On the daily chart, BTC failed to hold the strong support zone and has now officially flipped it into a resistance. The drop also swept liquidity down to the 80.600 area before rebounding from the daily OB, which gives us a temporary relief bounce. Right now, price is pushing upward and may retest the resistance/supply zone above. If BTC rejects strongly from that resistance, the market could be in trouble again because the downside target reopens toward the 83k–86k region. This area becomes even more important when we look at the 4H chart, where we still have a key support between 85.650–85.000. This zone must hold—if it breaks, then 83k becomes likely, and a worst-case scenario returns us to the 80k sweep zone. For BTC to reclaim momentum and shift into a bullish structure, the market needs to break out above the major supply at 93.240. A clean breakout and confirmation would show strength and could trigger the next leg toward 98k–100k. If that happens, we may also see a strong positive impact on altcoins.4H Outlook perspectiveBTC Update Over the past few days, BTC moved exactly as expected and tapped into the supply zone. Once price reached that area, we immediately saw a clear rejection, which is a normal reaction after such a strong push upward. This rejection now opens the door for a potential short-term pullback, either into the nearest support at 89,271 or deeper into the order block zone (88,234–86,215) before any continuation. If BTC holds one of these zones and forms a proper higher low, the structure for a bullish continuation becomes very clean. A successful rebound from support or the OB area would give BTC the strength needed to break through the supply zone at 91,500–93,241, confirming the shift and clearing the path for the next major leg upward. Should this scenario play out, December has a high probability of turning bullish, with BTC potentially pushing into the major resistance zone around $98,000–$100,000. That area remains the next big target if the current pullback forms a healthy base.
ijaz_crypto
اتریوم (ETH) پس از پسگیری نقدینگی، آماده حمله به کدام منطقه مهم است؟ (تحلیل فنی)
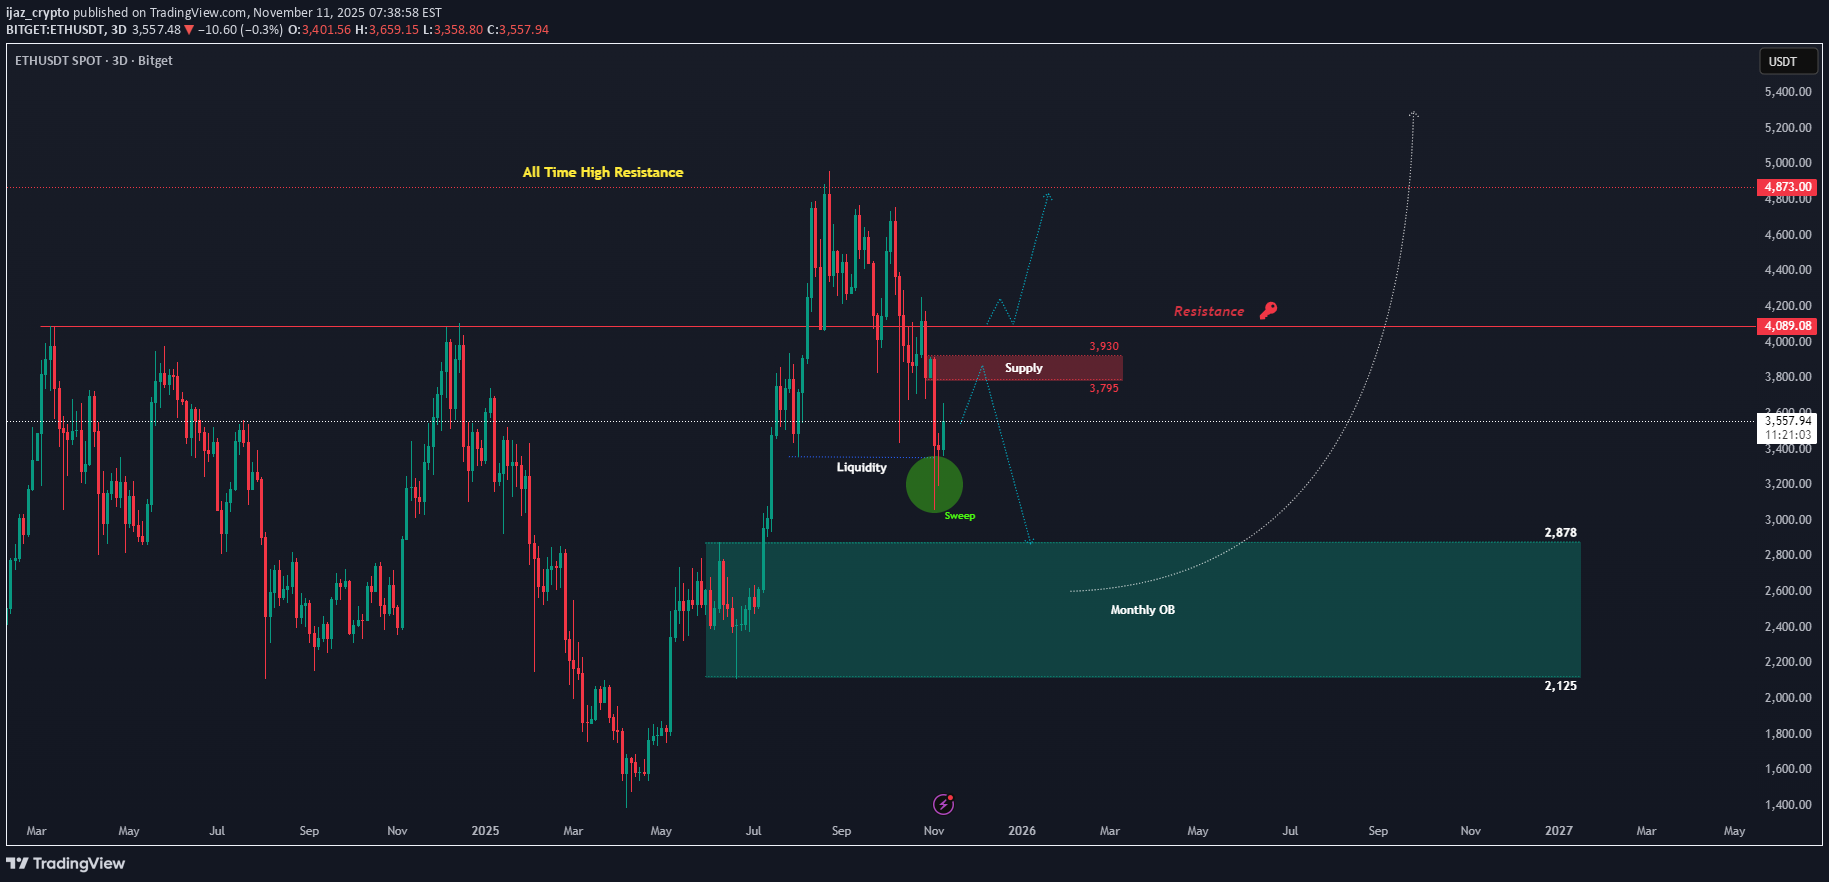
ETH successfully closed above the $3,350 liquidity area on both the 3D and weekly timeframe, confirming a clean liquidity sweep and reclaim. This type of move often signals the start of a bullish rebound, which we’ve already seen with ETH recovering strongly over the weekend. Currently, price is likely heading toward the supply zone between $3,930 – $3,795, where we should monitor the reaction closely. A rejection from this zone could trigger a short-term pullback, potentially revisiting the $3,350 support area once again. However, if ETH manages to break and close above this supply, the next major challenge will be the key resistance near $4,089, a crucial level before retesting the All-Time High (ATH) region. On the flip side, the bearish scenario would be a weekly close below $3,350, opening the door for a deeper retracement toward the Monthly Order Block (OB) zone around $2,878 – $2,125. This could unfold if Bitcoin also drops below the $100K level, reinforcing broader market weakness.
ijaz_crypto
بیت کوین در آستانه سقوط؟ سطوح کلیدی حمایت و مقاومت BTC پس از شکست اولیه!
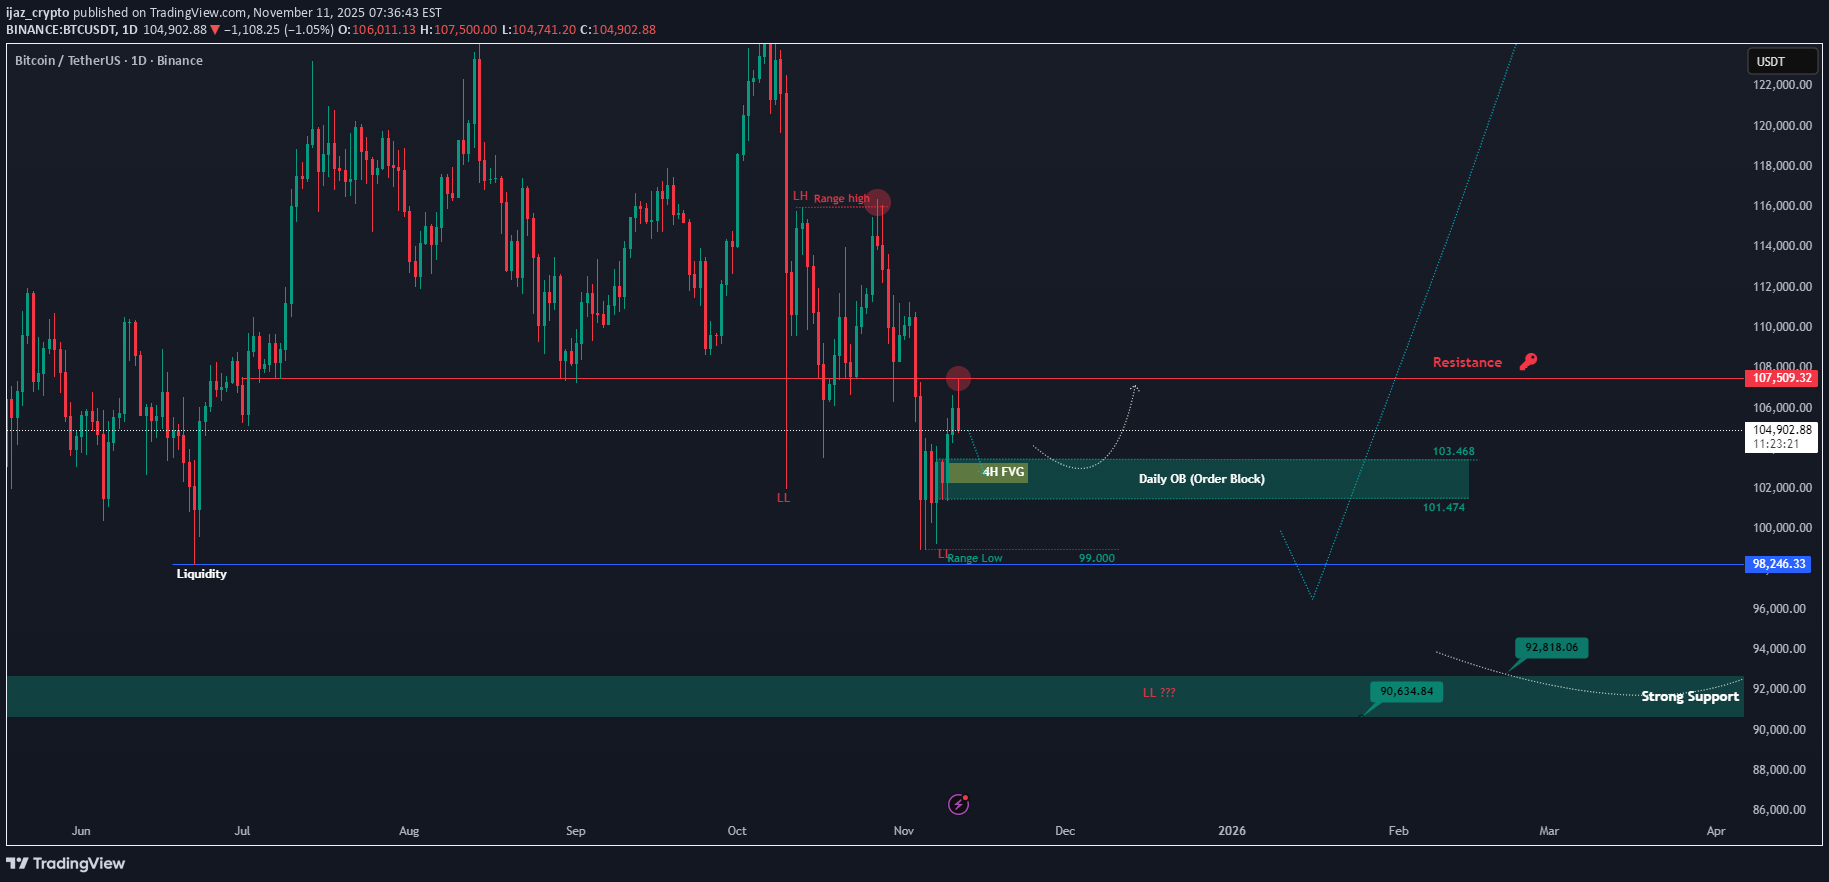
As expected, BTC successfully closed above the $100K mark on the daily timeframe and moved up to retest the major resistance zone around $107,500. However, the price faced a clear rejection from this level, confirming that it remains a strong resistance area which Bitcoin must break to resume its upward momentum toward $110K–$112K. Currently, BTC is showing signs of a potential pullback toward the Daily Order Block (OB) area near $103K–$101K. This zone will be crucial to watch — if the price reacts positively and rebounds, it could signal another push to retest the $107K resistance. On the other hand, a breakdown below this OB may open the door for a deeper retracement toward the $100K zone or even lower, possibly targeting the liquidity around $98K. For now, BTC remains in a short-term corrective phase within a larger bullish structure. The reaction from the Daily OB zone will likely determine the next major move.
ijaz_crypto
آلیس (ALICE) در آستانه انفجار قیمتی؟ تحلیل معکوس شدن روند پس از انباشت طولانی!

ALICEUSDT – Potential Trend Reversal After Long Accumulation Phase After several months of sideways movement, ALICE finally shows strong signs of reversal. The chart reveals a clear manipulation phase below the strong support zone, where price briefly dipped before quickly recovering. This manipulation often indicates that liquidity has been swept and smart money is entering the market. The breakout above the descending trendline confirms that bearish momentum is fading and a new bullish structure could be forming. Currently, the 4H Order Block around 0.35–0.40 has turned into a solid support zone. As long as price holds above this area, the bullish outlook remains valid. A possible short-term pullback to retest this zone would create a healthy correction and a good entry opportunity for continuation toward higher levels. The next major target sits around the 0.75–0.80 region, which aligns with the previous major resistance zone and liquidity area. However, if the price breaks back below 0.35, it would invalidate the current bullish setup and open a possibility for a deeper retracement. For now, ALICE is showing promising momentum, and the structure supports a potential mid-term bullish rally.
ijaz_crypto
BTC Forming Bullish Structure — But Wait for the Higher Low

After months of lower lows and lower highs, Bitcoin has finally broken structure by pushing above the previous lower high, officially forming a new higher high (HH). This is an early sign of a potential trend reversal back into bullish territory.However, before momentum continues upward, a healthy retracement could occur. The key level to watch is the support zone around $91,200. If price pulls back and forms a higher low (HL) here or slightly lower around the $88,700–$87,500 zone, it would confirm the bullish structure and potentially kickstart the next leg up.Patience is key here — let the higher low form before looking for long setups.
ijaz_crypto
GMTUSDT – Trendline Breakout, and Potential for Continuation!
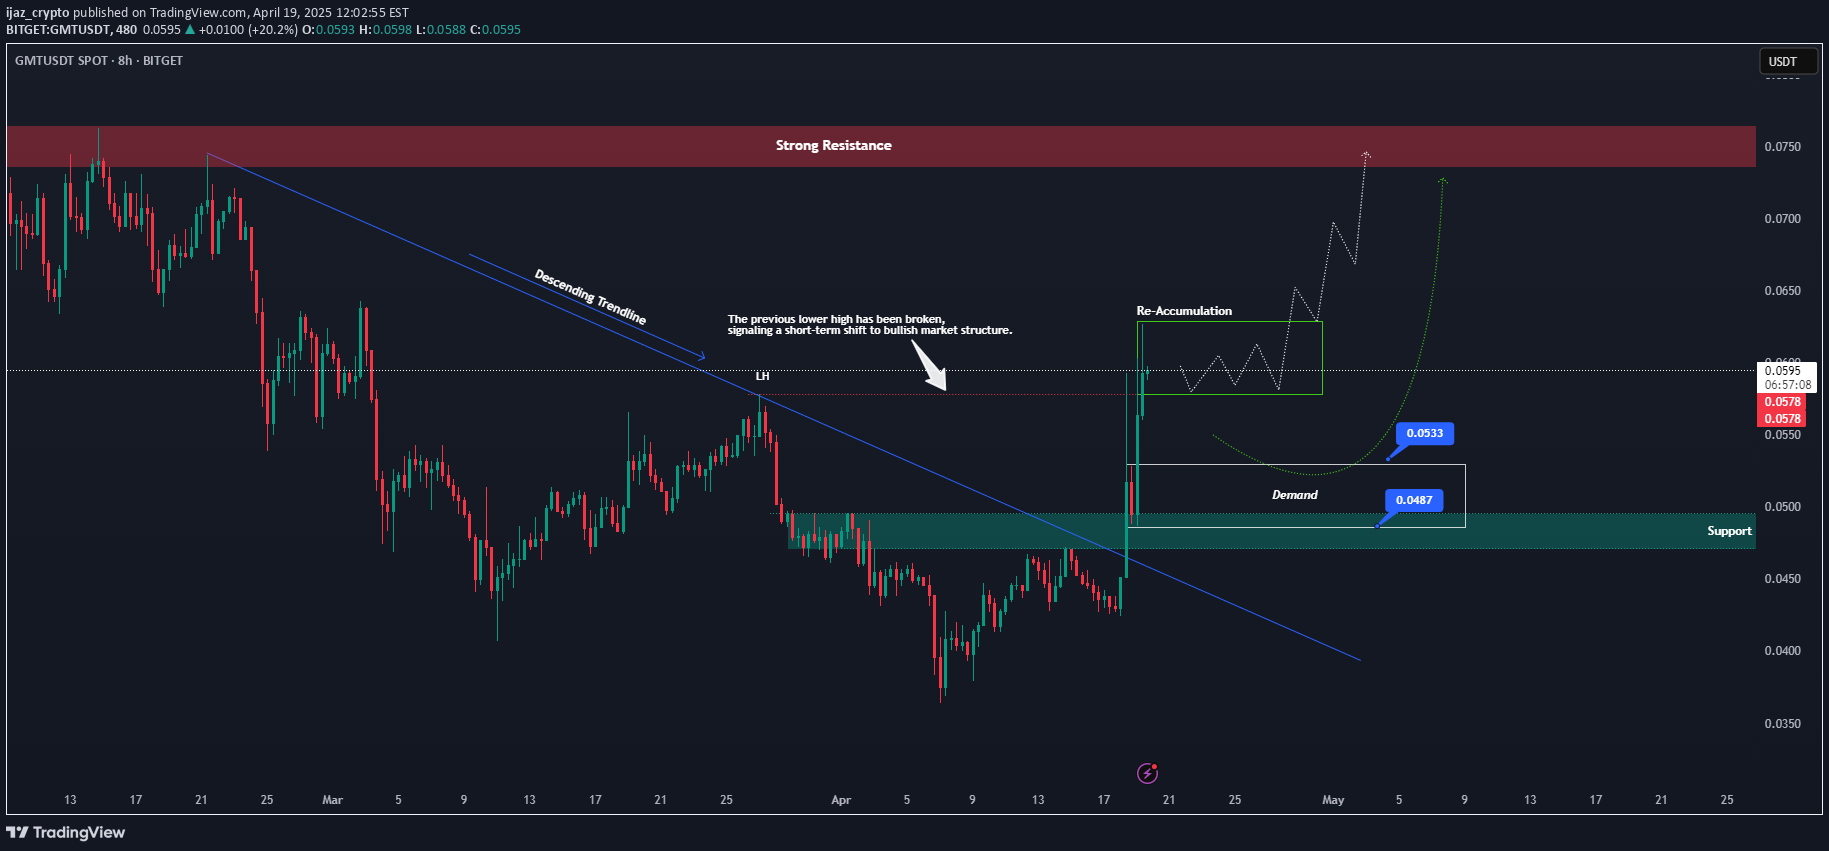
GMT has finally shown signs of strength after a prolonged downtrend. The pair has broken out of its descending trendline, a key structure that had been capping price action for weeks. This breakout is more than just a technical event — it signals a potential shift in market sentiment 🧠.One of the most important developments is the break above the previous lower high, which confirms a short-term bullish market structure. With this structure change, bulls have gained the upper hand — at least for now 🐂.Currently, we are seeing what looks like a re-accumulation phase just above the breakout zone. This consolidation is healthy and typical after a strong impulse move. If GMT manages to hold above this area, we could be looking at the early stages of a bullish continuation, targeting the strong resistance zone around 0.074 🔥.However, it’s also important to be prepared for a possible pullback. If that happens, the demand zone between 0.0487 and 0.0533 will be crucial. A retest of this zone could act as a springboard for the next upward move. 📈🔍 Key Technical Highlights:📉 Demand Zone: 0.0487 – 0.0533📈 Next Target: 0.074 (Strong Resistance Area) Final Thoughts:Momentum is building, but confirmation is key. Watching how price reacts in the coming sessions — especially around the consolidation and demand zones — will be crucial for spotting the next big move. If bulls maintain control, we could see GMT pushing toward new short-term highs in the coming days. Patience and proper risk management are your best friends here.
ijaz_crypto
BTCUSDT – Big Move Incoming, Key Level To watch!

Bitcoin is approaching a key decision area after a few months of downward pressure. The chart shows a clear bearish structure with lower highs and lower lows. Recently, a possible double top has formed just below the major resistance near 88.668, which could suggest a short-term pullback if buyers don't step in.If the double top plays out, a retest of the support zone between 78.576 and 82.000 is likely. This zone has held well in the past and could act as a strong base again.However, if price manages to break and hold above 88668, that would be a strong signal of strength. It could mark a shift back to a bullish trend, with the next major target being the all-time high area around 108.360.Key areas to watch:Support: 78.576 to 82.000Resistance: 88.668 and 108.360Right now, Bitcoin is at a make-or-break point. A breakout could trigger a strong rally, while rejection may lead to another dip. Stay patient, watch how price reacts at these levels, and let the market confirm the next move.
Disclaimer
Any content and materials included in Sahmeto's website and official communication channels are a compilation of personal opinions and analyses and are not binding. They do not constitute any recommendation for buying, selling, entering or exiting the stock market and cryptocurrency market. Also, all news and analyses included in the website and channels are merely republished information from official and unofficial domestic and foreign sources, and it is obvious that users of the said content are responsible for following up and ensuring the authenticity and accuracy of the materials. Therefore, while disclaiming responsibility, it is declared that the responsibility for any decision-making, action, and potential profit and loss in the capital market and cryptocurrency market lies with the trader.