
iCantw84it
@t_iCantw84it

What symbols does the trader recommend buying?
Purchase History
پیام های تریدر
Filter
iCantw84it
XAUUSD Quick fast short to bottom if you need to make some back

Quick little drop here to make back some lost profit. by iCantw84iti dont know why they used all the chartsI put long because im going long after this. I hate that the image for this is 4 charts with all my notes smashed together...but i didnt have much time to set this up before the move.there is 13 mins on this the real move might not come til the last min. or they might stall this out for ever then all of a sudden do it all in one candle.This could be like 19 candlesi know I know I said quick. lol everytime I have been in a trade and I realized it was happening , I would say I ll just wait through it. dumb idea. and whenever that happens it actually drops all in one candle on me. now that I am trying to share it will take the full extent of its move. lollol look at how they are inching it so slowly and then pull back like oh no its TOO DEEP. they really try to sell that ish. watch the candles everything it does before the last minute is selling you on the idea of what you fear or want the most to happen.As always if you like what I am saying pls like follow and most of all Boost as its free... and it helps me know you are wanting more. Thanks for checking me out.Im not worrying about this candle watch the high of it... if it stays below the previous 5 candles on a 15 then we should be still in the move... anything can happen. but I think they are just dragging this out as much as possible. Looking at the chart again I adjusted where i placed my ta line for the drop then looked at what we have and I am still correct.. we havent had it. it has to go deeper. and they are fucking with us. so hang tight I dont want to take a big L at the end of my last day off for the week so its going to be a win. also check the volume there should be slightly less volume over the next 5- 10 candles. of course they end this candle at full mast. the next one should drop but hell nothing is going the way it should so far.no lie kind of freaking out now lol i guess we are just skipping testing the low end of structure and just going right up to launch out of structure? let me check one more timeoh wow.... I think I see what they are doing they are elongating the move instead of being to far ahead we are actually back to this being the highest peak of this move so be careful it could launch and make you neg quickThank you for the BOOST!
iCantw84it
XAUUSD who's ready for another trade?
If you were trading with me yesterday I took you down a 6 hour tour of what XAUUSD was doing every move it made and every move I made. I am starting my prop trading test today. And yesterday was my preliminary test to see if I had my rule set down pat. Also, to see if I can guide others through it step by step. How many mistakes would I make? Were they Huge or small? Was I profitable or not? Did I obey by the rules or not? Could I make someone else money? Yesterday I made 16 Trades 3 losses so around 80% Trading the last trade was really just to see if I needed to continue or not and I shouldn't have made it. Only a $50 loss across each loss. Avg Trade was $200. Max open lots was 8 singles at one given moment and over half were around $300. My only regret was that I didn't catch the 90% pull back before it was too late. Need to come up with a better way for this, Which I believe I have with my new indicator that shows price under the lines. When it rotates to above it is very bullish in that moment even if all my other signals are saying its not going to turn completly or reverse me out of my trade. Had I caught it in time , I could have made profit rode it up and then back down. Which I had the trade channels set to do that if I wanted. So potentially somewhere around 3x profits or more realistically 2.25-2.5 profits because of slippage. I ended up with $2882 using singles on one move over 6 hours. Yes, I know I could have made a lot more. Another trader made 24k on the same move yesterday. However, this is new and I am trying to stay in my lane. lol Todays Trade.... Not sure up or down yet. Im coding a indicator right now for this using chatgpt trying not to waste my day too . but its consolidating so we should be good. im late getting in I will start this now. when the market closes I will close as well but when its back up at 6pm est I will start it back up.here is the inidicator i just created. for price projection based on other factors that influence it and supply and demand1901.41 is being pegged on a 4hr analysis of this stock and its contributors...Daily it says 1906.50 lolthree price targets 15 min 1900, 4hour 1902.19 Daily 1906.69Thanks you all know me well.... love the boost and we havent even cracked this open yet LETS GO!I'm not sure what I love more, finding a new way to create an indicator to solve a issue I want to see fixed.... or being right! lol I have the biggest grin on my face. Love making new things. This one is specifically tuned to GOLD. I love how hyper focused it is..Channel behavior goes something like this: 1. Drop in or pop up into new trading range. 2. Identify top and bottom of channel. 3. oscilate top to bottom. 4. when buyers or sellers over power one side you will manipulation to one side or the other. 5. The reaction will be a test to the opposite side and manipulation there as well. 6. test is over when price has either successfully made out of the othersides extremity to the channel. 7. if price fails to get back in channel it finds support or resistance depending on side and makes a move to continue in that direction. 8. if it makes it back in it follows these rules: a. if high drop low. if low go high. b. if up it drops to bottom of channel. to test downside c. back to mid of channel to test the upside. d. then back to bottom to manipulate bottom e. once outside of channel it either consolidates and is shaking out weak hands and absorbing shares . or drives down deeper to shake out weak hands again. f. then moves back to mid g. back to bottom of channel h. runs to top of channel i. if doesnt break through it runs back down to mid j. retest high k. drops back down to bottom of channel. l. if manipulated bottom it most likely will do this again. m. after succesfully breaking through to the bottom and manipulating it again.. it moves back to mid (this is called the spring in wyckoff) n. then bottom again to retest one last time. o. then launches to break through top of channel p. once its through it tries to find support on the top of the channel q. then trys to make a new high r. then finds support on top of the last high. s. trys to make a new high again t. then comes all the way back down to the top of the channel (called last point of supply) Phase C u. then makes it move to break away from the trading range. this is called phase Di could have the phases slightly off but the movements are solidWeakness fall out of channelprobably taking my $150 here as market will close soon. Ill set up to get in again as soon as it opens or at least stalk it until it gives me the oppurtunity3o min is actually moving up away from price.. going to hang tight to see what happensemotional push down out of channel?Nailed it !1st trade on my prop trading test. $116 Should of taken the $150.00 lol oh well curiosity killed the cat I am going to chill till market opens at 6pm unless you all have questions or want me to check something out for you?Going to open a video of my chart live streamLooking fo signs of life Lets see what we findadded another positionadded anotherabsorption hit again1903 price target on 15 minThank you everyone for the early boost it makes me feel bad to ask but i mean I called a no vol move to the upside and if you have been adding you should have around $150 thats worth a boost or two.. ;: )supportYea i knew i should of closed it out this move should have another urn up but it might be cooked.Slowly crawling back up if you look at the orange path i drew it should be about rightthanks again for all the boosts if you are half crazy and partially psychotic about being right you held here like an idiot... but clearly stop loss hunting manipulation its disgustingChannel rules for the win.... if it fails to break out here it will dumphere is a the same move i just moved the dots over sidewayswe break out of this im addingWe arent in the clear yet its gooing to look ugly herebasically the consolidation we just saw was the teal move... glad i could post it before it happened all the way lol if it dumps back in to the channel and heads to bottom I would consider taking the L just be careful if they cant find shares to break free it will drop down to shake out some.dont et too excited but if you need a small win...lord I do.... here is one... look who made it on top of the linesseriously you can fart and knock this guy off the lines lolAdded here...l might be a pull back to top of channel here so be carefulwhoa! that was painful. Outside of that, everyone you all are great we just passed yesterdays views by 150! Lets go! Thank you for all the boosts! Maybe one more for walking us through that trip through Skid row.....sketchy!Where them 50 rounds? So did you guys know I have my chart live streaming? click here tradingview.com/streams/L2QTFcMQYb/Whoa that changed up real quick.... i guess we can say this wants to move up with certainty now... look at the candlesjust lkilled 60% of my trades holding 2Lets get some BOOST people Lol WTF! what a great pay off387 Points Whoa!vol offset bullishDrop down to 1 when it broke the chanel it was making. lets see where it goesSorry talking to a friend i havent talked to in a hot min. going to add one if this breaks for a new high but it looks like its trying to down step. so i might close my last one here... soon and wait for another signal.. pls ask any questions if you have any if you havent... Hit me with another boostbe careful here it looks like pahse d where it jumps off a cliff. if it gets a lot of vol and moves back over that line I will addwaiting for the pull baack and then im adding oneif it dumps im out lolContracting and expanding . making nodes... interacting with the nodes and eventually making its way outadded to position again here most likely jumped the gun we will see avg vol is low like 39 push then pop might happen real quick to shake out shares and use that to launchthe new indicators lines are alive you can see them latch on to candles from under neath and fuel the move up.bullishlets get some more boost going pls... another move up for profitSpoke to soon looks like the opposite move double top failed to make the smae high could dump here take profits if you got it if you see it move downlook at the vol candles diminishing.. no interest in going down. I am looking an emotional push down and then a pop to the upside.it keeps stopping short it might dump and its acting like it wants to go to draw us in....we are going to move up and out of this box!
iCantw84it
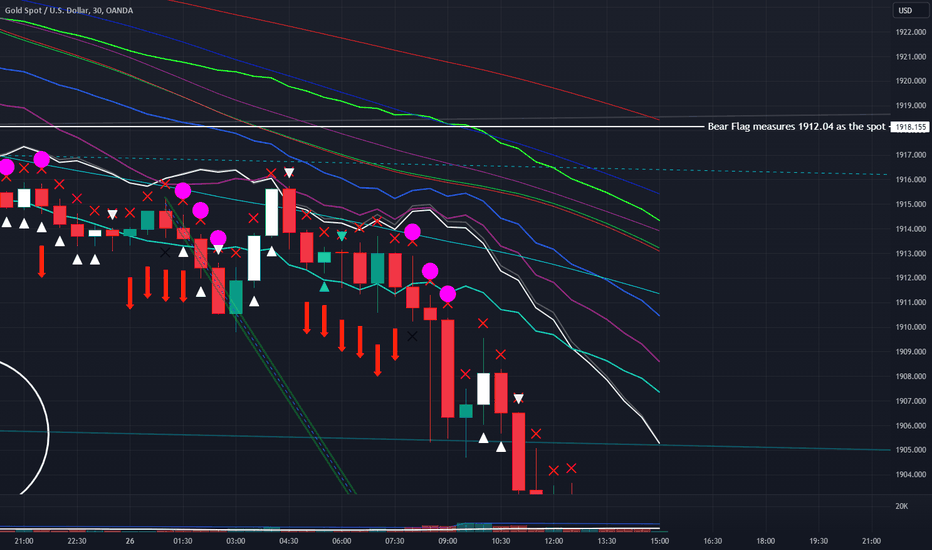
XUAUSD Next Stop 1905-1900 pls put trays in the upright position

Yes these lines might cause you seizures do not look at them if you have or a family member has experienced or has a history of having them. I am going to post two charts one is something I just made. so simple. and another is my indicator. both say market wants to dump to 1900ish-1905. this chart a signal when the market basically burps or farts....lol sorry but you aren't suppose to see it. I see it because I made my indicator with my own formulas. I use that symbol's candle that it is referencing and I can draw channels leading from it above and below price action using other price action. This shows me where price will go if it breaks out one way or the other. The other chart is an instant direction indicator which right now on a 15 min chart is showing both lines pointing down. the stronger the trend the straighter the lines and the closer together they are. you can switch down to a 1 min and see what the instant is.... if the red line is on top while moving up its a weak move... probably ignore that move. When green is on top its got alot more momentum to it. I normally add to my position when the red is on top and moving up. When it switches I start closing positions. Right now the market isnt running full steam but when it is there chart I am using is set to move against gold when the market is running up or down. depending on different metrics. Its kind of smart. Once I get it dialed in It should tell me where gold will be headed to. There is a .30 cent difference in price between the two with the market closed. I can imagine on really huge volume days this can have a massive divergence and push this. Thanks for taking the time to read. I love messing around with new things and this was fun. Please Like, follow and of course boost...as its free. And it shows me that you appreciate or want to see more of this. by iCantw84it 09.25.23actually 1912.34 would be a viable stopping point if you see a strong reverse here this would be solid.. ill post if I see soemthing first.1912.12 is where two paths crossAdded another positionpotential profits are: $110 $91 $50 $10 $-9Target potential: 177 ptsthats $885 from here if it can maintain this move downIf you jumped in when I posted this you would be $100 on 1 contract to the good. Thats worth a boost dont you think? o.0not counting the emotional candle just nowthis move is strong look how the red is on touching the other linemaybe over if this closes on or over this....hang tightstill cliff hanging like sylvester stallonstill hanging I have a im stupid i should have closed this 1 line ago line.. but watch hang onWhat can i Say I'm a dual pistoleer!You guys are stingy with the boosts! what would you like me to do? I already called the move, stopped the close to the move up.... back to profits on the move down. and did it with dictating every part of the move in annotations. Would it help If I said I was cooking and dancing at the same time?I get it you closed your position didnt you? I feel you I wouldnt want to tip a wizard for shooting lightning out of his fingers into the air and striking down a flying dragon. o.0Increased buying int his area.Thank you whom ever Boosted you are a true boss!Because they boosted check this out. with the Volumetheres more if you keep boosting I will keep digging deeperWhoa you guys are hungry don't worry I have big spoons lets get into this. here is some more on the vol and distance.and another close preventedCheck this out... I was wondering why it stopped short and found thisFeel free to ask my questions about this stock or anything I am doing aThank you for all the boost I will pick some things to talk about but if you boost pls ask me anythingease of movement ? new higher lows but no higher highs? yetExplaining the lines and the symbols above priceWhen White is above Price action it causes pressure to push down. When it touches price it causes pressure to push down. If it comes up from the bottom and crosses price action to go above. I call that the Death Cross. Price Dumps!Death Cross Started this move downMore vol comparisonsIf you will look at the two candles you can see that they didn't break the high of the one candle. BearishAdded oneWatch out this thing might sling shot hereChannel the indicator and watch for over bought or sold conditions on the flyBreaks out over if it hasnt found support it will most likely dump to find support and if it fails it dumps to continue move. If it drops low it will move tot he top of channel and manipulate the high could also be a move to break out. Same with Manipulating the high first. It will dump to manipulate the low or break out of channel and dump to next channelWant this to reverse? Here's how we will know it has. Atleast one Part. there are about 5-10 different ways using this one indicator.More Reverse Signalsdifferent variation of the momentum indicatorfirst version of momentum indicator...At this point we are about 150 pts, although a lot slower to get these last 50 points. That would be another $50 bucks on 1 contract. Now if you have been adding we should be at .....Potential profits from adds: $180 $160 $124 $65 $84 $-20 Its moving lol and yea I got in too late on that big push down. thats $627 from what was $250 on last update to profits. Thats worth a few more Boosts I think lolYou's all are Great Thanks. Someone ask me about something on here. I can keep picking random things?Bullish moves in motion... dont lose profits... watch closeBearish still for me1 Min Bearish flagsLooking more and more like it will make a stand here... this is a 3 min chart. moving toa 5 min nextthis is interesting. Makes me think after these reds there will be more green trying to test upside vol and distance.. or demand and ease of movement. So far half the vol took 5 candles to get half way. not truly easy going up. but Vol is on par.here are some potential ways this move can play out.Another thing to keep in mind is the whole point of moving down is to find buyers that will hold on to shares longer. This whole time the vol has been diminishing. Meaning there are stronger hands holding these shares. Proof: There is less shares to trade each time or time period. Which is why the movement has been so much slower. We are hitting Absorption. Every good ansorption will have whats called a red push or in this case a green push up that will cause people to drop shares and take profit etc. this will flood the float and dilute the value causing price to drop again. unless there is a massive demand spike at this level that starts staking buyers greater than sellers. at that point this will launch. most likely not going to happen until 8am -9am-10am eastern time. All this is the ground work to set up a run . That said. if that is true then this move is to drive this deeper in the dirt and free up shares because its become so slow. its no longer cost efficient to get it to the price we need to get to where the pocket of deep pocket buyers are waiting. My best guess is either 1912 or 1900 which is the whole purpose of this trade. Either I am right or We just missed alot of profits lol15 min time frame has all the lines pointed up but they arent together, nor are they below price action. This isnt ready. This is a 90% move back to the start to shake out shorts and any buyers who want to ride this up and to trap fomo buyers as it goes up. if it was the real deal... it would be moving a lot faster. if you notice all the candles are really small. only the last 3 candles are of size. thats fomo but fomo with this draw down and if it was absorbed with Demand Spiking it would be really large candlescommitted to the upside candles for referenceadded to my position also showing what happens once it breaks the channel.Something to watch out for... this could have issues breaking the middle of the channel if that happens and it makes a move back to the top... two things can happen. 1. it will attempt to break and succeed if it does it needs to find support. 2.it fails and falls under the mid and test the bottom or more than likely drops below channel where it will attempt the same test as the high. if it fails it will continue to my price target.Going to add another if it clears the low of these two candlesFlags re-emerging on the 5 min timeframeAdd position update will most likely take profit on 1 or 2 once we clear the bottom of this move again. and then when we clear the bottom of the previous move.*** Future self*** When speed drops to .011 on the 5 min for any given length of time like over 30 mins to an hour..... Look at taking profits and potentially riding this up or just taking profits on most of my positions so I can reload and double my profitBearishwe are close.... I think this deserves another Boost... lolIf I am right 2:30 is the close to one of the europe Markets or somewhere over there past it.. lol so we should see some activity here coming inI would get in close here.. its so close it can turneither we are moving under these lines again or we are about to launchCome on wheres the boosts don't make me start making anaolgies about wizards and dragons again.... $909 at this point.. could have doubled that but its ok... this was a learning experience for everyone including me. thanks for joining me. I appreciate the follows and likes and boosts!Thanks Zak you are true boss! just for that the price is going to drop more for you. lolAt this point I am looking for an emotional candle that desimates everything else on screen or atleast over the last 17 to 31 candles. This will be the sellers climax and this i will be the Change of character that sets up the reverse or continuation of this move.Sorry slow on getting to this because its so LONG the post. lol Less vol on last red compared to the two greenLadies and Gentlemen with this we Cracked into 1912's Still doubt we are going to at least 1912.04 ish....??? Fomo will kick in if it keeps dropping which means free ride down here we goNope not enough$ 1500 right here nope $1600 nope there it is emotional drop fomo $17501.1k vol this is the candle we are at 1911.95 took $300 off table $1500 left might take another soonBy the way We made it to 1912 now is this the end of this move or are we going to 1900 like I first said? Vote in chat pls.More Boost pls lol I think I earned it. $2k move here if you have been with me from the start,,, could have been $4k if I got out and rode it down again.Flags!Back under the lines going to be hell getting back over.... At least I hope lolSee most people get excited about the cash....no not me.... I love it dont get me wrong.... whats better than the cash? Being Right! lol it can be a curse and it can be a blessing. I have been working on being ok with being wrong. and that has helped my trading a lot. Thanks again to everyone whos been with me this whole time. I think this trade is just starting. Im back to $1700. might take one
iCantw84it
XAUUSD 3rd trade today headed to 1923.50

XAUUSD I have gone to just trading this while the market is down. It is incredibily predictable with my indicator. I have anchor points for where Channels originate from and flags for when demand is exhausted. Supply lines for pull backs. and speed inidcators built in for streangth of moves incase a reverse happens. Target should be 1924.50 third trade of the day each ones target was drawn 1-2 days ago. Pls like and boost its free. by iCantw84it 09.22.2315 min for more detail on the tradesI plan on taking 25% off the table at the if this line doesnt hold...somewhere around 1925On the 15 min if you just wait for this consolidation to end you will know when there is a huge emotional push down... Take your profits one you see it is exhausted and the distance it moves doesnt break the high or low created prior on the last green.still have flags on top not done going downif you imagine there is a box around this consolidation you can see it hanging out at the top then drops to bottom manipulates the low hits middle, then it should manipulate the low again and then run for the top back to the middle or if alot of activity back to bottom and then out the top of the box.reverse is close.. this divit in the vol means absorption is present theres a chance we might not get that last push but very unlikely...heres exactly what will happen it will get to the point where its about to break out and stall till EOD and then manipulate the price action to hit your stop losses and move it up so when you start trading again youre so negative. lol ill probably take my profits here in a bit if it doesnt make a move down in the next 30 mins. made a $1000 ill take ithere we goHereis how it shaked out... There is a chance it does go down to hit my target but at this point in the day its where they hope you leave your trade open and then move it 100-200 pts to max your account or trip your stop loss. not worth it. closed out 5 single trades all around 200-300 Was hoping to get to 500 but ran out of time. Like follow boost lets do it again on sun or monday.
iCantw84it
Watch this move....ANKR Crypto on new cycle indicator
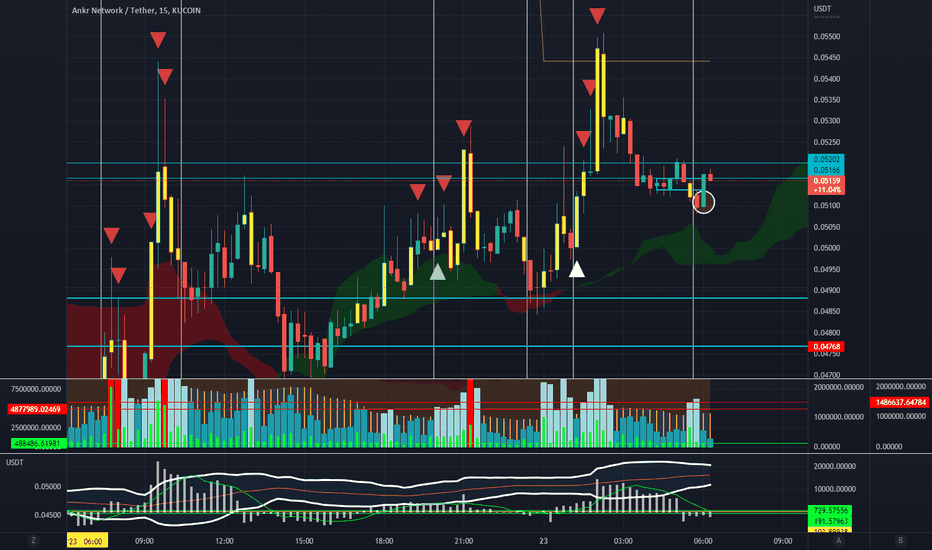
Using chatgpt to create new indicators....if you can look at this on 1 min it would be better.....but maybe over time you can see it too.by iCantw84it02/23/23if you find this intriquing pls like/ follow and most of all boost. thanksi know i didnt go into a lot of detail but I just wanted to mark this move as I just put it together and want some trades under its belt.thanks again.
iCantw84it
TRXUSDT using trigger on 8hr and 20 min Trigger .62704
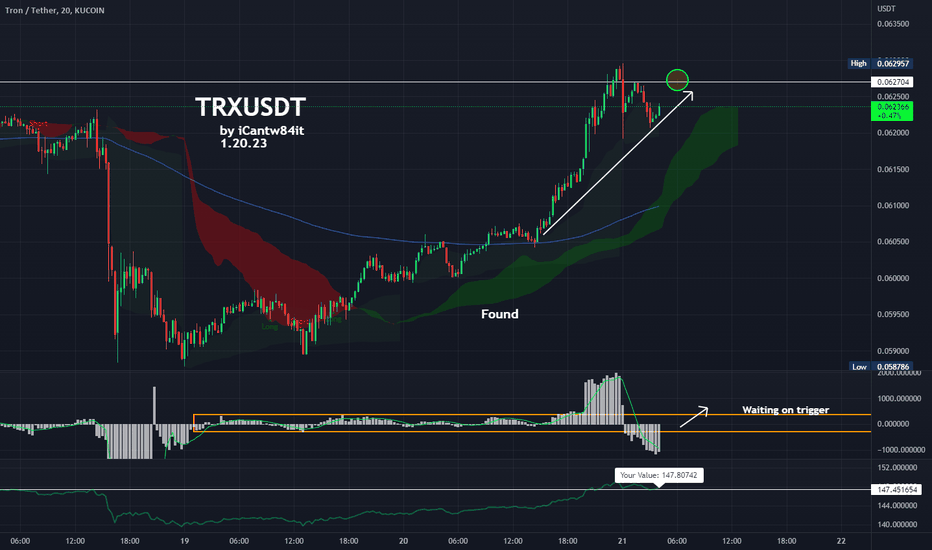
Was testing my trigger out on a 8hr and came across this crypto,. The move is beautiful and is ready to pop. Lots of pop potential. Still waiting on the Volume to spike above avg to set off my trigger. If it does it could be a nice run. I also Lined this up with the same trigger on a 20 min.... fractal large and small time frames lining up what else could you want.by iCantw84it01/20/23
iCantw84it
LUNCUSDT just finished the bottom bounce Launch Time

LUNCUSDT just finished the bottom bounce. Typically a move from distribution into accumulation looks like a drop that consolidates then bounces and consolidates higher than its baseline....(which is the push down in the middle of consolidation prior to distribution) Then after consolidation high it drops again to manipulate under the baseline to break stop losses and absorb more of the float. Then a move back to the high after the absorption which is shown on chart with Volume stating over the last 6 candles there was 38billion in volume....on the last candle there was 34 billion by its self. this is a signal of absorption is complete and now it consolidates high again just below the area it couldnt pass before. Then when its ready to break through it will drop back down to break the line it created moving up which everyone thinks is safe to place their stop losses... It breaks this line to absorb the last remaining part of the float it needs to break through the area it has not been able to get through. The reason its been in this area so long is because it has been doing this pattern on every time line and its been waiting for each one to complete this move. Now that we are at this point it can start its move for profits..... Lets hope it takes just as long on this stage as it did on the previous.... smhby iCantw84it10.31.22Only 4 days late but still....The timing is based on if the absorption is successful here recently is the only time the market hasn't responded bullish immediately...not sure what that means but If I had to take a guess its one of two things. 1. Consumer faith is being shaken and less people are bullish and starting to doubt their decision and fear is settling in which means they are pulling their money out.2. The bigger whales want in and we have all the shares and the only way to get the shares from us is to drive it deeper than its been in a while and create mini bull traps to work retail weak hands out of their shares. So they can get in on the phone and reap all the profits.I'm going to give a 3rd, its very possible both are right as the second idea would create ultimately make the 1st idea become a reality...........In a normal market the timing of these educated guesses on when they pop is spot on....so what you can take from that is when it pops pretty much within a candle before or after the suggested time than manipulation is at a low and retail is doing what they are programmed to do. When the timing is off its because retail isnt following waht the institutionals want them to do and or its being manipulated. As what I am timing is Retails natural response to the psychology the algo is subjecting retail to.Let me know your thoughts. and Happy trading.. I am pretty much only long term trading at the moment until the manipulation is subsided.Ill post an new image below of the last consolidation period and current...this should give us an idea how long this algo will take if retail responds the same way it did last time and institutional still has retail in their pocket.1.6 Million from USDT getting approved to go to LUNC Development and connecting it to Tendermint and vanilla Cosmos and Casm Wasm..... Version 2 is something else I saw on the update list from Terra RebelsThe model for growth also includes a Pay or incentivize based on created and implemented in use dapps for LUNCComing down to put a foot in the high of the low it just made...should use that to break the high it just made.end of cycle is Nov 7 2022 @ 7:57am it should start to move up here. its stalling and freeing up shares to be able to break the last high.If this helps to visualize it....imagine that all the market is are these 3 things:Break outBreak DownConsolidationSometimes the break outs and break downs and the next break down are really close to each other because of the amount of retail pushing it.....the more inline retail is to the algo it moves in more vertical patterns....the less retail is inline it stretches out this pattern to look less like needles and more like wide stretched W's and M's . Thats the algo manipulating retail to get on the right side of the fence. when you see consolidation over long periods of times it is getting ready to change or test retail to see what side of the fence they are on. if they aren't on the right side it will fail either immediately or right after a spike to price action that fades off to fast.....at this point the algo needs to find cheaper shares and free up more shares to absorb the float and find more retail buyers who will support what it wants to do.
iCantw84it
LUNCUSDT Pop set up to launch

Watch this candle at 8pm est I use a different chart on my last post. Should be the same but I wanted a shorter time frame. Cycle Theory, it should have a test to retail here and it should pop.by iCantw84it09.12.22
iCantw84it
LUNCUSDT Terra Classic setting up for a Pop @ 8pm est

Watch this candle at 8pm est. Should be set to pop. by iCantw84it 09.12.22
iCantw84it
LUNCUSDT about to pop again

Based on cycle theory and on a 1 min chart price should drop under the cloud and resurface in the next 30 mins. A change in direction should start at 19:59 est time and another big push should follow.by iCantw84it09.05.22
Disclaimer
Any content and materials included in Sahmeto's website and official communication channels are a compilation of personal opinions and analyses and are not binding. They do not constitute any recommendation for buying, selling, entering or exiting the stock market and cryptocurrency market. Also, all news and analyses included in the website and channels are merely republished information from official and unofficial domestic and foreign sources, and it is obvious that users of the said content are responsible for following up and ensuring the authenticity and accuracy of the materials. Therefore, while disclaiming responsibility, it is declared that the responsibility for any decision-making, action, and potential profit and loss in the capital market and cryptocurrency market lies with the trader.