huecoshunter
@t_huecoshunter
What symbols does the trader recommend buying?
Purchase History
پیام های تریدر
Filter

huecoshunter
سناریوی بیت کوین: آیا قیمت به ۱۱۱ هزار دلار میرسد یا سقوط به ۹۵ هزار دلار؟

There are 2 uptrend channels on the chart. Bitcoin price has lost the upper channel past week. Now it's rising for the last 3 days. It has arrived to retest zone right at $111600 Bearish Scenario If the price can't surpass $111600- $111900, it will use the lower channel and that means it would goes to $95K.

huecoshunter
هشدار نزولی: سقوط قیمت در انتظار است!

Vol 1. Scenario Ascending wedge worked well on the left of the screen. If the same panter works price will drop as the screen you see.

huecoshunter
Longterm Uptrend still in a Process!

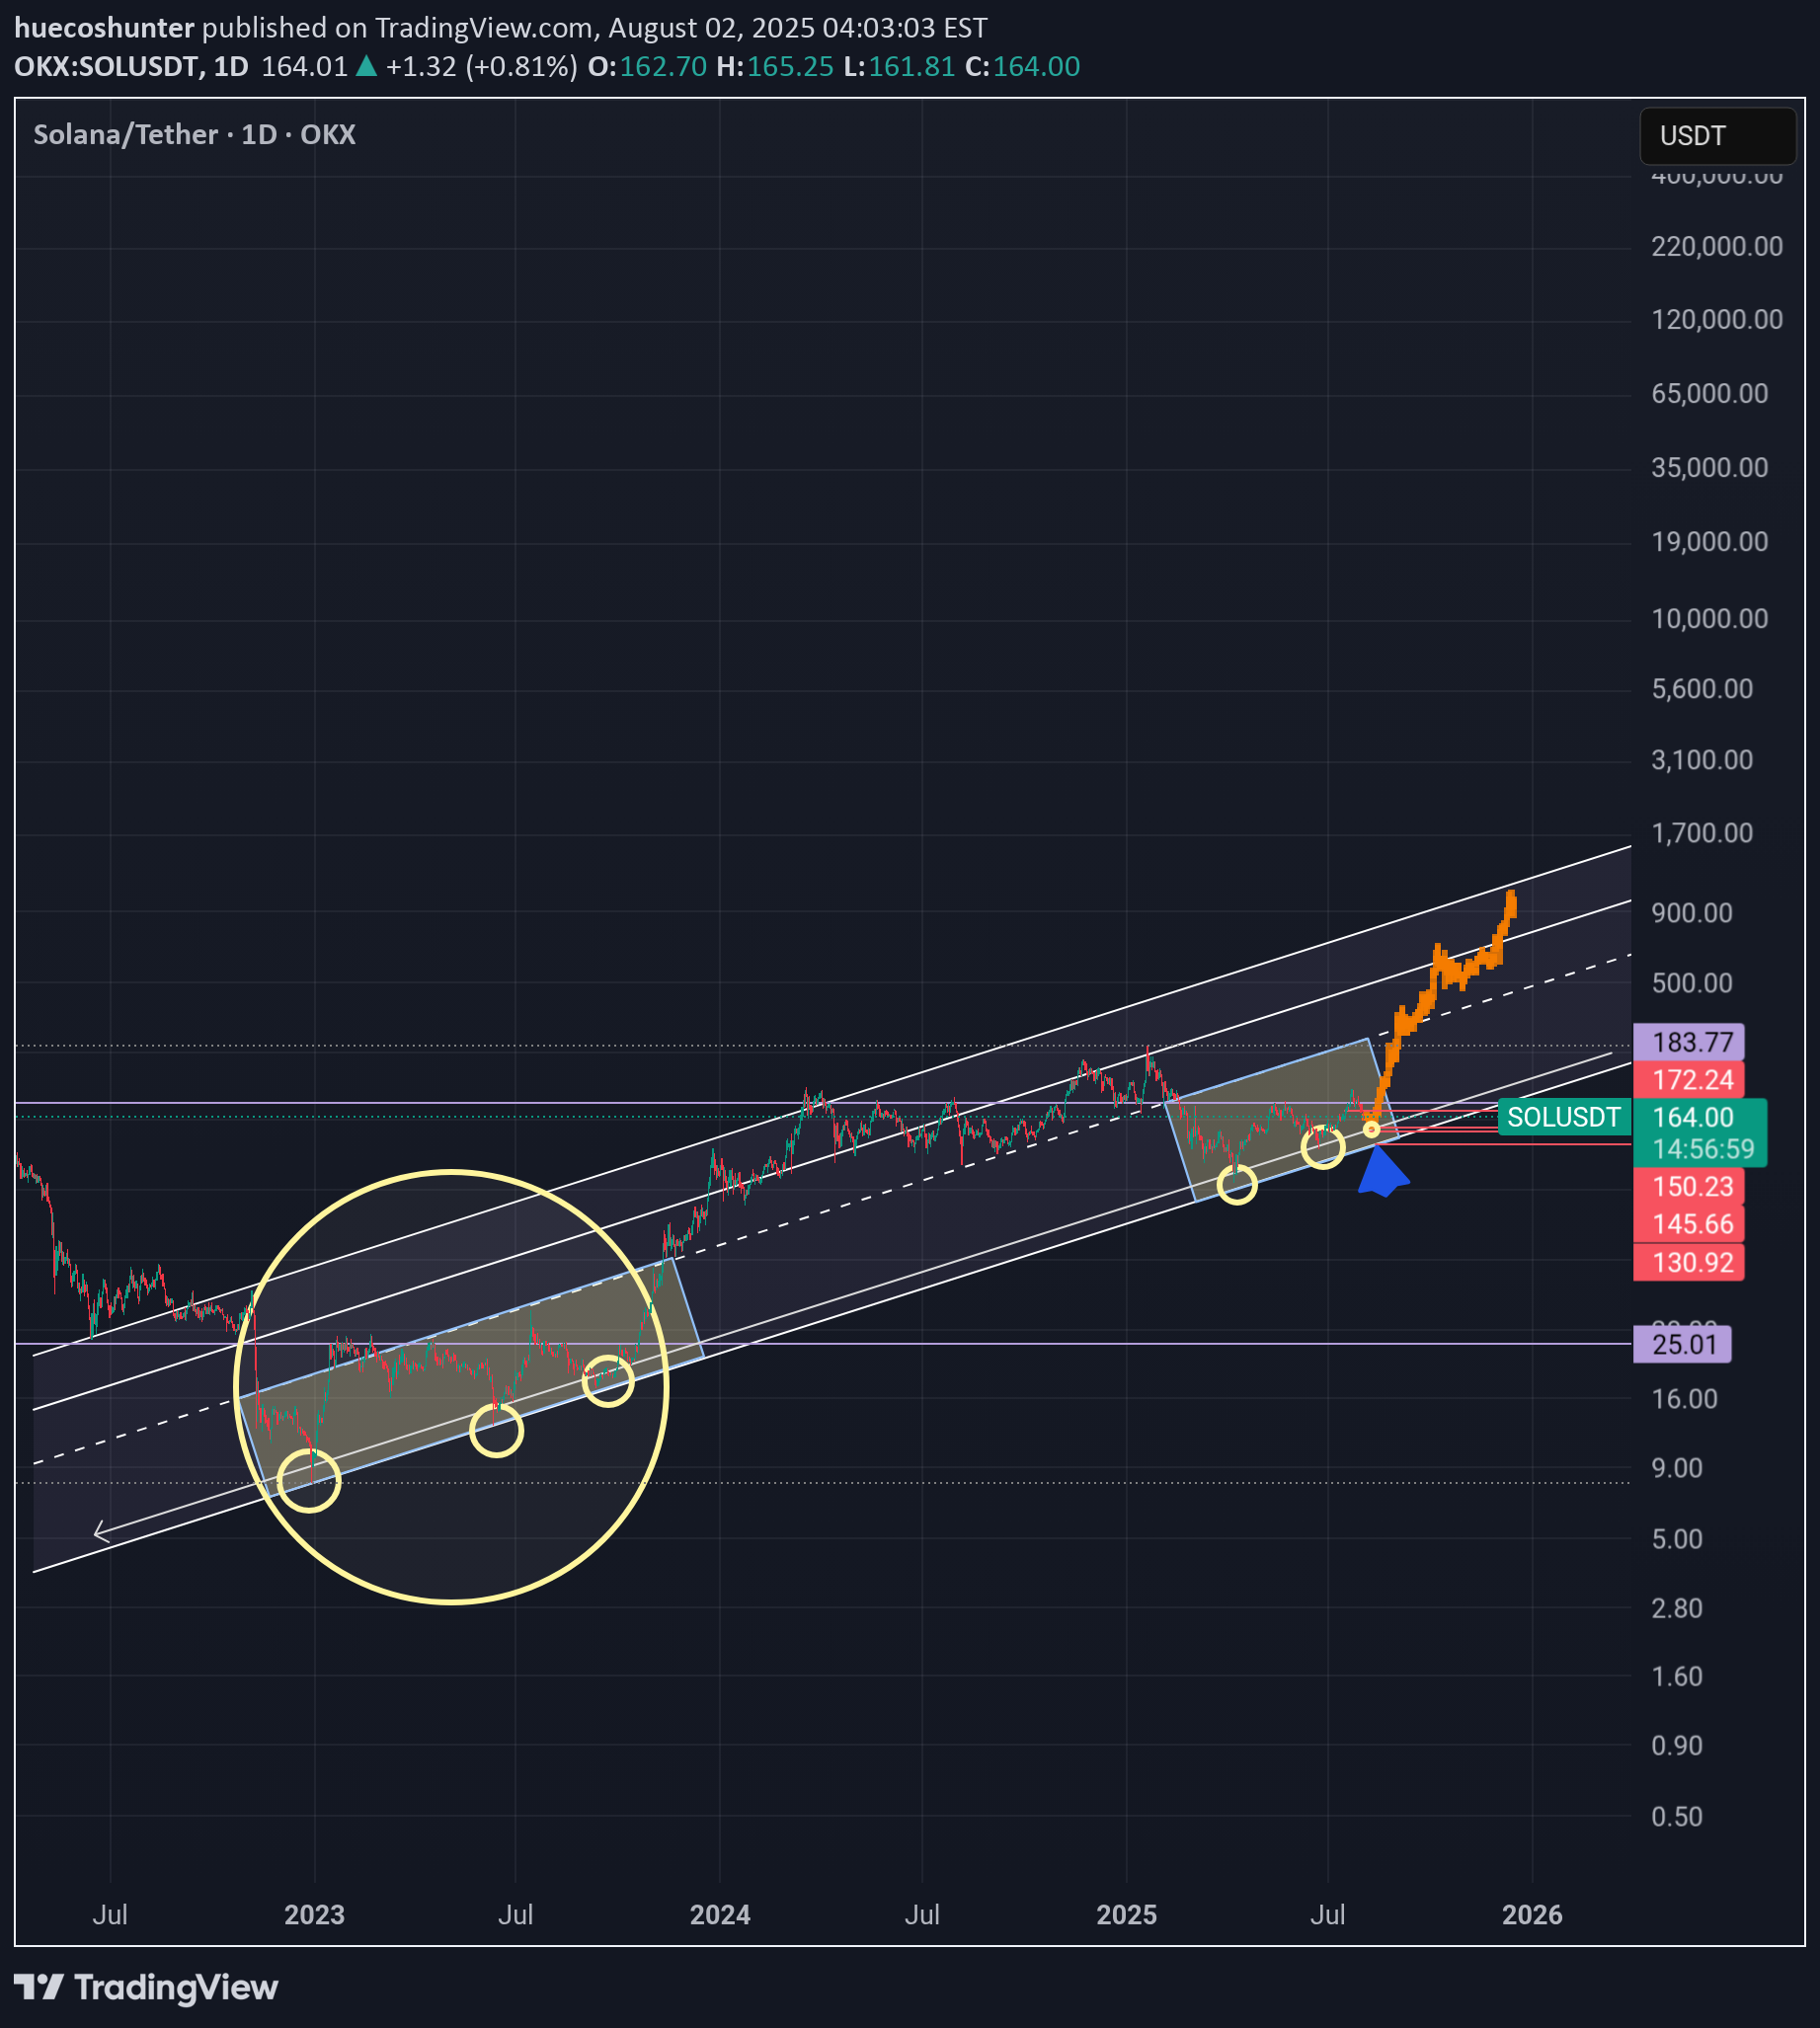
Look at 3 contact below. Currently price avout to put 3rd touch to lower zone of trend and it marks to $148-$151. After that upside move will start to gain momentum in my opinion. Macro view is still bullish roughly above $150.

huecoshunter
Downtrend not over yet !

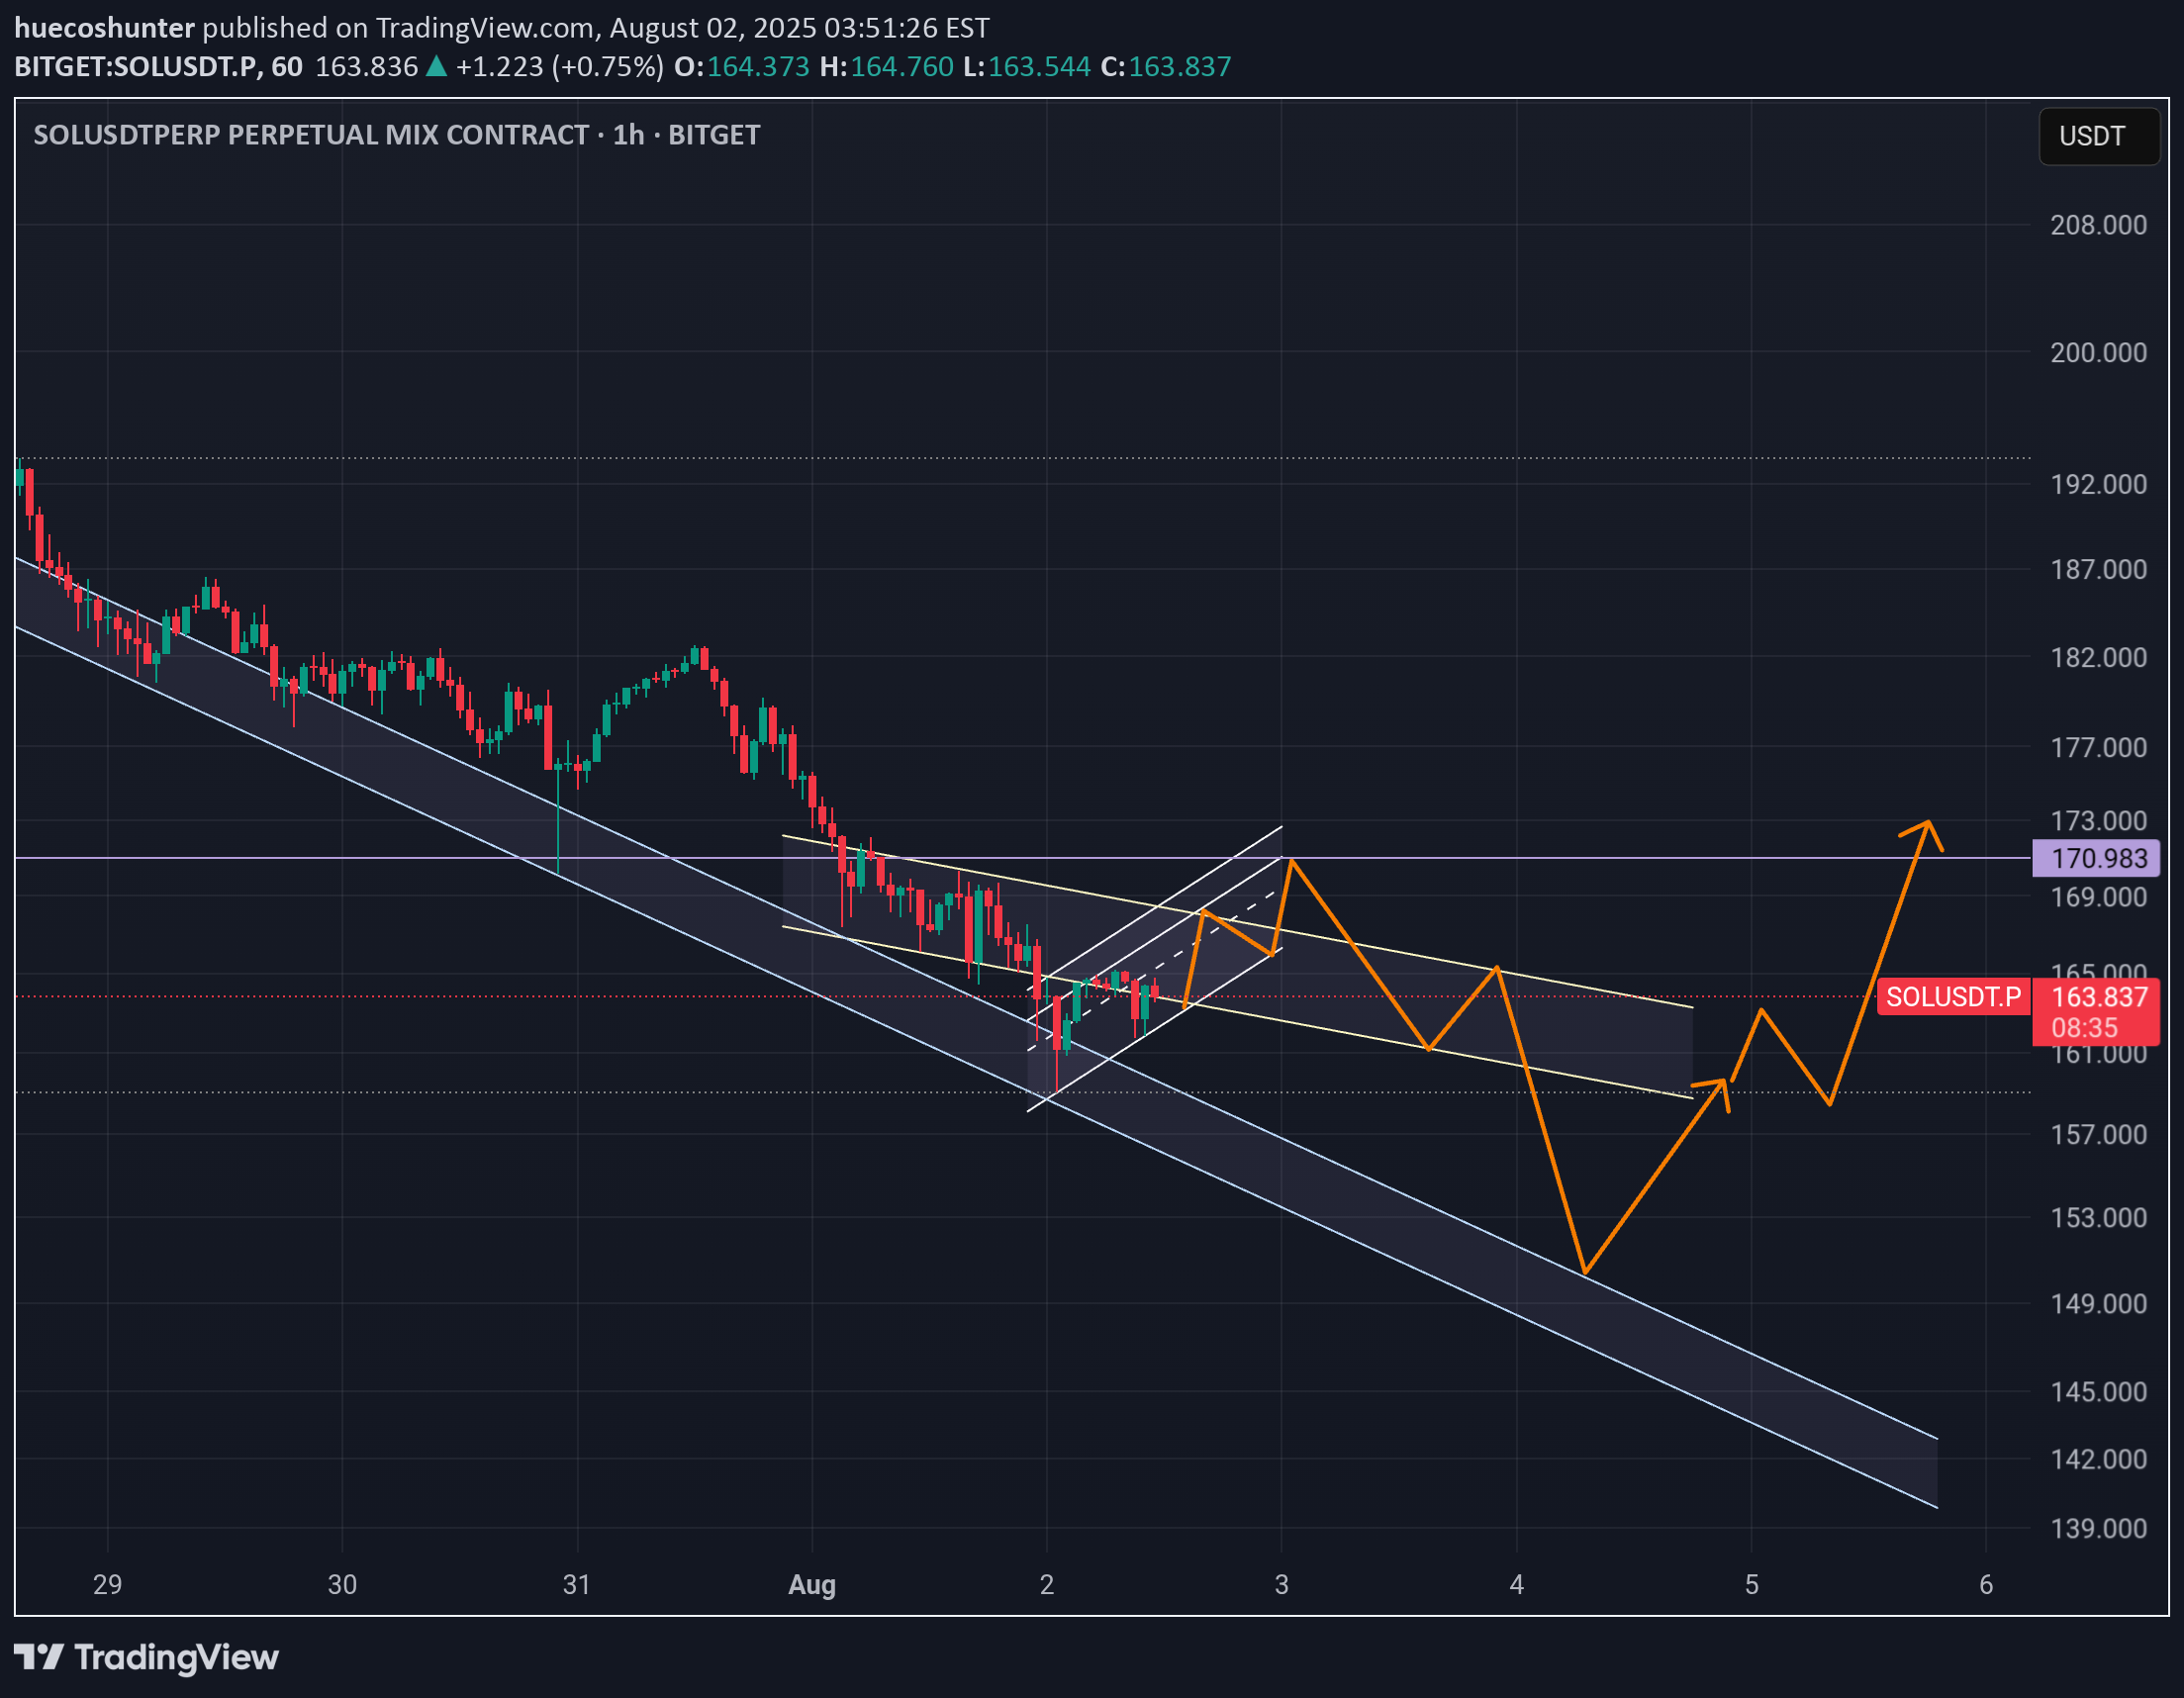
First upside attact till $171. Then continue about to $150. Up for 2 days, down for 2-4 days last time before the next mid term uptrend.

huecoshunter
SOLANA BEAR SEASON

Currently i believe that Solana already confirmed bear season last month.Monthly candles show us that price retest completed to previous 3 candles and turned direction down. In my opinion highly likely $295 was all-time-high for this cycle and price will continue to drop until the end of year.

huecoshunter
SOL / The Last 7 Months

How can Solana's last 7-month period be interpreted in 1 sentence? Starting from March 1st, the price entered a sideways phase above $125, forming 3 high and 3 low regions and after the last low, it is retesting the midline of the 7-month downtrend channel.What can be said about Solana's price direction in 1 sentence? After forming 3 high and 3 low regions in the sideways range, the price re-enters the downtrend and as long as it doesn't break below, it is expected to form a 4th high region higher than the previous three.What are the major price zones above and below? The $175.5 - $184 price zone above and the $141 - $152.5 price zone below are significant. In other words, a price staying above $152.5 is positive and inclined to move towards the upper region.

huecoshunter
W/USDT Making a Healthy Structure

The price has already doubled from $0.16 to $0.34. Done?After a 5.5-month downtrend, the price started to rise and has already doubled in just 1-2 weeks, now pausing at the main orange downtrend channel. Does this remind you of something? SUI also broke out of a 5.5-month downtrend and started to rise in its first times. Looking at the chart, we can see that the price formed a two-month horizontal bottom within the purple box during August and September. It seems to have broken above this area on September 26th. After breaking above the horizontal low in the purple box, the price has been stuck at the orange downtrend channel for the past two days. It's normal and healthy for the price to be stuck at the downtrend channel as long as it stays above the purple box. This can be interpreted as a retest of the broken level. Of course, breaking the orange downtrend channel would be more positive. For now, as long as the price remains above $0.27 - $0.28, the momentum and movement seem to be bullish. This price level is a significant support level.

huecoshunter
SUI's Impressive Performance

SUI started its upward trend when it broke through a 5.5-month downtrend shortly after its first listing times. Now, by breaking through another 5-month downtrend between April and August, it has initiated a new uptrend. In just 2 months, it has quadrupled in price, capturing the market's attention. After breaking the resistance of the blue downtrend, the price retested this level for two weeks and then continued upward. This indicates a healthy price movement. The next significant resistance level seems to be around $1.86 - $1.95. If SUI can successfully maintain its price above this level, we can expect a positive short-term view. In case of a potential pullback, we can use the orange uptrend channel as a reference. This is a healthy structure that has been in place since SUI's bottom. I believe it will provide good support during any retracements. It's upper line shows anout $1.4 nowadays.

huecoshunter
BTC İs Poised For a New All-Time-High

After bottoming out at 49K, the price formed a higher low at 52.5K.Starting from 52.5K, momentum initially created a well-defined orange uptrend channel between 6-19 September.Following the uptrend channel, a 7-day horizontal consolidation between exactly $62,600 and $64,100 filled a significant gap from 19-26 September.These points suggest that the current price increase is quite healthy.I believe the upper purple uptrend channel, which runs parallel to the orange uptrend, will be the next near-term target. This implies we can anticipate a new all-time high and an upcoming pump.

huecoshunter
Why SOL Momentum Isn't Fake This Time?

Since March 1, 2024, SOL has been holding above $126 and is about to complete its 7th month at this level.During this 7-month horizontal period, the price has formed 3 highs and 3 lows. The probability of the 4th high being even higher is greater because it has held its main support above $126 for this period, indicating a healthy accumulation.BoxesLooking at the boxes, we see that the price moved horizontally for a few days in the left blue box, then moved horizontally for a few days in the yellow box, and continued upward.Looking at the right boxes and the same price regions, we see that the best-filled low region is the blue box, which is the 3rd low region. This is because the candles in the blue box were completely contained within this price range, filling it well. This pushed the price to the yellow box region.In short, we see a price that is moving forward with a healthier accumulation compared to previous periods. This makes the picture bullish for now.We can use these box regions as support in case of potential pullbacks. If we lose these regions, we can change our minds. But it may continue upwards without spending more time there.Explanation of technical terms: Accumulation: The buying of an asset over time, often at a lower price. A healthy accumulation phase is considered bullish. Highs and lows: These refer to the highest and lowest prices reached during a specific period. Support: A price level where buying interest is strong enough to prevent the price from falling further. Boxes: These are likely referring to specific price ranges or patterns on a chart.
Disclaimer
Any content and materials included in Sahmeto's website and official communication channels are a compilation of personal opinions and analyses and are not binding. They do not constitute any recommendation for buying, selling, entering or exiting the stock market and cryptocurrency market. Also, all news and analyses included in the website and channels are merely republished information from official and unofficial domestic and foreign sources, and it is obvious that users of the said content are responsible for following up and ensuring the authenticity and accuracy of the materials. Therefore, while disclaiming responsibility, it is declared that the responsibility for any decision-making, action, and potential profit and loss in the capital market and cryptocurrency market lies with the trader.