
harmonik0
@t_harmonik0

What symbols does the trader recommend buying?
Purchase History
پیام های تریدر
Filter
harmonik0
BTCUSDT Bread and Butter & Turtle Soup Örneği XIV
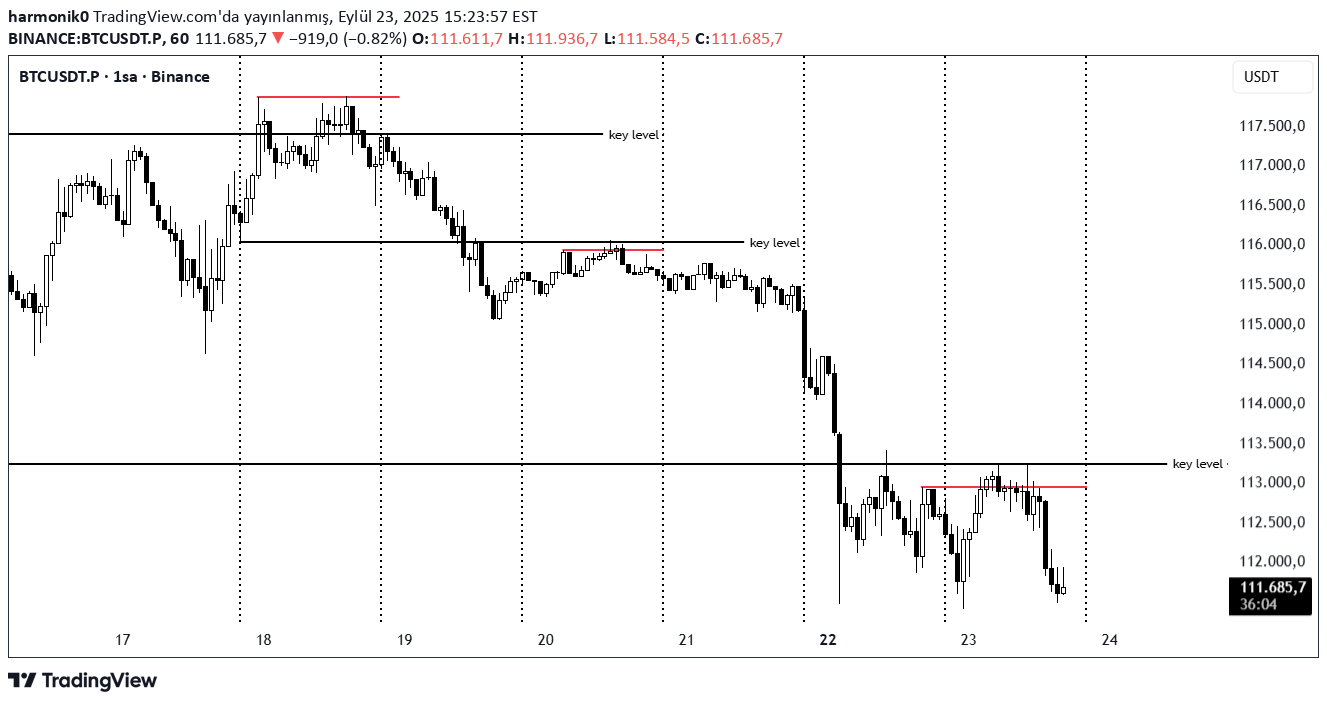
I left the daily chart up. Daily Analysis (Bias, Key Level) I mark the daily opening above/below the daily opening H1 Turtle Soup m 15-m5 csd entry There is nothing left to tell. I've been doing the same thing for a long time. This article was written while listening to Demencia Mortalis - Too Late. You can check it from my Twitter account. to the person interested x .com/heyya3131/status/1970054706249519107 x .com/heyya3131/status/1969923765833437460 x .com/heyya3131/status/1969628811039031662 x .com/heyya3131/status/1969018194967859342 x .com/heyya3131/status/196881308080835489884 and btc External Similar Things: x .com/heyya3131/status/1970546046661119232221 x .com/heyya3131/status/1970459879006708073 x .com/heyya3131/status/1970410029393297520 x .com/heyya3131/status/1970065604297072657 x .com/heyya3131/status/1970065149924118983 x .com/heyya3131/status/1968003255625228424
harmonik0
BTCUSDT 19 Temmuz 2025 Daily Bias
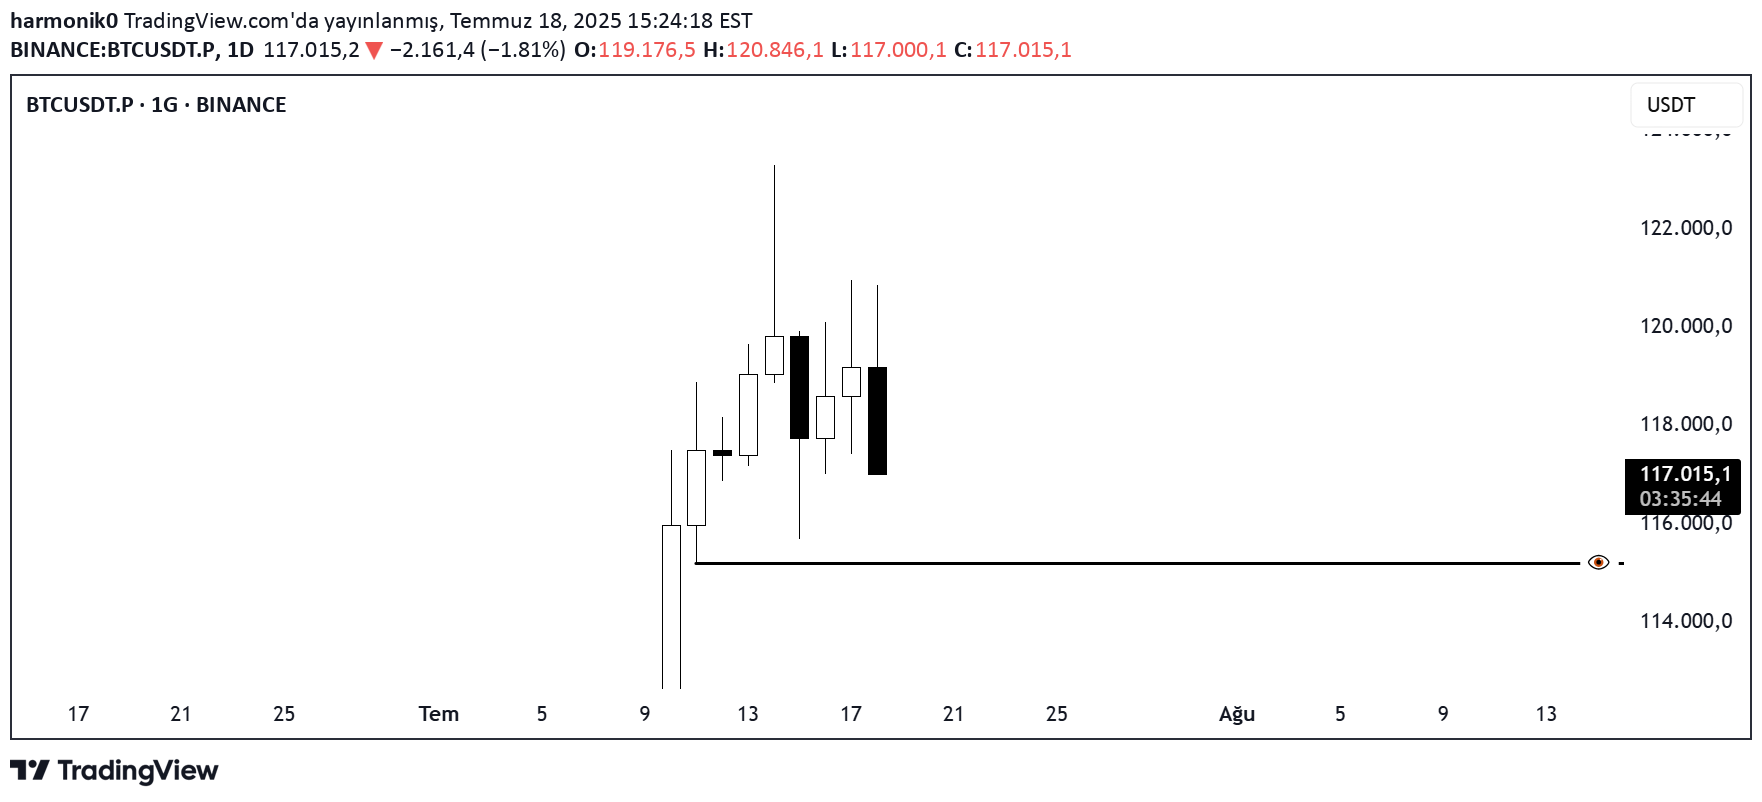
I remind you that the candle hasn't been closed yet. If the candle closes in this way, I will look for Short operations during the day until the FVGE in the diary. I was writing for a long time as if I was repeating myself in my previous articles. I add to the relevant publications Good evening.
harmonik0
BTCUSDT 3 Temmuz 2025 Daily Bias

I evaluated today's rise in ETH. I add to the relevant publications. Now let me get a bother.
harmonik0
SOLUSDT 28 Haziran 2025 Daily Bias

I thought I could call long in other coins because I was Long Biasli. Bitcoinde also actually Equal Highs I tried to smoke me that burned me. Equal highs seem to be very good. If we wait for another day candle, it isn't bad, it is hayrola at night
harmonik0
BTCUSDT 25 Haziran 2025 Daily Bias

5 June began to take the low of June began to rise. ETH had a beautiful target liquidity like Weekly FVG. I evaluated recently. I add them to the relevant shares. Swing Higha is quite close. If you look at the 1 -hour graph, there is a trend liquidity. If Swing Higha gets the trend liquidity without going, I will call a turtle. I am a trade and I just enter the process with Turtle SUP.I.i. Draw on liquidityii. Daily Openiii. turtle
harmonik0
ETHUSDT Weekly Outlook

Let me comment as I did in BTC last BTC. I add to the relevant shares. It was very close to the FVG in the FVG, but without touching the liquidity of the accumulation and came to the following FVG. for me. From my point of view. I don't have a problem like capturing the bottom of the hill and I am not in favor of a reversal trade because it is risky to me. (If there is a reversal. He is also a separate subject) So if we see Bulish candles on the diary alt an Orderflow in the time period we can say. I already look at the time period alt Also look at the daily. After that, after the opening within the day, I call a turtle. It sounds safer to me. I attract your attention, I am a day trade. Here he enters the rank and then takes the range high liquidity and looks down or something. I am the guy I am.
harmonik0
ETHUSDT Bread and Butter & Turtle Soup Örneği XIII

Bread and Butter & Turtle Soupi. Determine the liquidity target in daily. Daily opening markleiii. Bakiv to the economic calendar. The target liquidity is expected to intake liquidity against liquidity. Following movement to the target liquidity after liquidity intake. CSD, FVG, Breaker. Make the processing entry in one of the Killzones. I'm doing it. Daily is the time period I feel safe. In some parities, I do it weekly and only in Nasdaq. I have 3 lines in my graph. The Chi is wrapping. I participated in the pi network event years ago. With btc it falls along with AW haha. It would be good if he had risen. We ate for free
harmonik0
ETHUSDT – Trade Recap & Daily Bias for June 21

Trade Recap (June 20): I. First thing I did was mark out a DOL on the daily — price was hovering near a swing low, and I started noticing trend-side liquidity building up on the lower timeframes. So my directional bias for today was short. II. I marked the daily open. III. With a short bias in mind, I waited for a Turtle Soup setup right above the daily open. IV. The equal highs above were clean and obvious — textbook liquidity. V. Once that liquidity was swept, I dropped to the M15 to watch how price reacted — waited for a clean displacement away from that zone before getting involved. Daily Bias (June 21): Still leaning short. We’re pretty close to a weekly FVG, which might act as a magnet. If price forms liquidity during the day and takes it out in-session, I’ll look to short again. Bread and Butter & Turtle SoupWasn’t really feelin’ it 'cause it’s the weekend, so I didn’t fully trust the setup — but hey, we took something. Stop’s at entry.
harmonik0
ETHUSDT Trade Idea

First of all, I am undecided about taking the process today. I say why not take the range low liquidity before going up? Under 2,433. They stacked the stops. Let's not explode? shouldn't we get a wick? Is it rich or support resistors? At least we will take the liquidity of the June 13 low. How to buy Equal Highs, whether it is taken, then how it moves. What do you think without? So Range. So the horizontal market. In other words, there is no trend market. I can't say it's very reliable. I wasn't waiting for it so fast, I saw the commentary of the DEBTC Shortlasa eth. When I said to comment on him, we stayed in my mind, we took the process in ETH at the entrance. Bread and Butter Made
harmonik0
BTCUSDT Bread and Butter & Turtle Soup Örneği XI

i. I start with identifying bias in the daily graph. ii. He had started to rise from the weekly FVG and came to OB by leaving Equal Highs. He tried to rise again and did not succeed again and came back. After the fall on June 17, now I think that the liquidity should be found from the bottom of the swing low. I say this swing low can attract this price.iii. I mark the daily opening. I am looking for a turtle on the opening. After taking the liquidity of a swing high from yesterday, I expect the M15 graph to get away from there. As the first target, of course, I don't target the Swing Low on the daily. Even if there is a low probability, I get snow from a place that is likely to return in that day. In this example, there was a trend liquidity that would look better when we went down to the alt time period. where I set as a swing low. I take the wife here and pull the stob to the entrance level. Then I get a stop from the entrance. Bread and Butter was done. We took the daily wife and left. The price does not need to go to the target you set, he says. Bias identify and get 15-20 pips. With a candle, he again threw it over the liquidity. There are Equal Highs above. Personally, I would wait for another day and then look for longing. However, after determining the bias I want to say, the only thing I have to do is to wait under the opening or on a turtle. Of course, my Turtle Soup.twitter page is full of these examples. Because I only take the process in this way.x.com/Heyya3131/Status/1935124404176097719bias when determined correctly. NQ M15 OHLC-OLHC & TURTLE SOPAYRICA I was a long biaslıy on 17 June. My daily bias was wrong, as you can see. equal lowların likiditesi alındıktan sonra işleme girip swing highda kar alıp stop entry yapmıştım.paylaşmıştım eski gönderilerimde bulabilirsiniz.x.com/heyya3131/status/1935011725209976908bread and butter & turtle soupjpn'de de şunu iyi kaçırdım ama gerçi o saatte işlem almazdım. I went to the Equal Highs before Asia started. I barely progressed, I pulled the stob to the entrance without snow. What happens. We stayed with excitement, nothing happened in the process. I guess I wrote it under the head of the head.
Disclaimer
Any content and materials included in Sahmeto's website and official communication channels are a compilation of personal opinions and analyses and are not binding. They do not constitute any recommendation for buying, selling, entering or exiting the stock market and cryptocurrency market. Also, all news and analyses included in the website and channels are merely republished information from official and unofficial domestic and foreign sources, and it is obvious that users of the said content are responsible for following up and ensuring the authenticity and accuracy of the materials. Therefore, while disclaiming responsibility, it is declared that the responsibility for any decision-making, action, and potential profit and loss in the capital market and cryptocurrency market lies with the trader.