
globulltrader
@t_globulltrader

What symbols does the trader recommend buying?
Purchase History
پیام های تریدر
Filter
globulltrader
COIN $1500
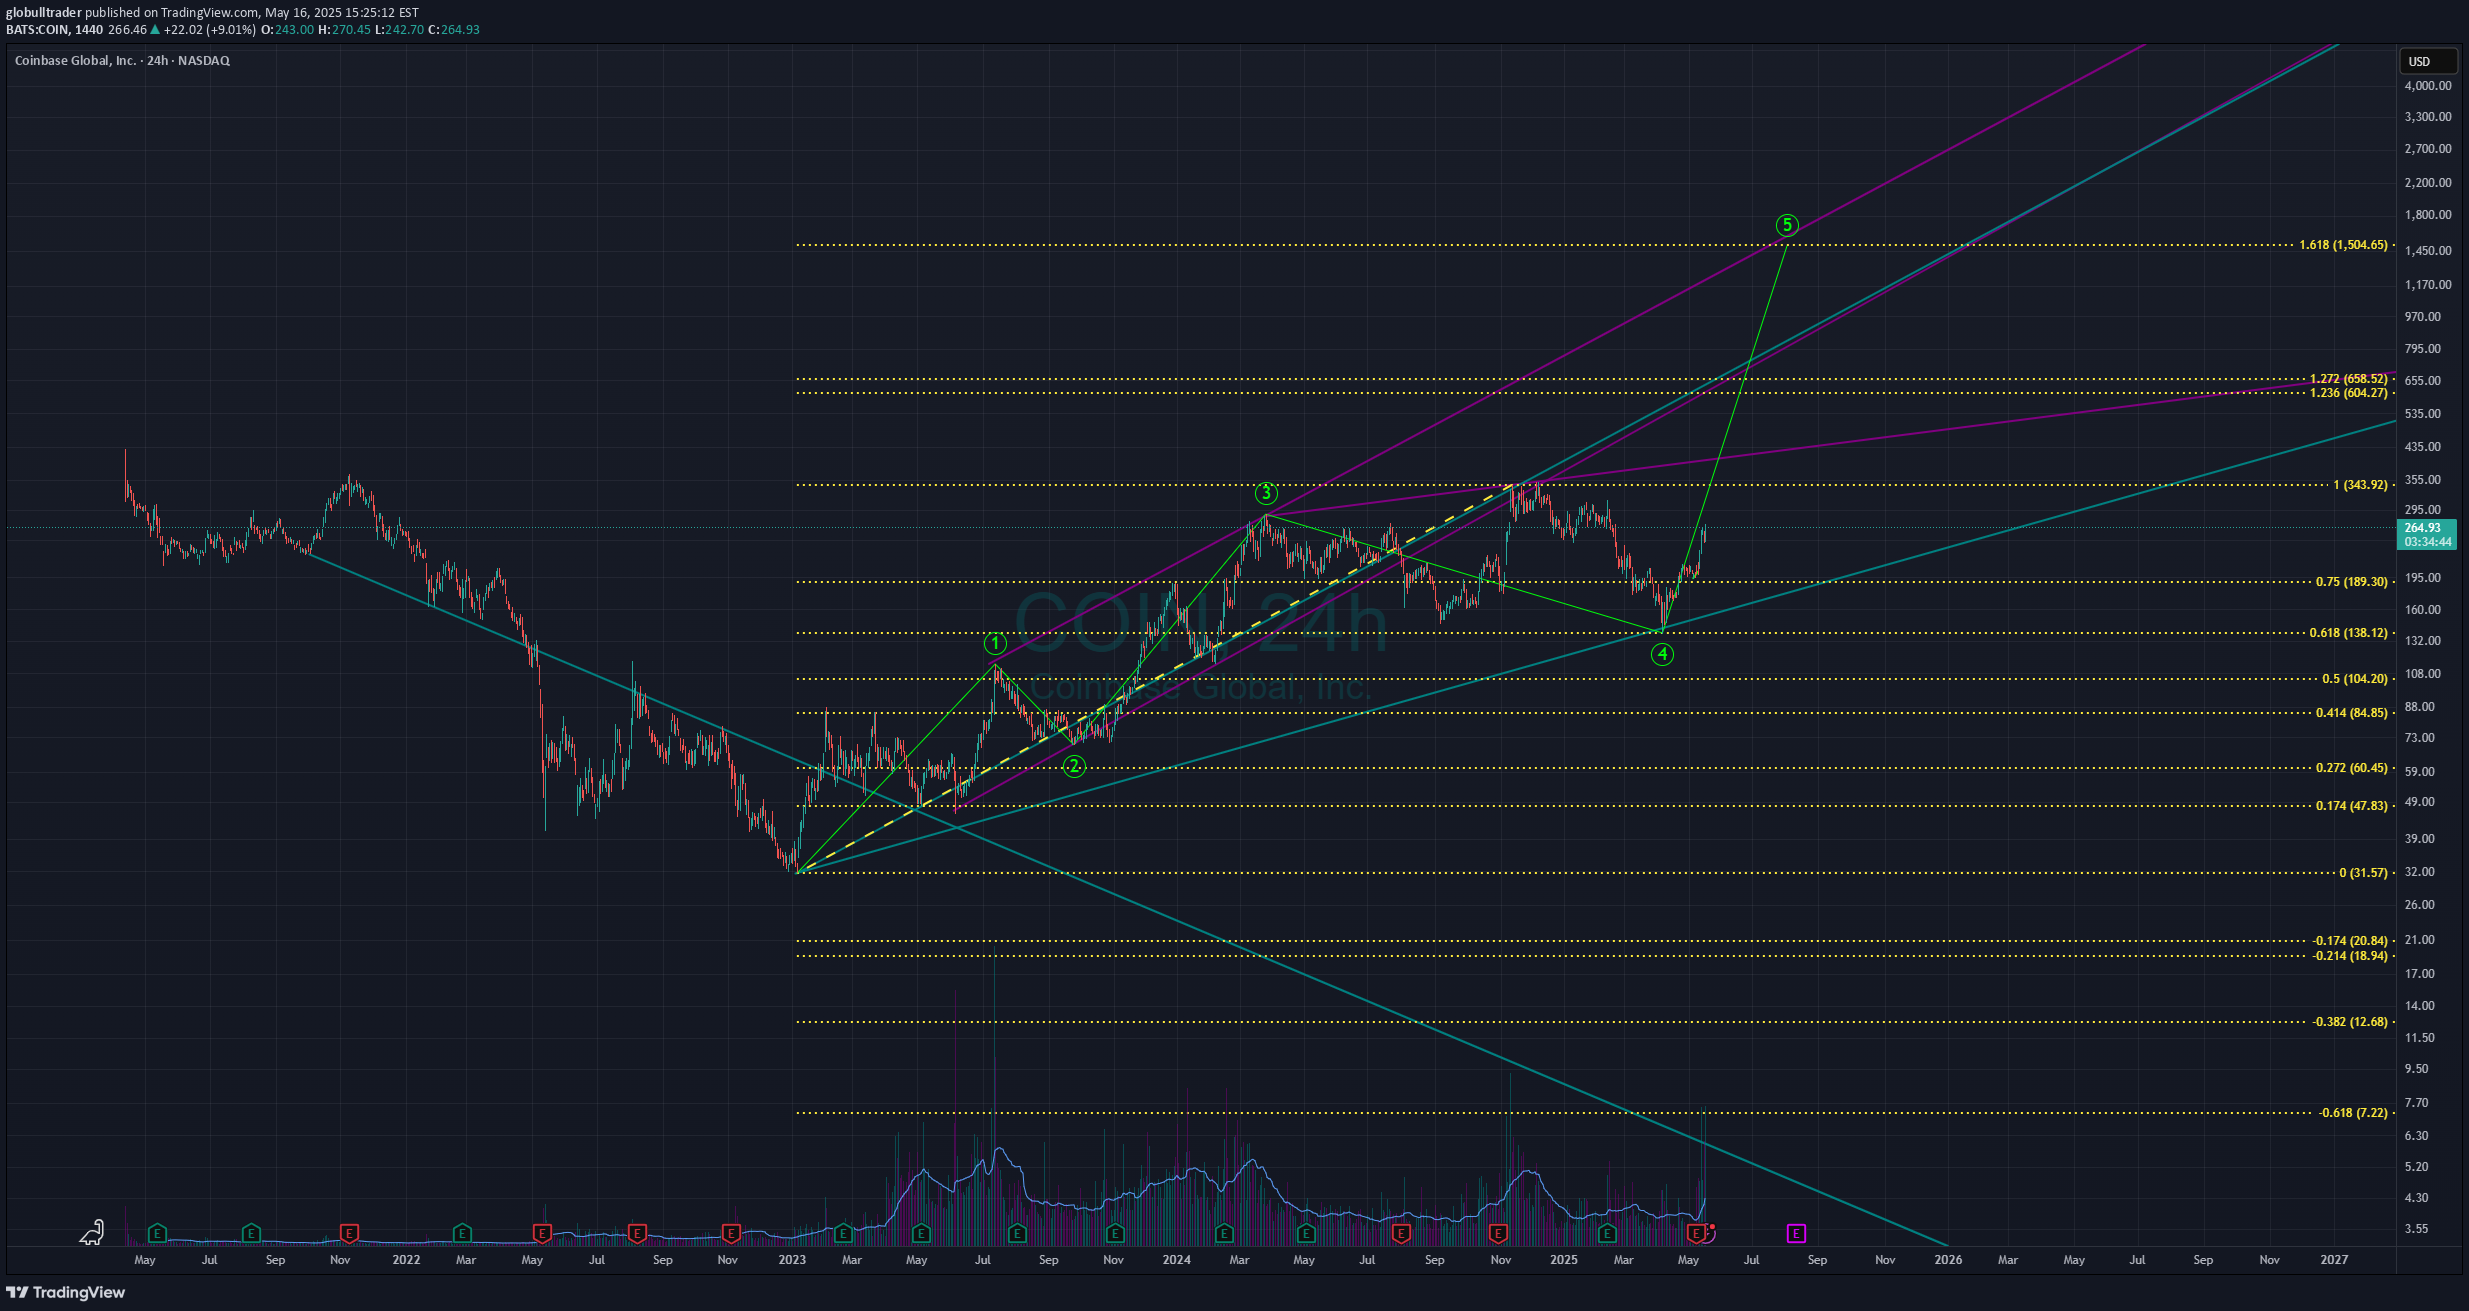
Let’s analyze how the coin, trading at $264.99, can reach the 1.618 Fibonacci target of $1,504.65, using first principles and focusing on the chart’s technical setup without referencing the trend line labels. **1. Starting Point**: The coin is at $264.99 on a 4-hour chart, near a lower trend line around $260-$300 where the price has previously found support. This suggests potential for an upward move if buyers step in. **2. Elliott Wave Framework**: The chart shows a completed five-wave structure followed by a three-wave correction. At $264.99, the coin is likely beginning a new impulsive wave (e.g., wave 1 or C of a larger pattern), which often targets Fibonacci extensions like 1.618. **3. Fibonacci Target**: The 1.618 Fibonacci extension is at $1,504.65, a typical target for impulsive waves. This level is calculated by projecting the length of a prior wave from the current base around $260-$300. **4. Key Levels**: - **Resistance**: A descending trend line around $600-$700 acts as the first major barrier. Breaking above this with strong momentum signals a bullish continuation. - **Support**: The $260-$300 area must hold to maintain the uptrend. A break below could indicate a reversal. **5. Path to $1,504.65**: - From $264.99, the coin needs to rally, breaking the $600-$700 resistance to confirm the uptrend. - An intermediate Fibonacci level around $975 may pose minor resistance, but a strong trend should push through. - The $1,239.66 move ($1,504.65 - $264.99), a 468% increase, requires sustained buying pressure. **6. Market Dynamics**: Impulsive waves rely on strong buyer momentum. If volume and market sentiment align, the coin can climb steadily. Failure to break $600-$700 or a drop below $260 would challenge the bullish scenario. **Conclusion**: The coin at $264.99 can reach $1,504.65 if it holds above $260, breaks the $600-$700 resistance, and maintains bullish momentum. The Elliott Wave and Fibonacci structure supports this target, but the price levels suggest this isn’t Bitcoin. Watch the $260 support and $600-$700 resistance for confirmation.
globulltrader
$BTC Flipping Resistance to Support?!

Based on the provided image and the context from the web results, here's a layered analysis:🔍 Analyzing the #BTCUSD Weekly Chart at All-Time Resistance!We're currently witnessing Bitcoin testing an all-time resistance trendline, which is a significant milestone in its price history. Here's a detailed look:1️⃣ Initial Growth: From late 2017 to early 2019, Bitcoin saw a significant rise, peaking at around $20,000 before correcting.2️⃣ Bear Market: Post-2019, Bitcoin endured a prolonged bear market, hitting lows around $3,000.3️⃣ Recovery Phase: The recovery began in 2020, with Bitcoin breaking through previous resistance levels.4️⃣ Bull Run: The 2021 bull run pushed Bitcoin to new heights, surpassing $60,000.5️⃣ Current Trends: Bitcoin has now reached an all-time resistance trendline, and according to Elliott Wave Theory, we still have the second half of the 3rd wave to complete. This suggests potential for further bullish movement. Possibly flipping the trendline from resistance to support. The chart also features:🟣 Ascending trend lines showing the overall bullish trend.🔴 Purple lines indicating potential resistance points.🟢 Green lines highlighting support levels.Given Bitcoin's position at this critical resistance trendline, the question arises: Will this now flip resistance to support and begin the new age of Bitcoin? According to Elliott Wave Theory, if Bitcoin successfully breaks and sustains above this resistance, it could indeed flip it into support, signaling the start of a new bullish phase. This would align with the completion of the 3rd wave, which is often the strongest in the sequence, indicating a powerful continuation of the trend. However, this is contingent on several factors including market sentiment, regulatory news, and broader economic conditions. While the technical indicators are promising, the real-world impact of these factors cannot be underestimated. What do you think about Bitcoin's potential to break this resistance and enter a new era? Share your thoughts below! 🚀💹Please note that this analysis is based on the provided chart and general knowledge from related web results. For specific predictions, always consider multiple sources and do your own research.
globulltrader
Master Accumulation
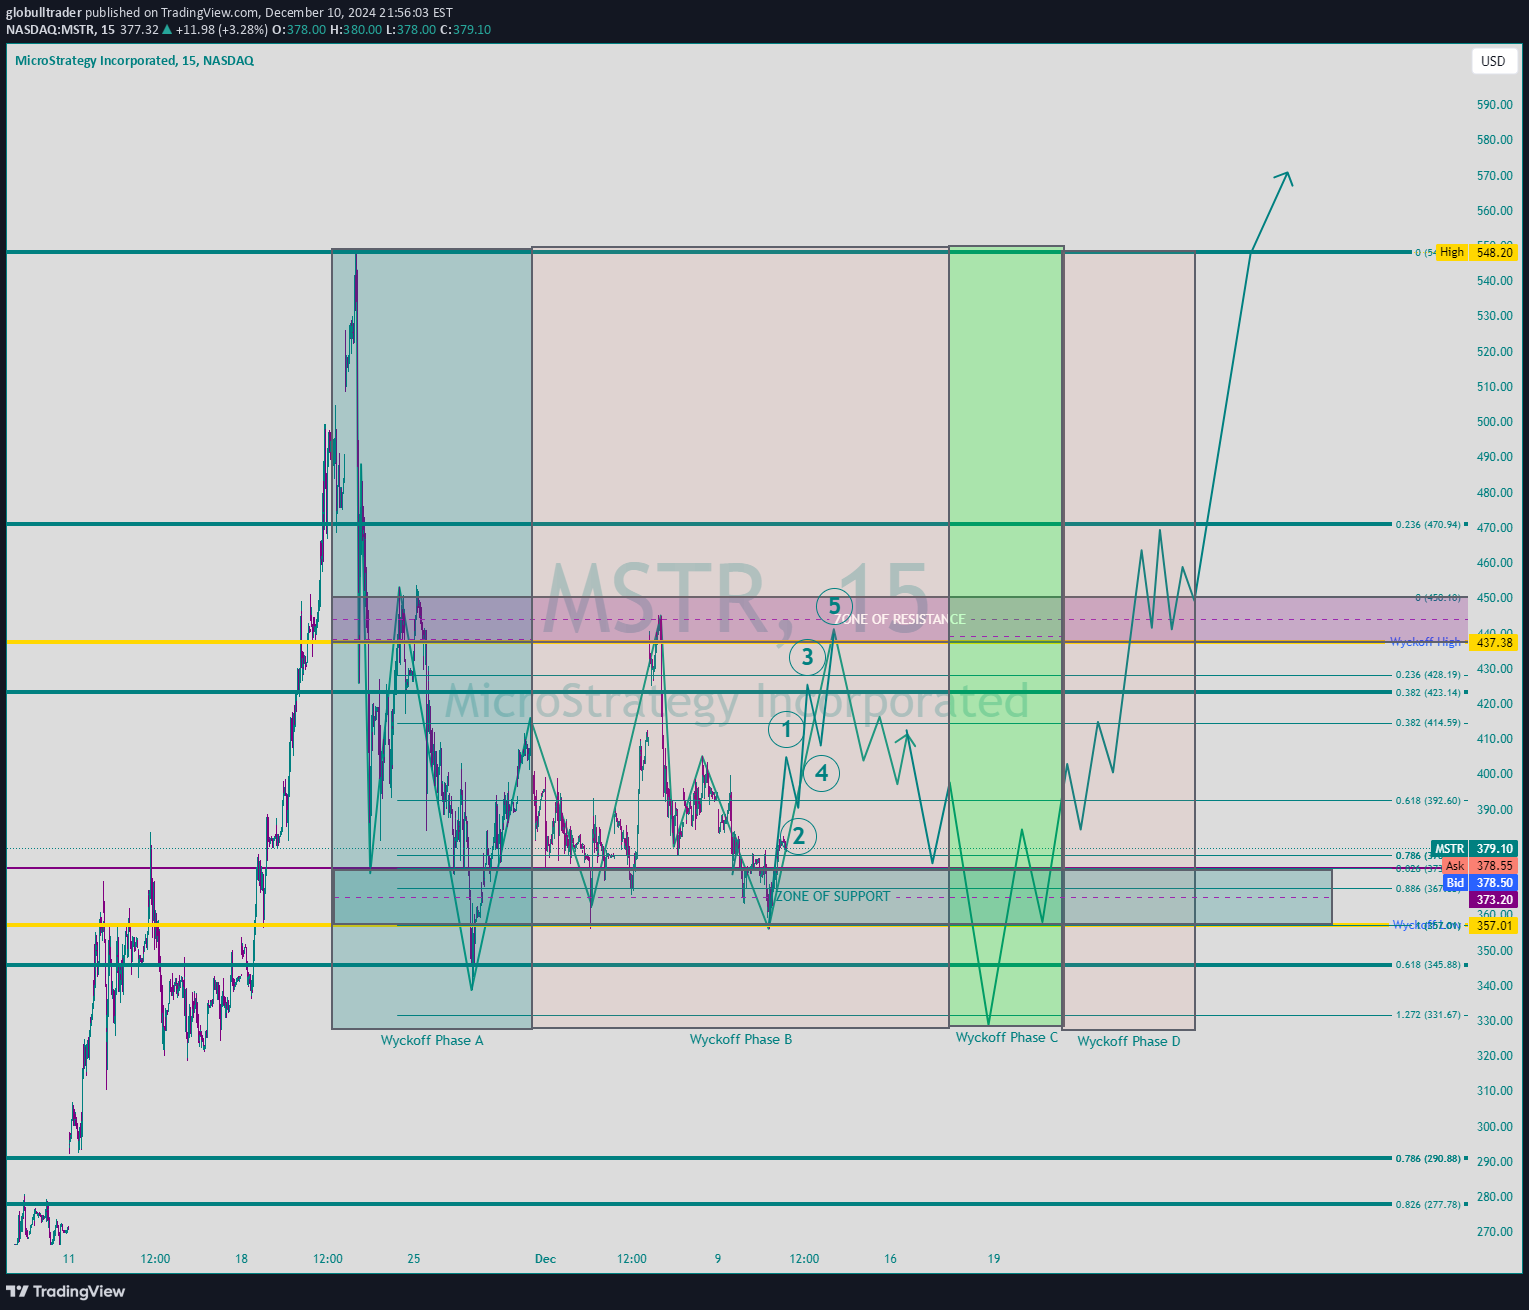
Wyckoff Spring: This setup is like the stock market's own version of a magic trick. It's when the stock price dips into a "zone of support" (the lower purple area) and then springs back up, suggesting that the price might be about to take off. It's the financial equivalent of watching a diving board bend before someone launches themselves into the air. The Phases: Wyckoff Phase A (Preliminary Supply): Here, the stock is like a balloon being filled with air, showing initial resistance before it pops into action. This is where accumulation starts. Wyckoff Phase B (Secondary Test): This phase is like the balloon being squeezed and released repeatedly to see how much pressure it can take. The stock tests the waters, going back to the support and resistance zones. Wyckoff Phase C (Spring): The critical moment, like when the balloon almost touches the ground but doesn't pop. The stock dips into the support zone but then springs back, indicating a potential upward move. Wyckoff Phase D (Upward Movement): Finally, like a balloon released into the sky, the stock price starts to ascend, signaling it's time for the bulls to take over. Zones of Support and Resistance: These are like the invisible walls that the stock price bounces off. The "Zone of Support" (bottom purple area) is where sellers might hesitate, and the "Zone of Resistance" (top purple area) is where buyers might pause. The Five Points on the Chart: Each numbered point represents key moments in the Wyckoff setup, from the initial dip, tests, the spring, and the eventual break upwards. It's like marking the chapters in an epic saga of price movements. The Trend: After the spring, if the stock breaks through the resistance, it's like the hero overcoming the final obstacle, signaling a new trend might be starting. In essence, this chart is like watching a financial ballet, where each move is calculated, each step deliberate, aiming towards a grand finale of price movement. For traders, recognizing these patterns is like having a backstage pass to the market's next big act. Remember, in the stock market, as in life, the spring is the thing that precedes the leap!
Disclaimer
Any content and materials included in Sahmeto's website and official communication channels are a compilation of personal opinions and analyses and are not binding. They do not constitute any recommendation for buying, selling, entering or exiting the stock market and cryptocurrency market. Also, all news and analyses included in the website and channels are merely republished information from official and unofficial domestic and foreign sources, and it is obvious that users of the said content are responsible for following up and ensuring the authenticity and accuracy of the materials. Therefore, while disclaiming responsibility, it is declared that the responsibility for any decision-making, action, and potential profit and loss in the capital market and cryptocurrency market lies with the trader.