
fxtraderanthony
@t_fxtraderanthony

What symbols does the trader recommend buying?
Purchase History
پیام های تریدر
Filter
fxtraderanthony
BTC at a Critical Weekly Level: Watching for a Bullish Reaction
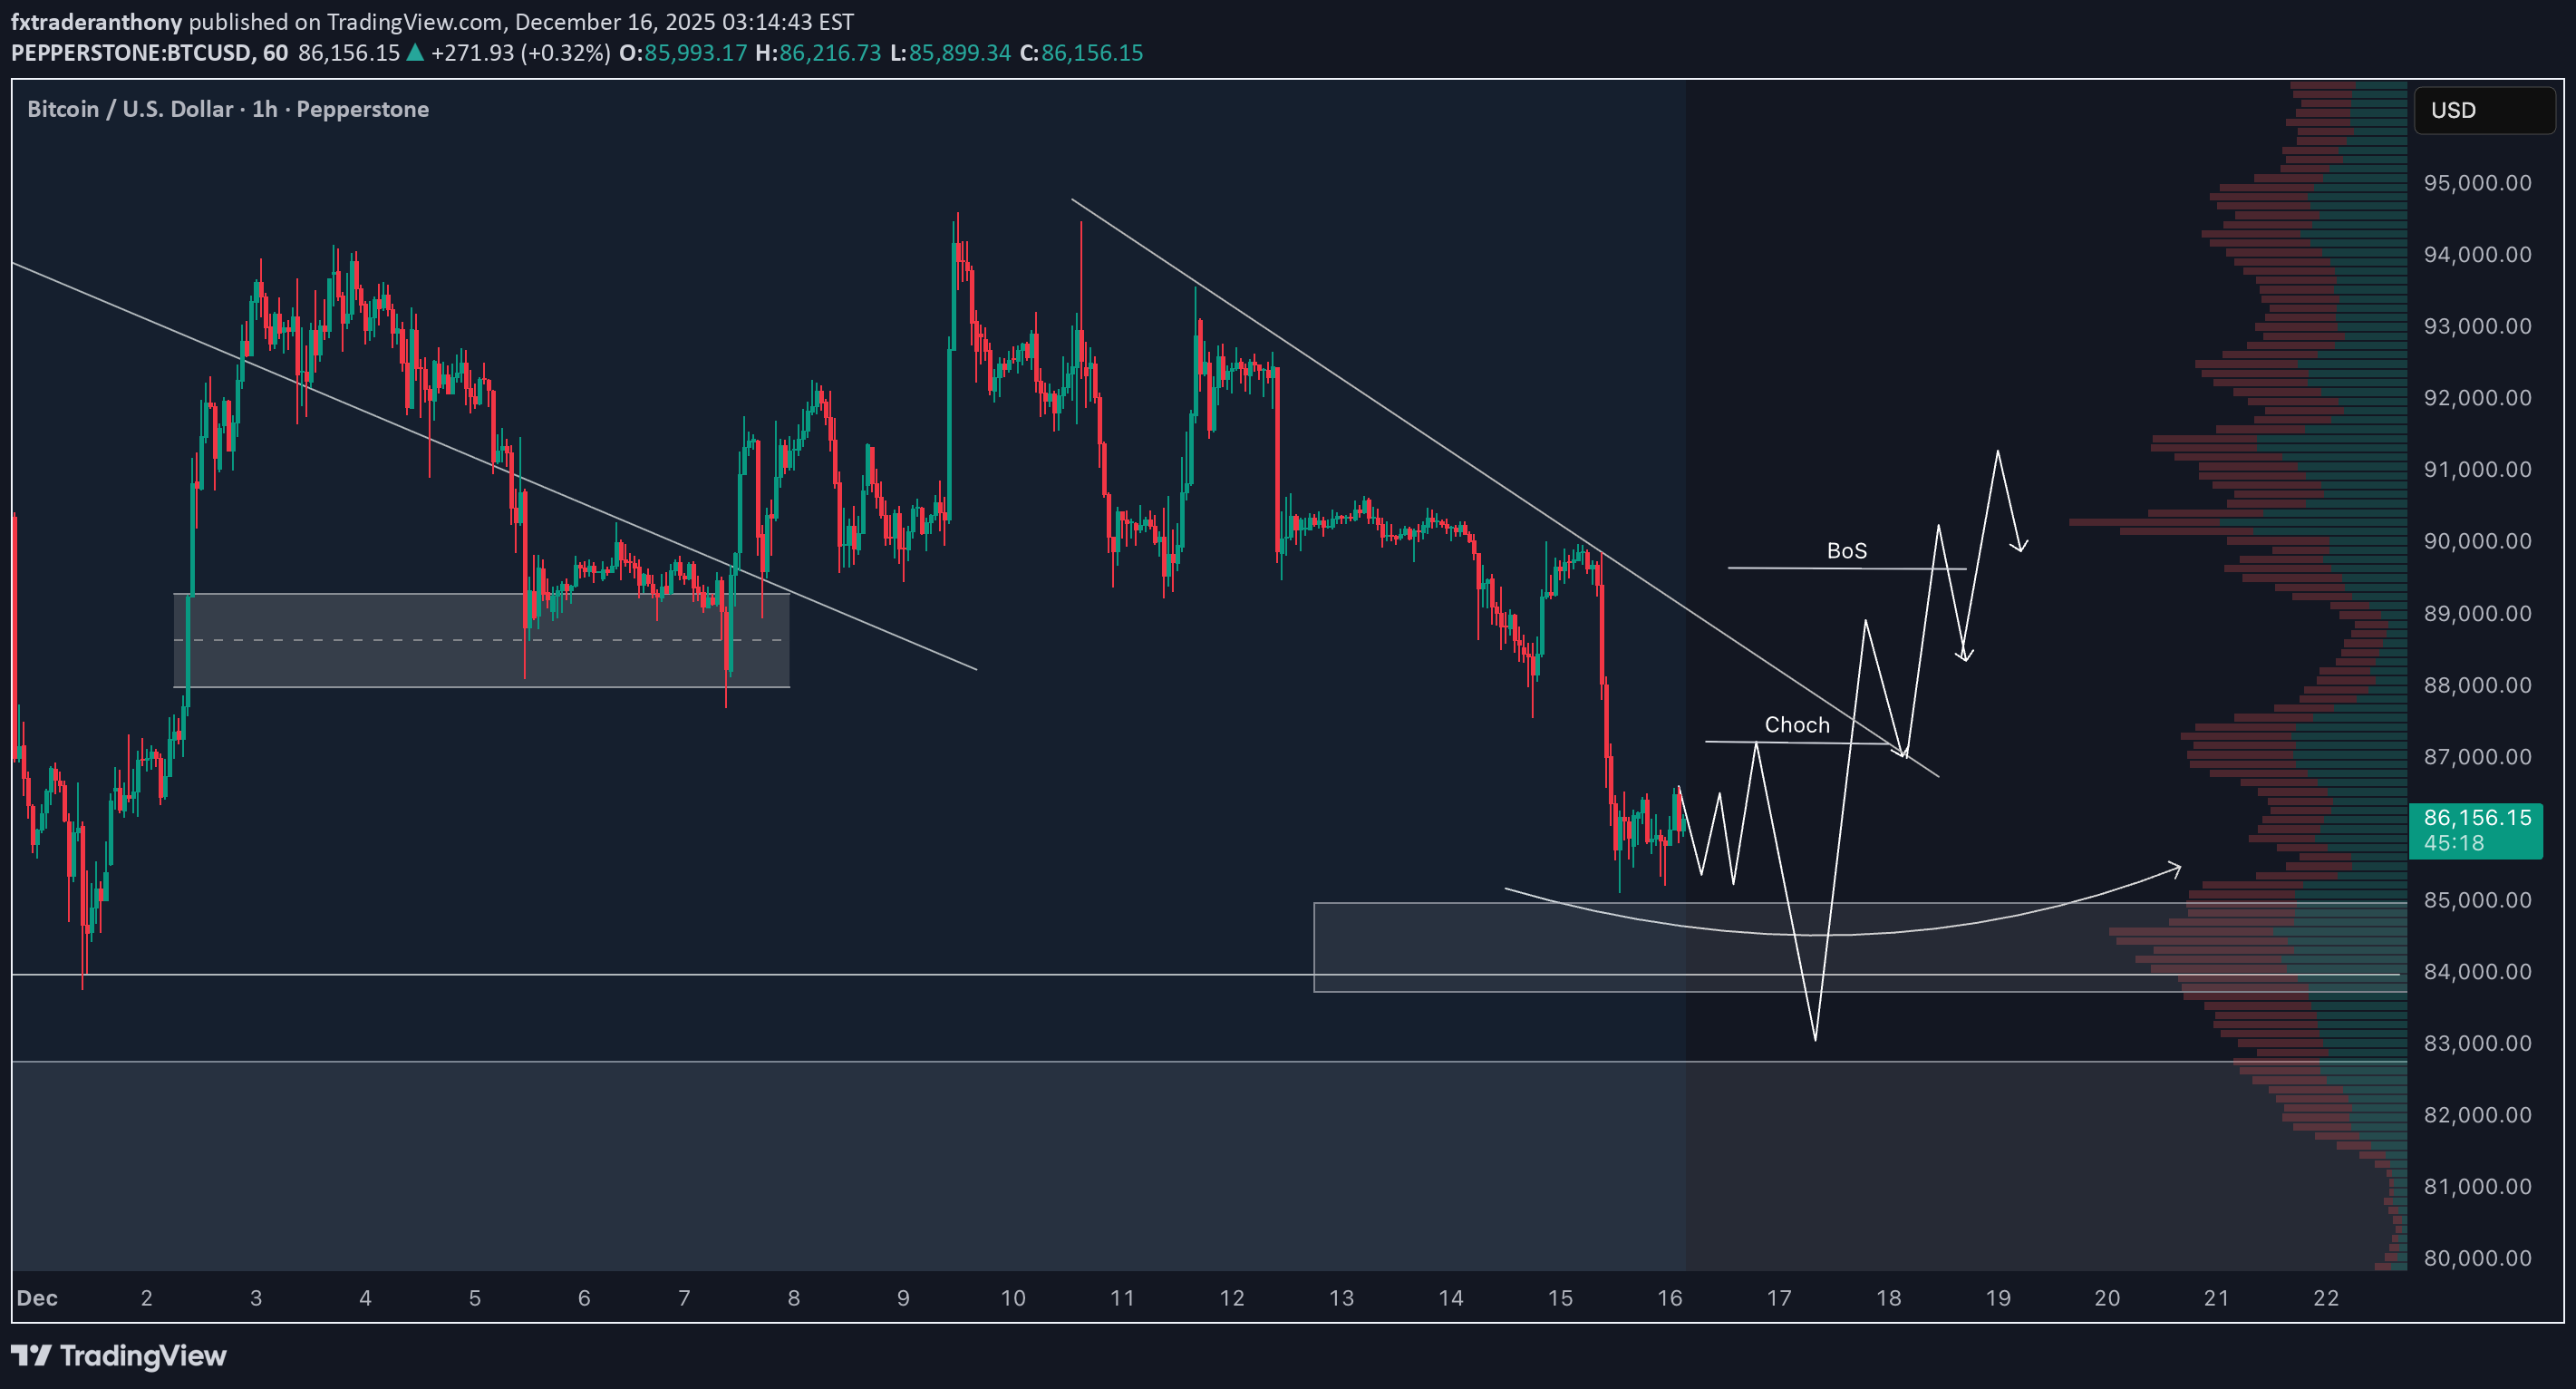
BTC Bitcoin has seen a fairly aggressive bearish pullback, but when we zoom out to the weekly time frame, price has now retraced directly into a weekly bullish order block 🧱📊. This area represents a key support zone that I’m watching closely. 📈 If this level holds and we start to see bullish price action, it could open up a strong opportunity as we drop down into the lower time frames. From there, I’ll be focusing on the 1-hour chart, watching market structure and price behavior to see if conditions line up for a potential entry. ⏳ As always, patience is key — I’ll only get involved if price does exactly what I’ve outlined in the video. ⚠️ Not financial advice — this is simply my market analysis.
fxtraderanthony
XAUUSD Gold Breaks Structure Short, But My Bullish Bias Remains
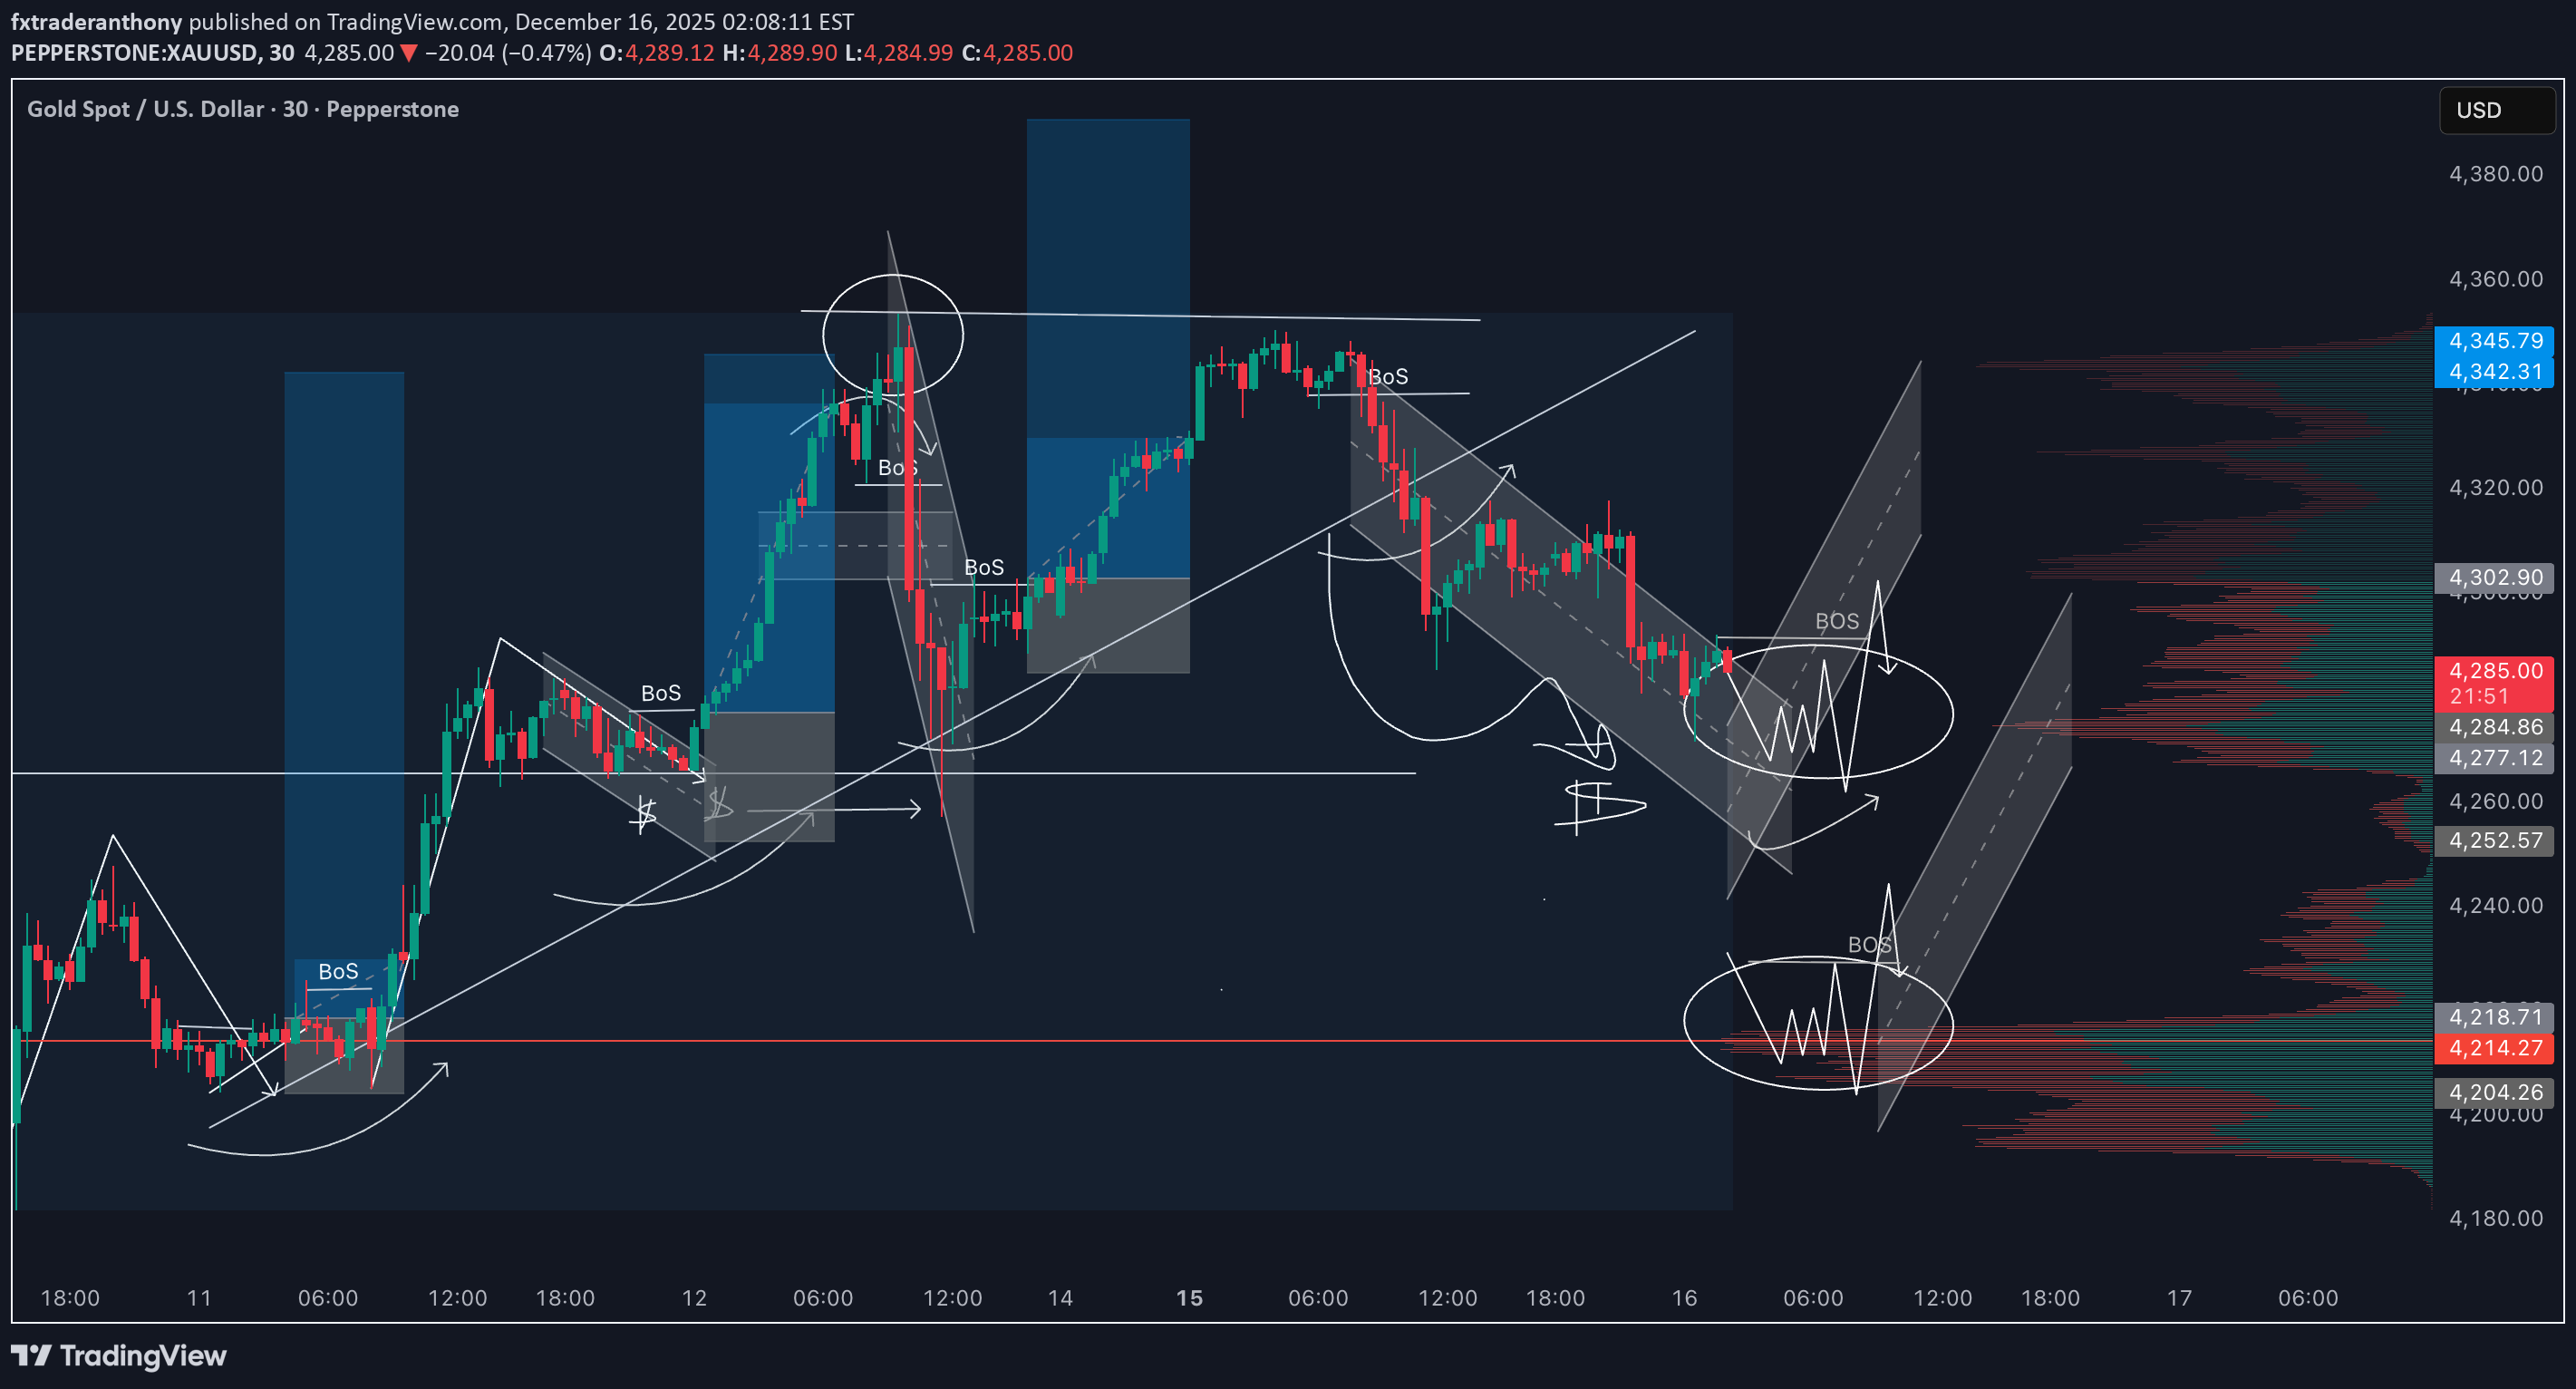
I’m currently watching XAUUSD Gold, and yesterday we didn’t get the higher high I was looking for. Instead, price broke structure to the downside, which has resulted in a fairly deep pullback 📉. ⏳ That said, the higher time frame structure remains bullish, so my overall bias is still to the upside 📈. At this stage, I’m waiting to see price trade back into support, and If that holds and breaks to the up-side, I’ll be looking for a potential long opportunity aligned with the broader trend. ⚠️ As always, this is not financial advice — just my market perspective.Target reached off the 1st BoS setup. 4R gained if you caught this
fxtraderanthony
XAUUSDGold Trading Plan: Higher Highs, Higher Lows, and Patience
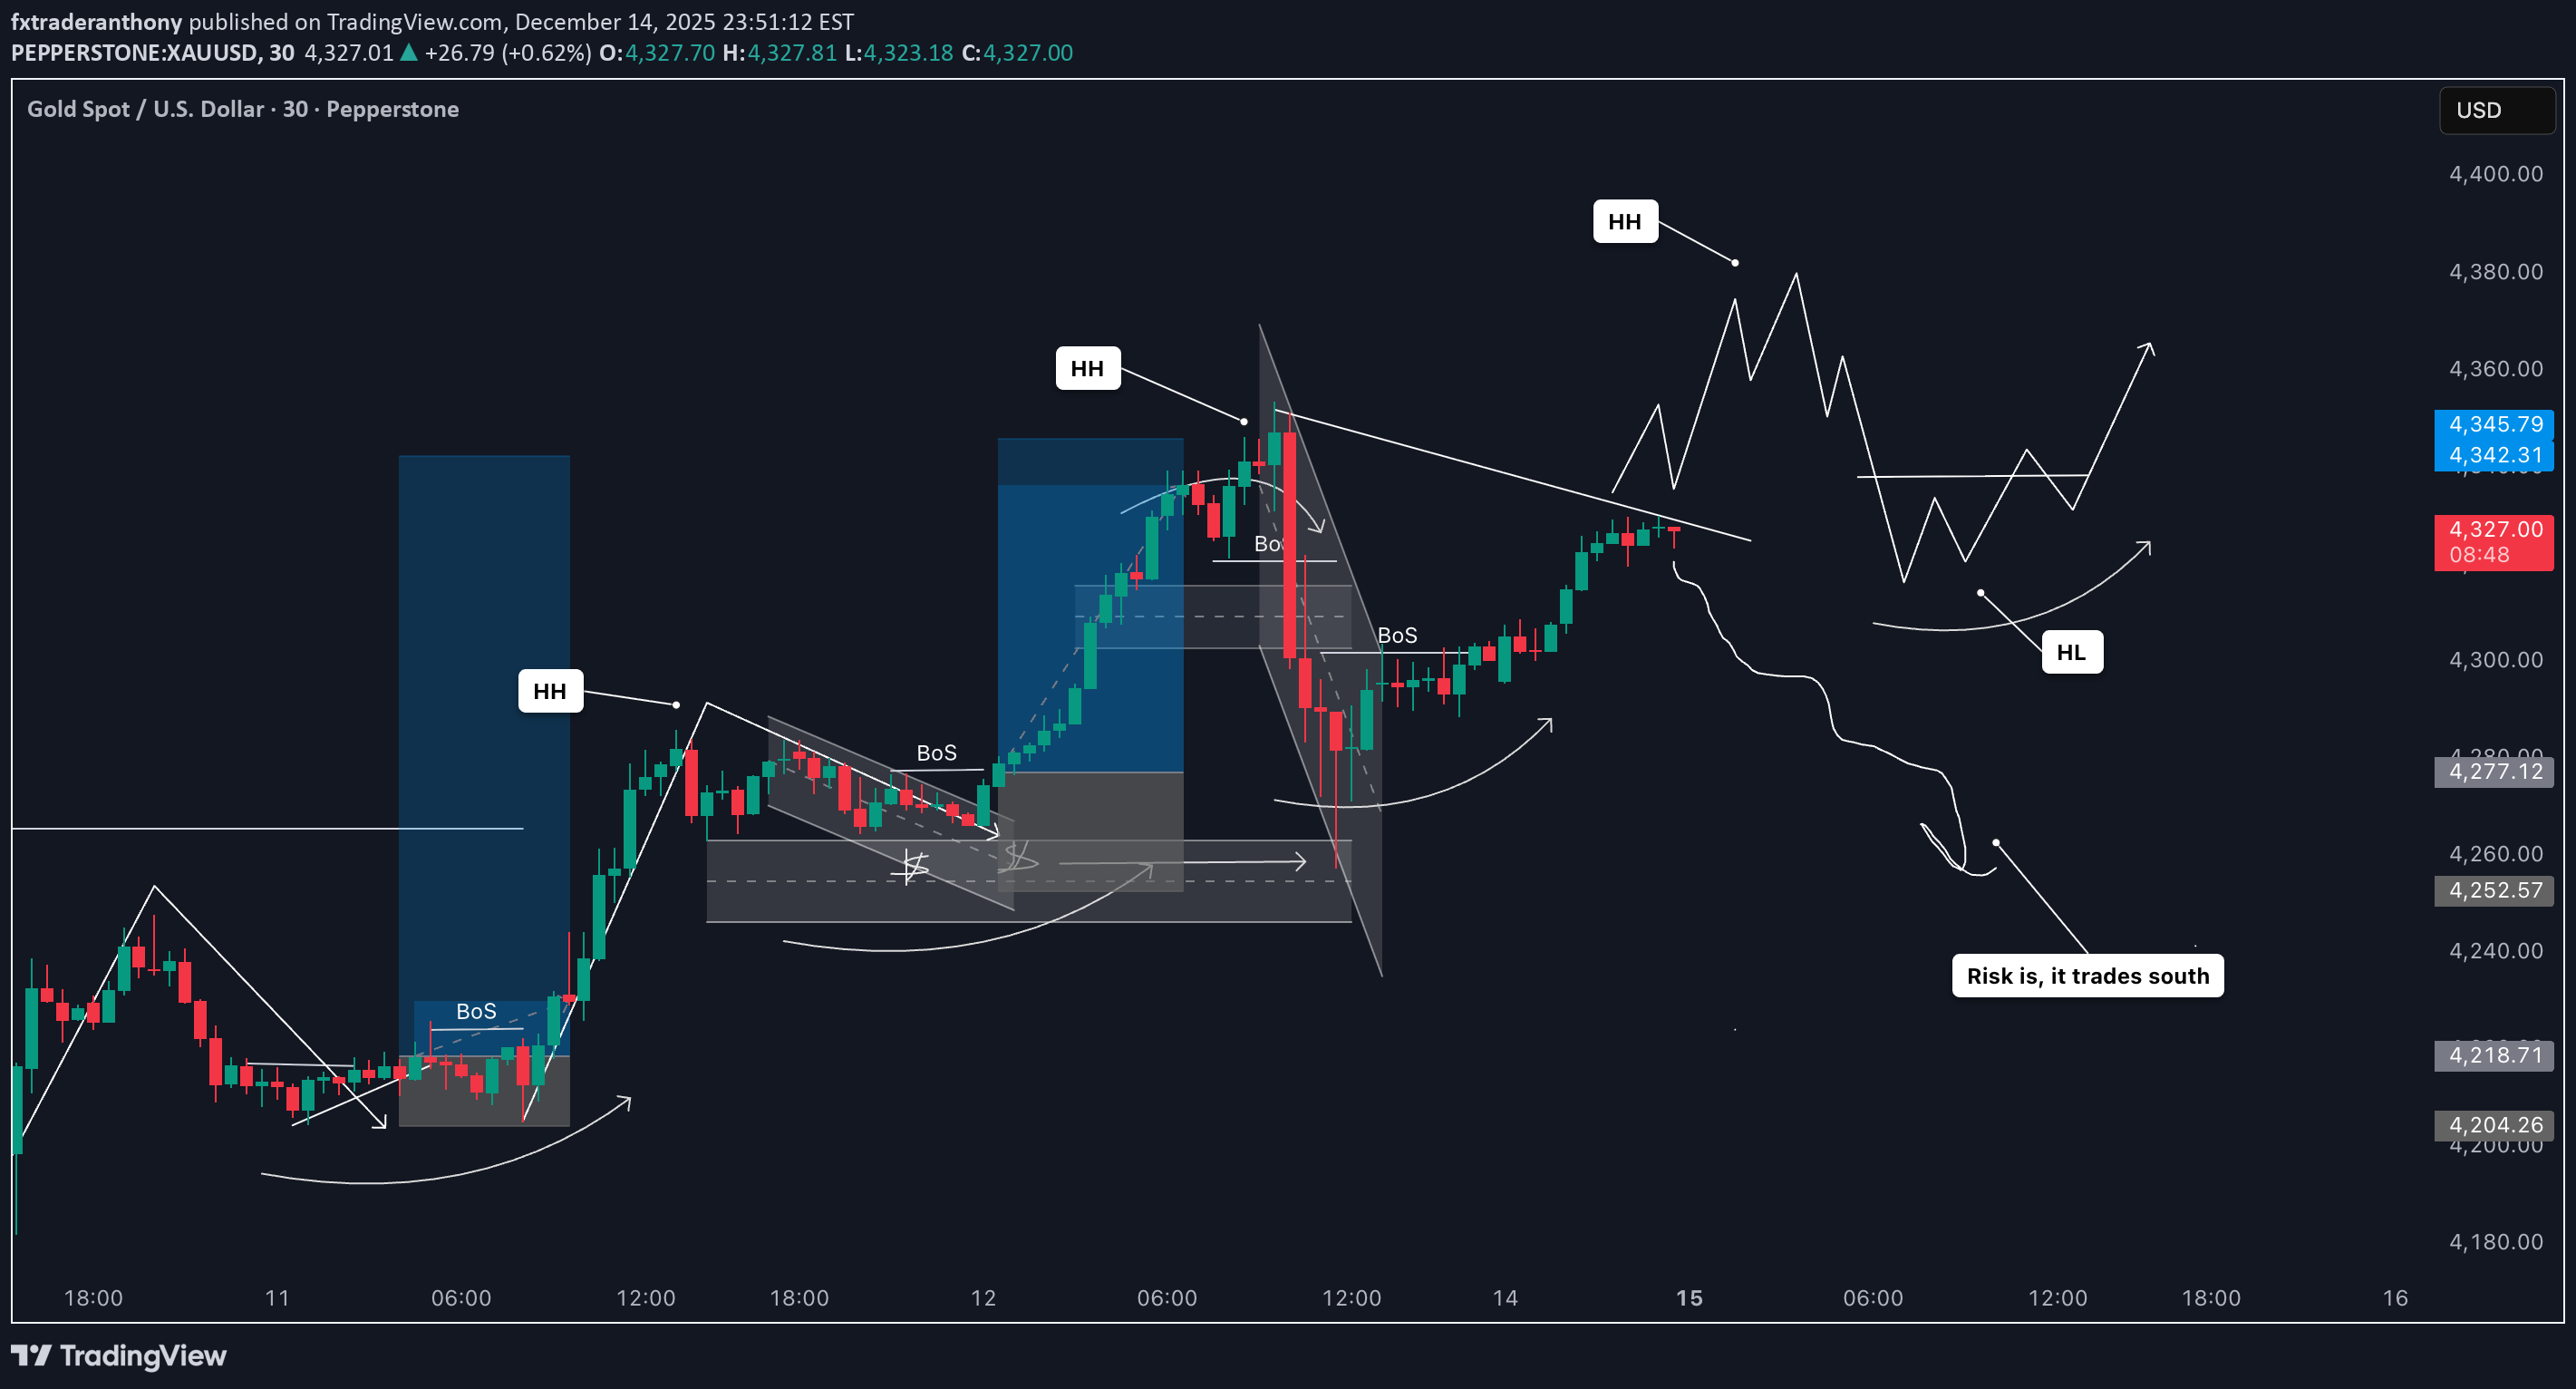
Right now, I’m keeping a close eye on Gold 🟡📈. Overall, it’s been trending bullish, but we did see a deep pullback on Friday, which is something to take note of. At this stage, I’m still looking for a trend continuation setup, not a reversal. That said, we need to be careful early in the week ⚠️. Mondays often come with a liquidity run before price continues in the main direction, especially when the market is already trending higher. So patience here is key. My approach is based around trend continuation. For me, that means I need to see a clear higher high followed by a higher low. Gold has started to rally, but at the moment, we don’t yet have a confirmed higher high. I want price to push higher, then pull back into a higher low — and only then will I start looking for a break in market structure to the upside 📊🔍. Until that happens, there is still a chance price could push further south before continuing higher, so stay flexible and manage risk accordingly 🧠📉. This is not financial advice — just my current read on the market.
fxtraderanthony
XAUUSD Gold Trade Plan: Friday Counter Trend Into The Close
Gold has been pushing aggressively this week with strong bullish momentum ⚡️📈. As we head into Friday, I’m watching for a potential counter-trend move — ideally a push into the weekly highs gives us a pullback back into the weekly close 🎯📉. Of course, this is not financial advice — just my current outlook based on market behavior, structure and momentum 📊🤝.This one gave us a nice outcome on Gold. I'll be looking for another opportunity today so stay tuned
fxtraderanthony
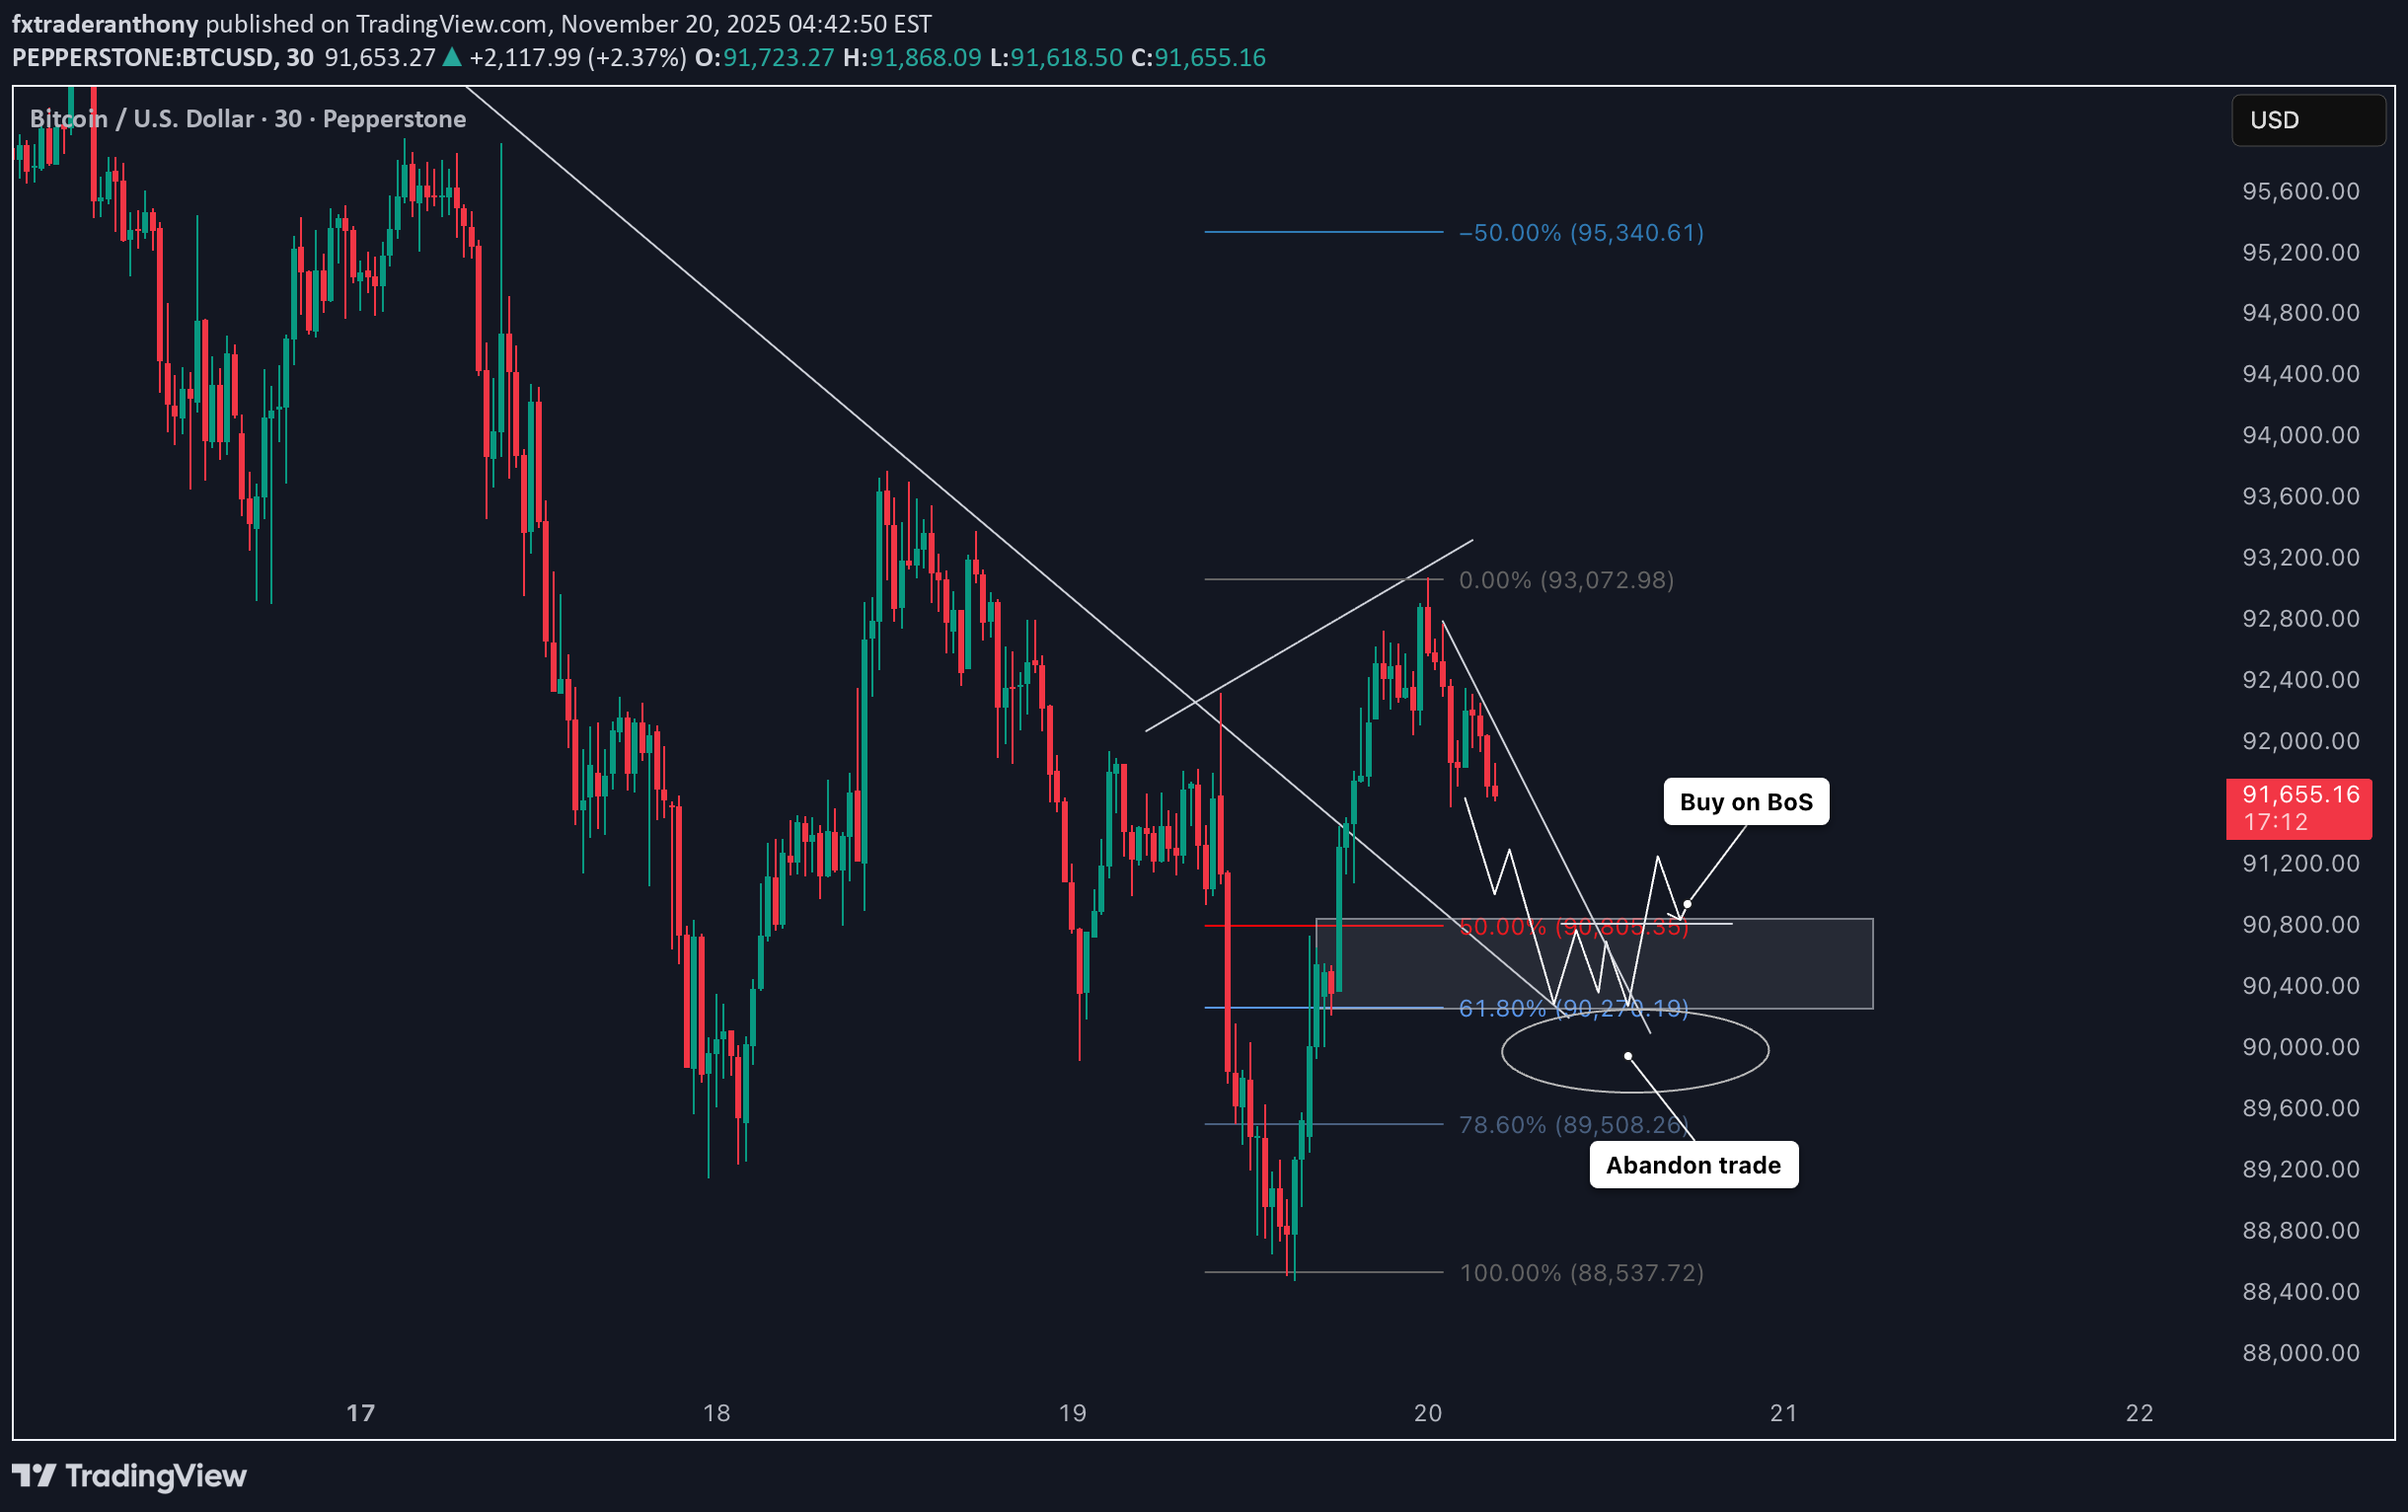
برنامه معاملاتی بیت کوین پس از شکست ساختار: منتظر این تاییدیه طلایی باشید!
Bitcoin has now broken structure, and the price action is starting to look very similar to what we saw on US30 (my last video). 📉➡️📈 After that strong bullish run, BTC has pulled back, taken some liquidity, and broken through a key level, which is exactly what we want to see before the market sets up for its next move. This kind of structure break often signals that the market is resetting — clearing out late buyers, rebalancing price, and making room for a cleaner continuation later. 😮💨🔄 Even though Bitcoin has been bullish overall, a structure break like this can actually strengthen the next leg up if the market respects the right levels. What I want to see now is for Bitcoin to push back above the current weekly open, trade through it with conviction, and then come back to retest that level. ✔️ Once that happens, that retest becomes a high-interest zone for potential longs, because it shows the market is reclaiming support before continuing higher. 🚀💎 Until then, patience. Let the levels confirm the narrative. Not financial advice.BTC gave us two opportunities where it broke above the POC and pulled back. If you placed your stop-loss under the previous swing low, you would have been okay
fxtraderanthony
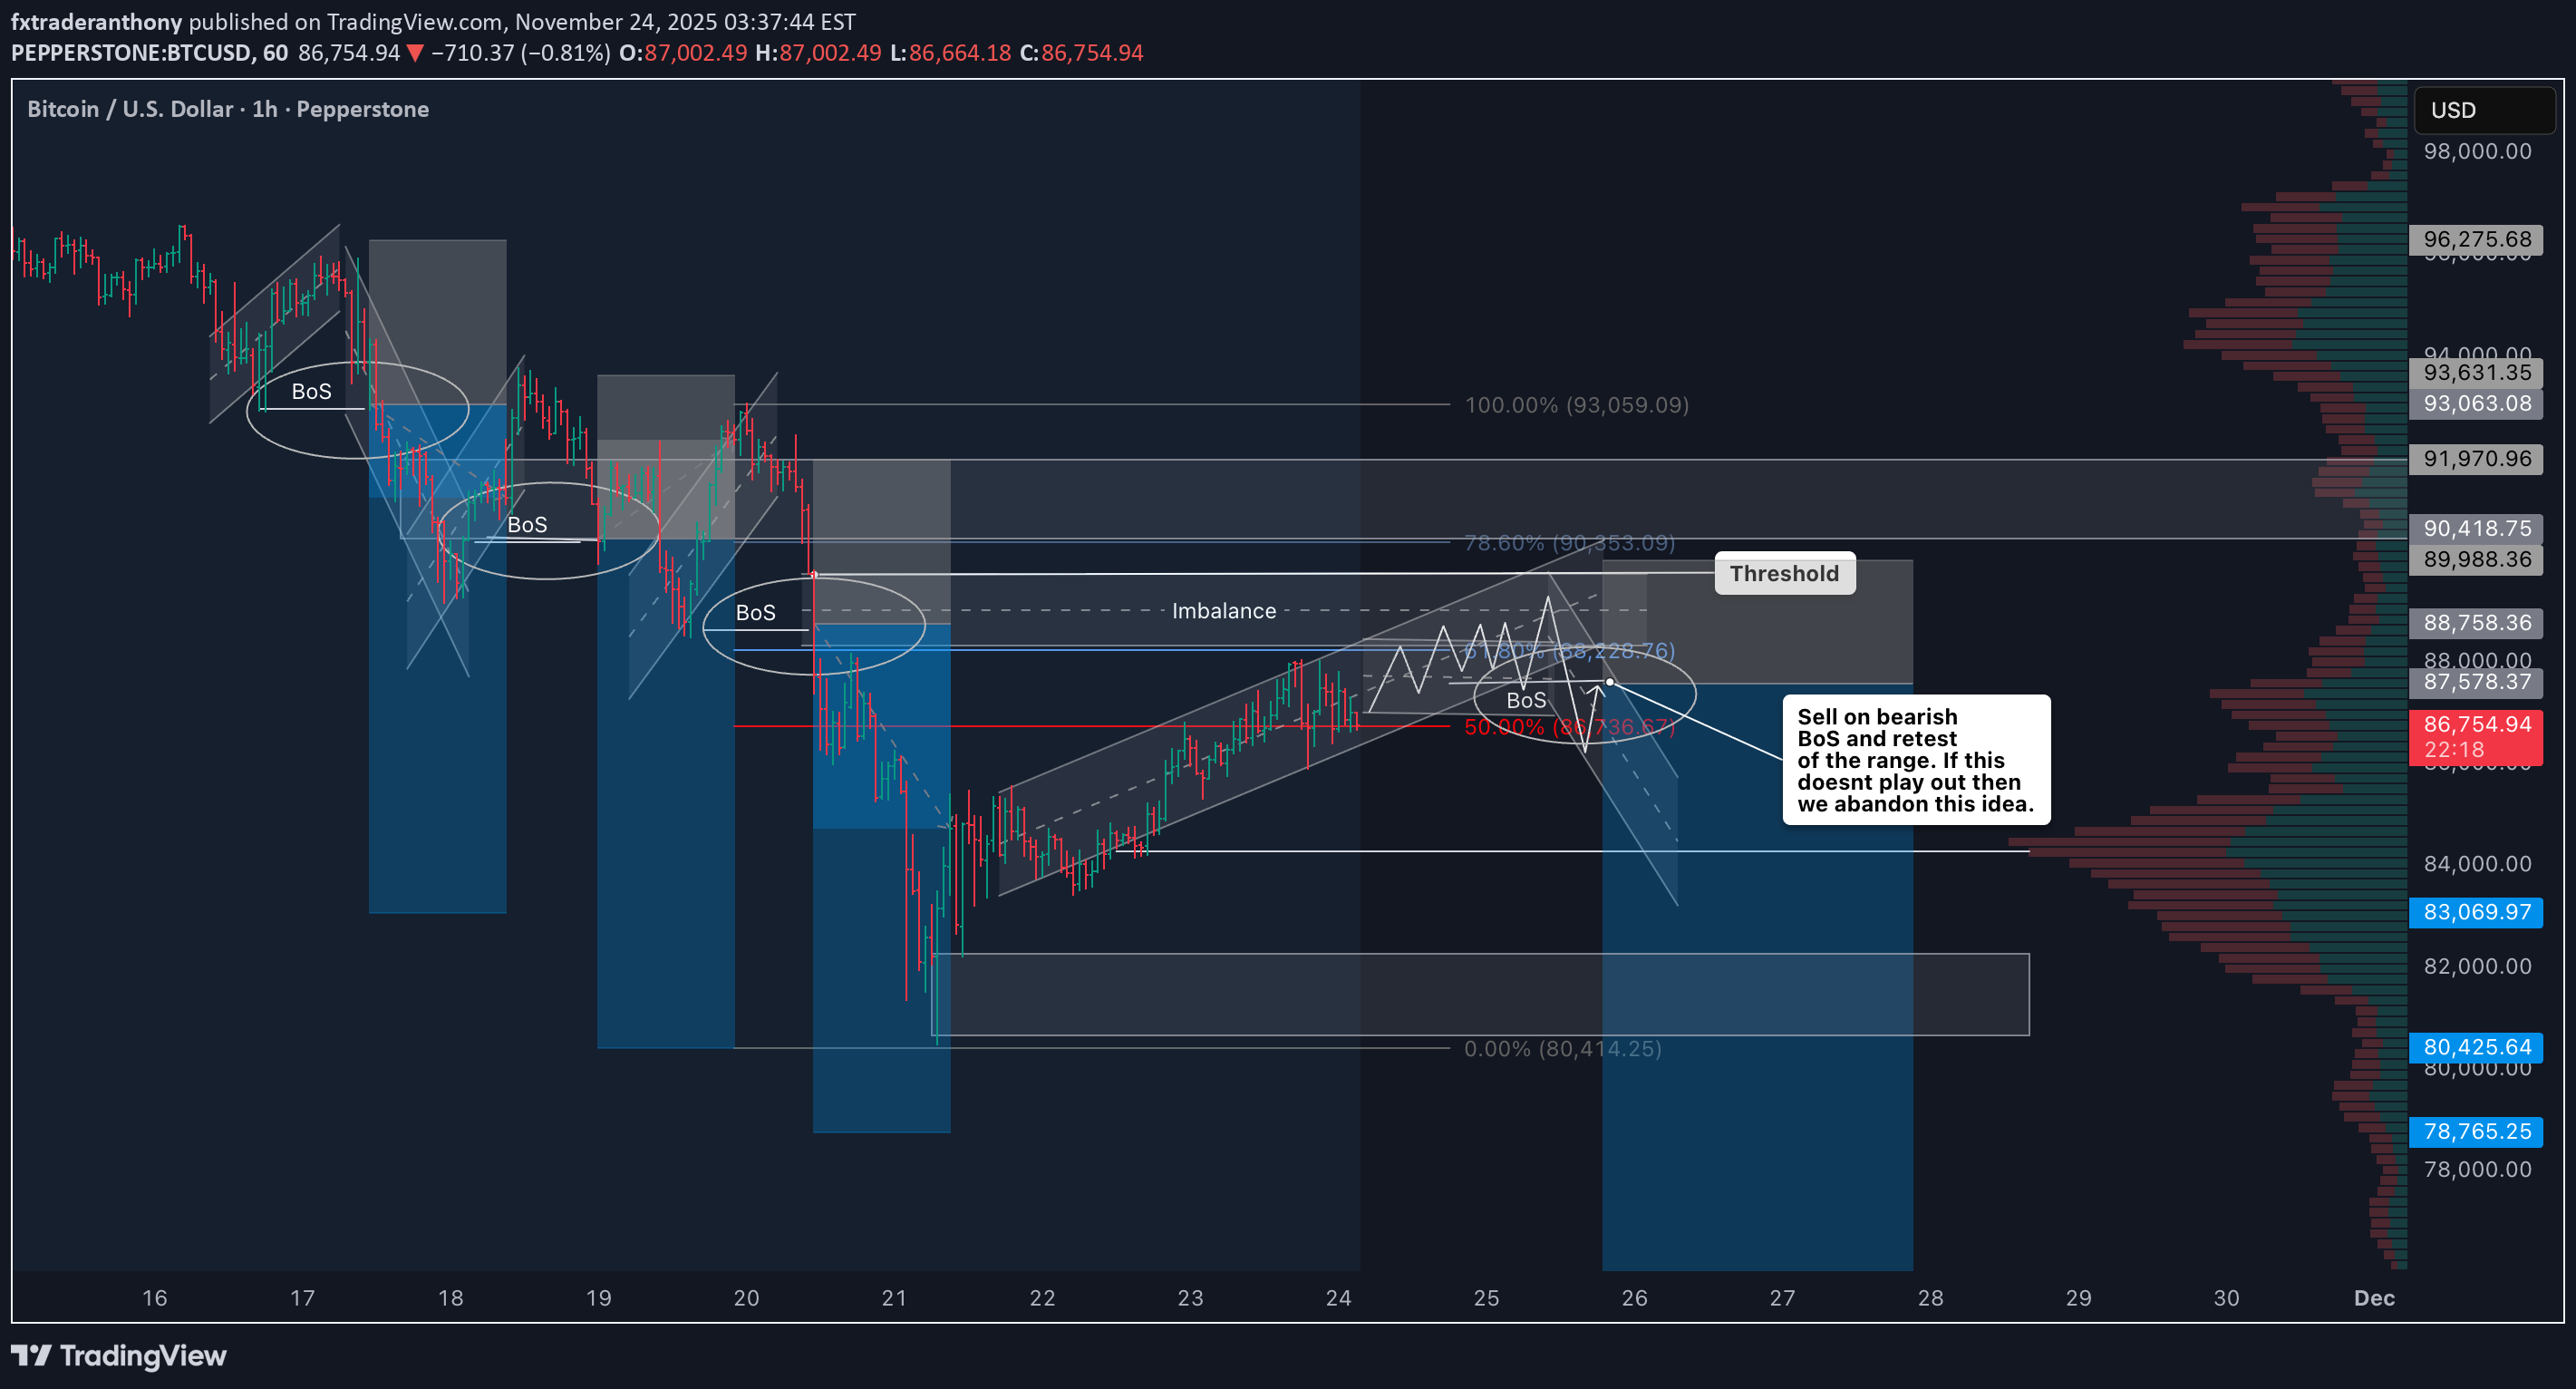
احتمال ریزش بیت کوین در پایان هفته؛ نقشه معاملاتی من این است!
Bitcoin BTC has been bullish this week, pushing higher as momentum continues to favour the upside. 🚀📈 But as we approach the end of the week, we need to be cautious because BTC is now trading directly into a key resistance zone. This is normally where trends start to slow down, weaken, or even pull back. 😮💨 Just like with any strong move, a bullish trend doesn’t mean endless continuation. Institutions and major players often begin reducing exposure toward the end of the week, which can trigger retracements or consolidation. So the big question becomes: do you really want to chase longs right as BTC is hitting major resistance and the weekly trend is reaching potential exhaustion? ⚠️ Looking at the structure, Bitcoin has climbed into a level where we’ve seen previous selling and heavy order activity. This makes the current area a strong resistance zone, and personally, it’s not somewhere I’d want to be looking for new long positions. If anything, heading into Thursday and Friday, we could see Bitcoin pull back from this resistance as buyers take profit and institutions rebalance their positions before the weekly close. 🕒🔄 Be patient, stay aware of the levels, and let price tell you the story. Not financial advice.The BOS played out around the Fibonacci equilibrium level into the imbalance. If you caught this trade, I would be inclined to move the stop loss to break even and even close partial profits
fxtraderanthony
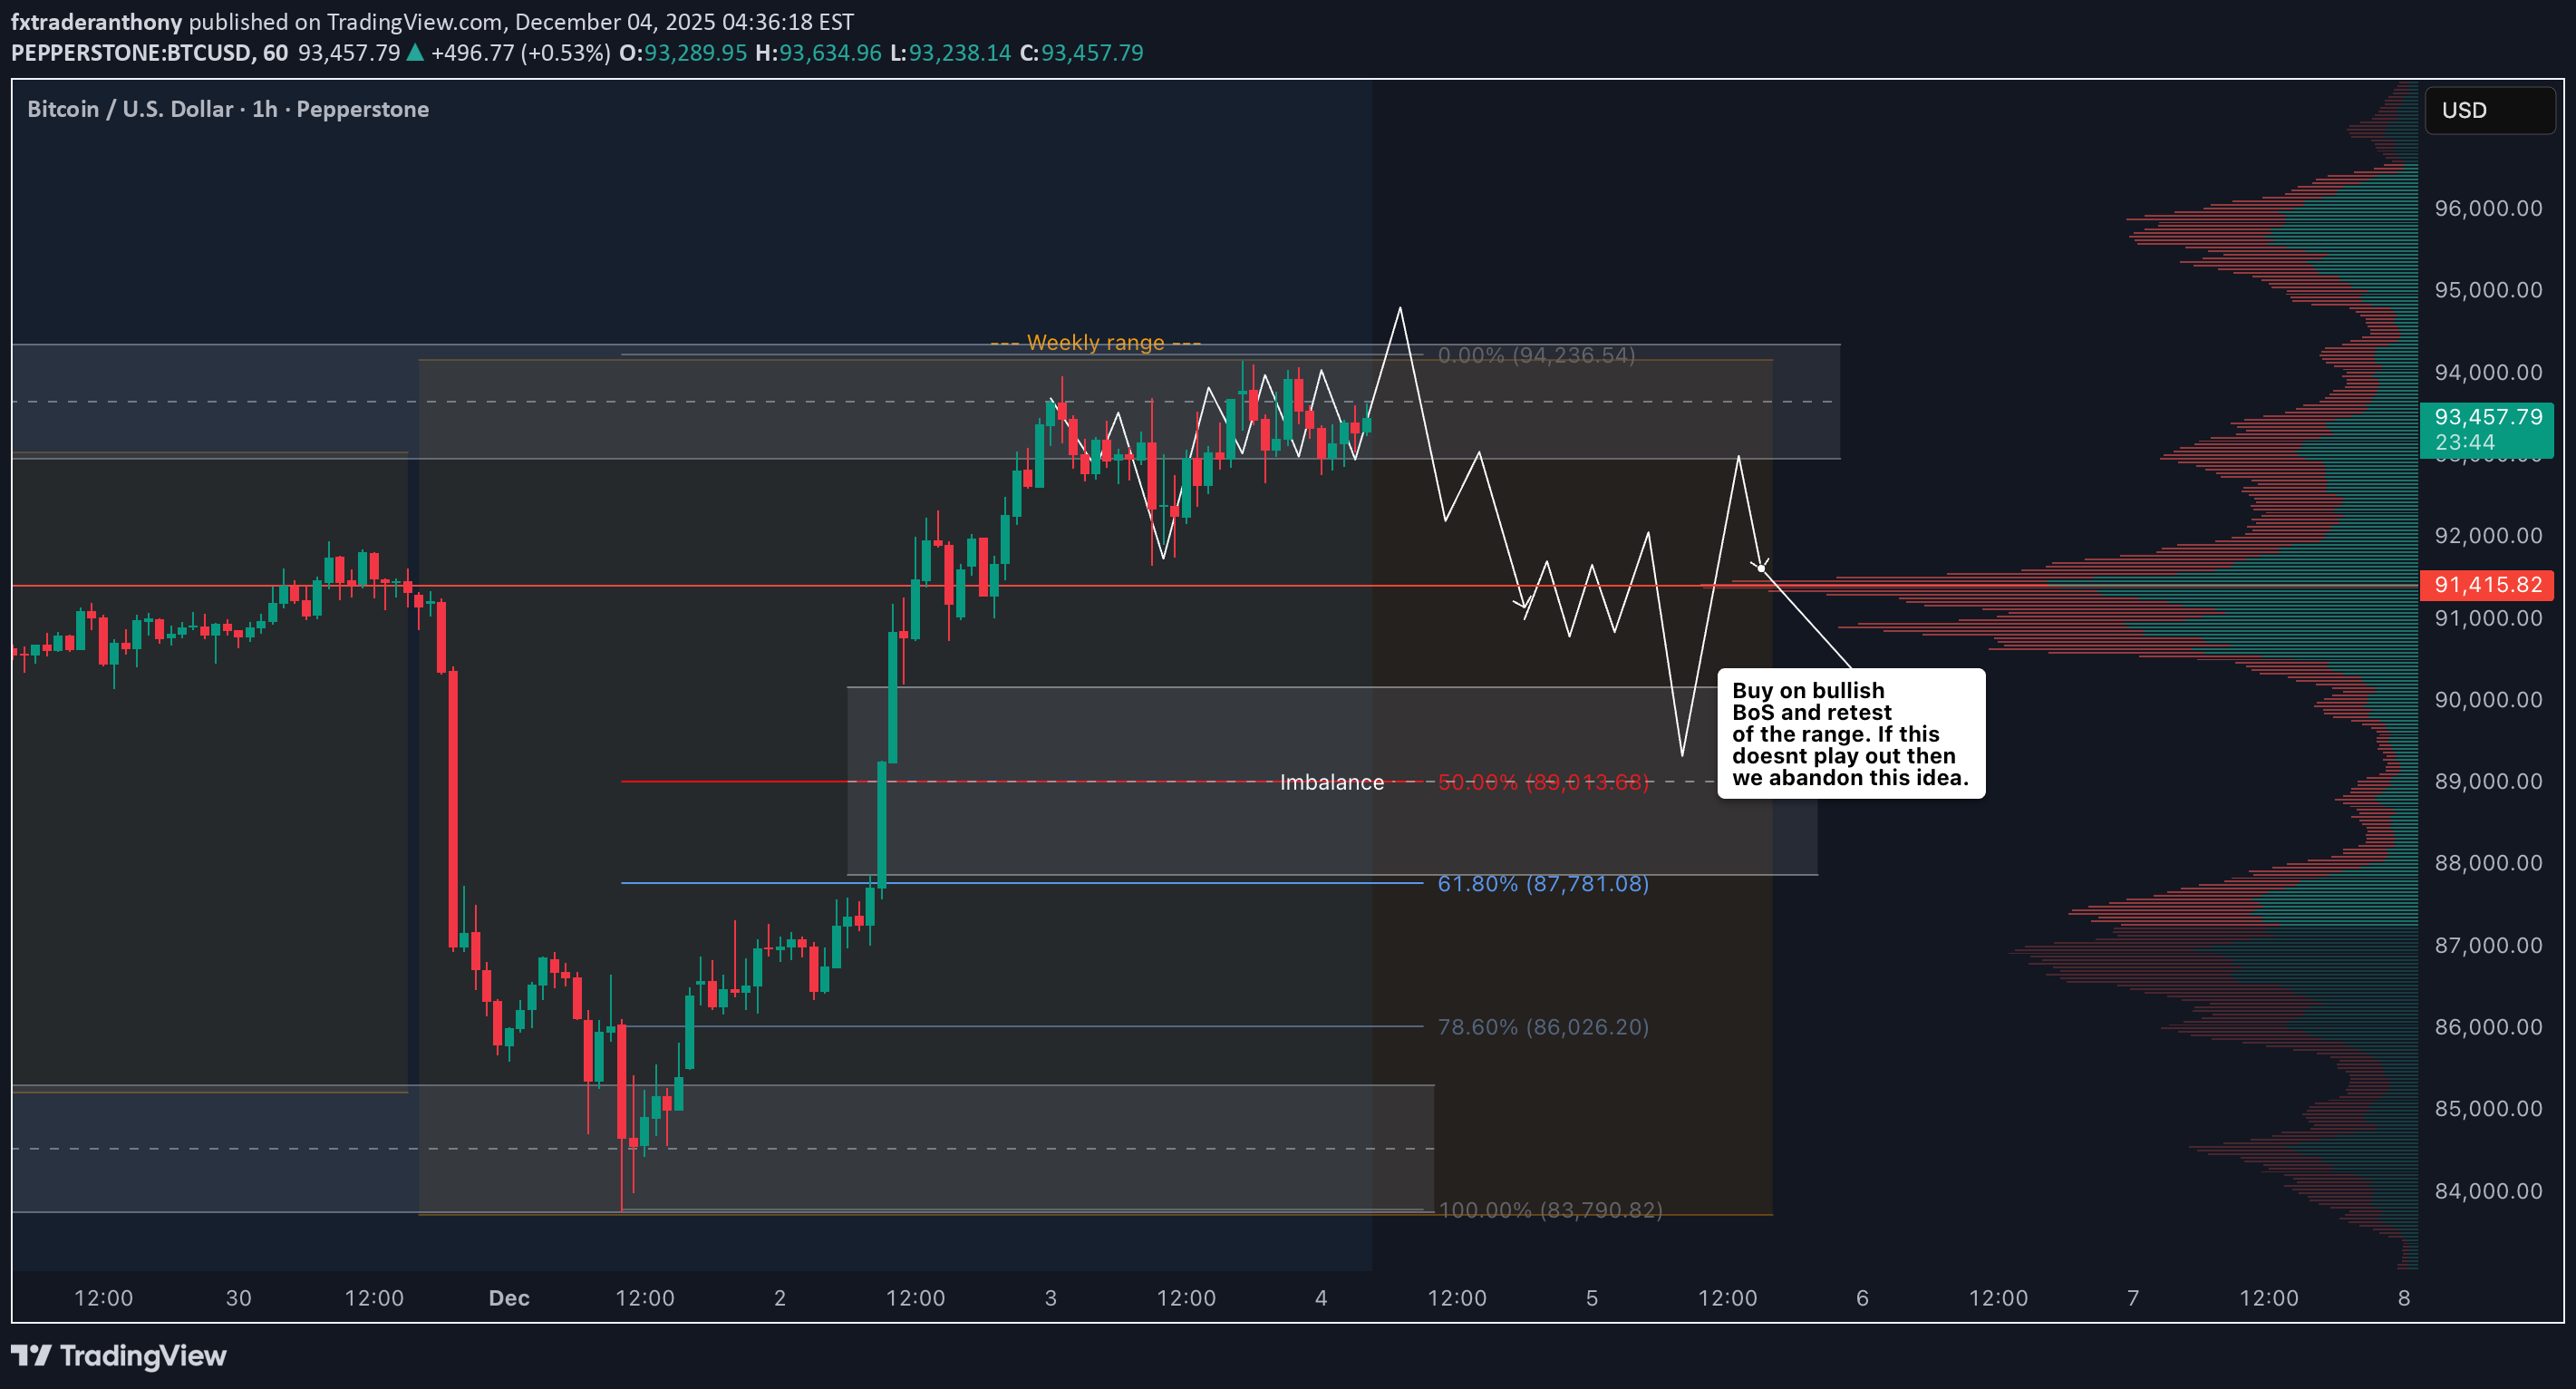
برنامه معاملاتی بیت کوین: منتظر ریزش بیشتر BTC هستم!
I’m keeping a close eye on Bitcoin (BTC) right now. On the 4H timeframe, price action remains firmly in a sustained bearish trend. I’m anticipating a possible continuation to the downside. If BTC holds at the current level and fails to retrace into the imbalance highlighted on the 1H chart — and we see a bearish rotation with a clean break in market structure — I’ll be watching for a potential short setup. ⚠️ Not financial advice.BTC didnt trend for an entire day, close now at Breakeven
fxtraderanthony
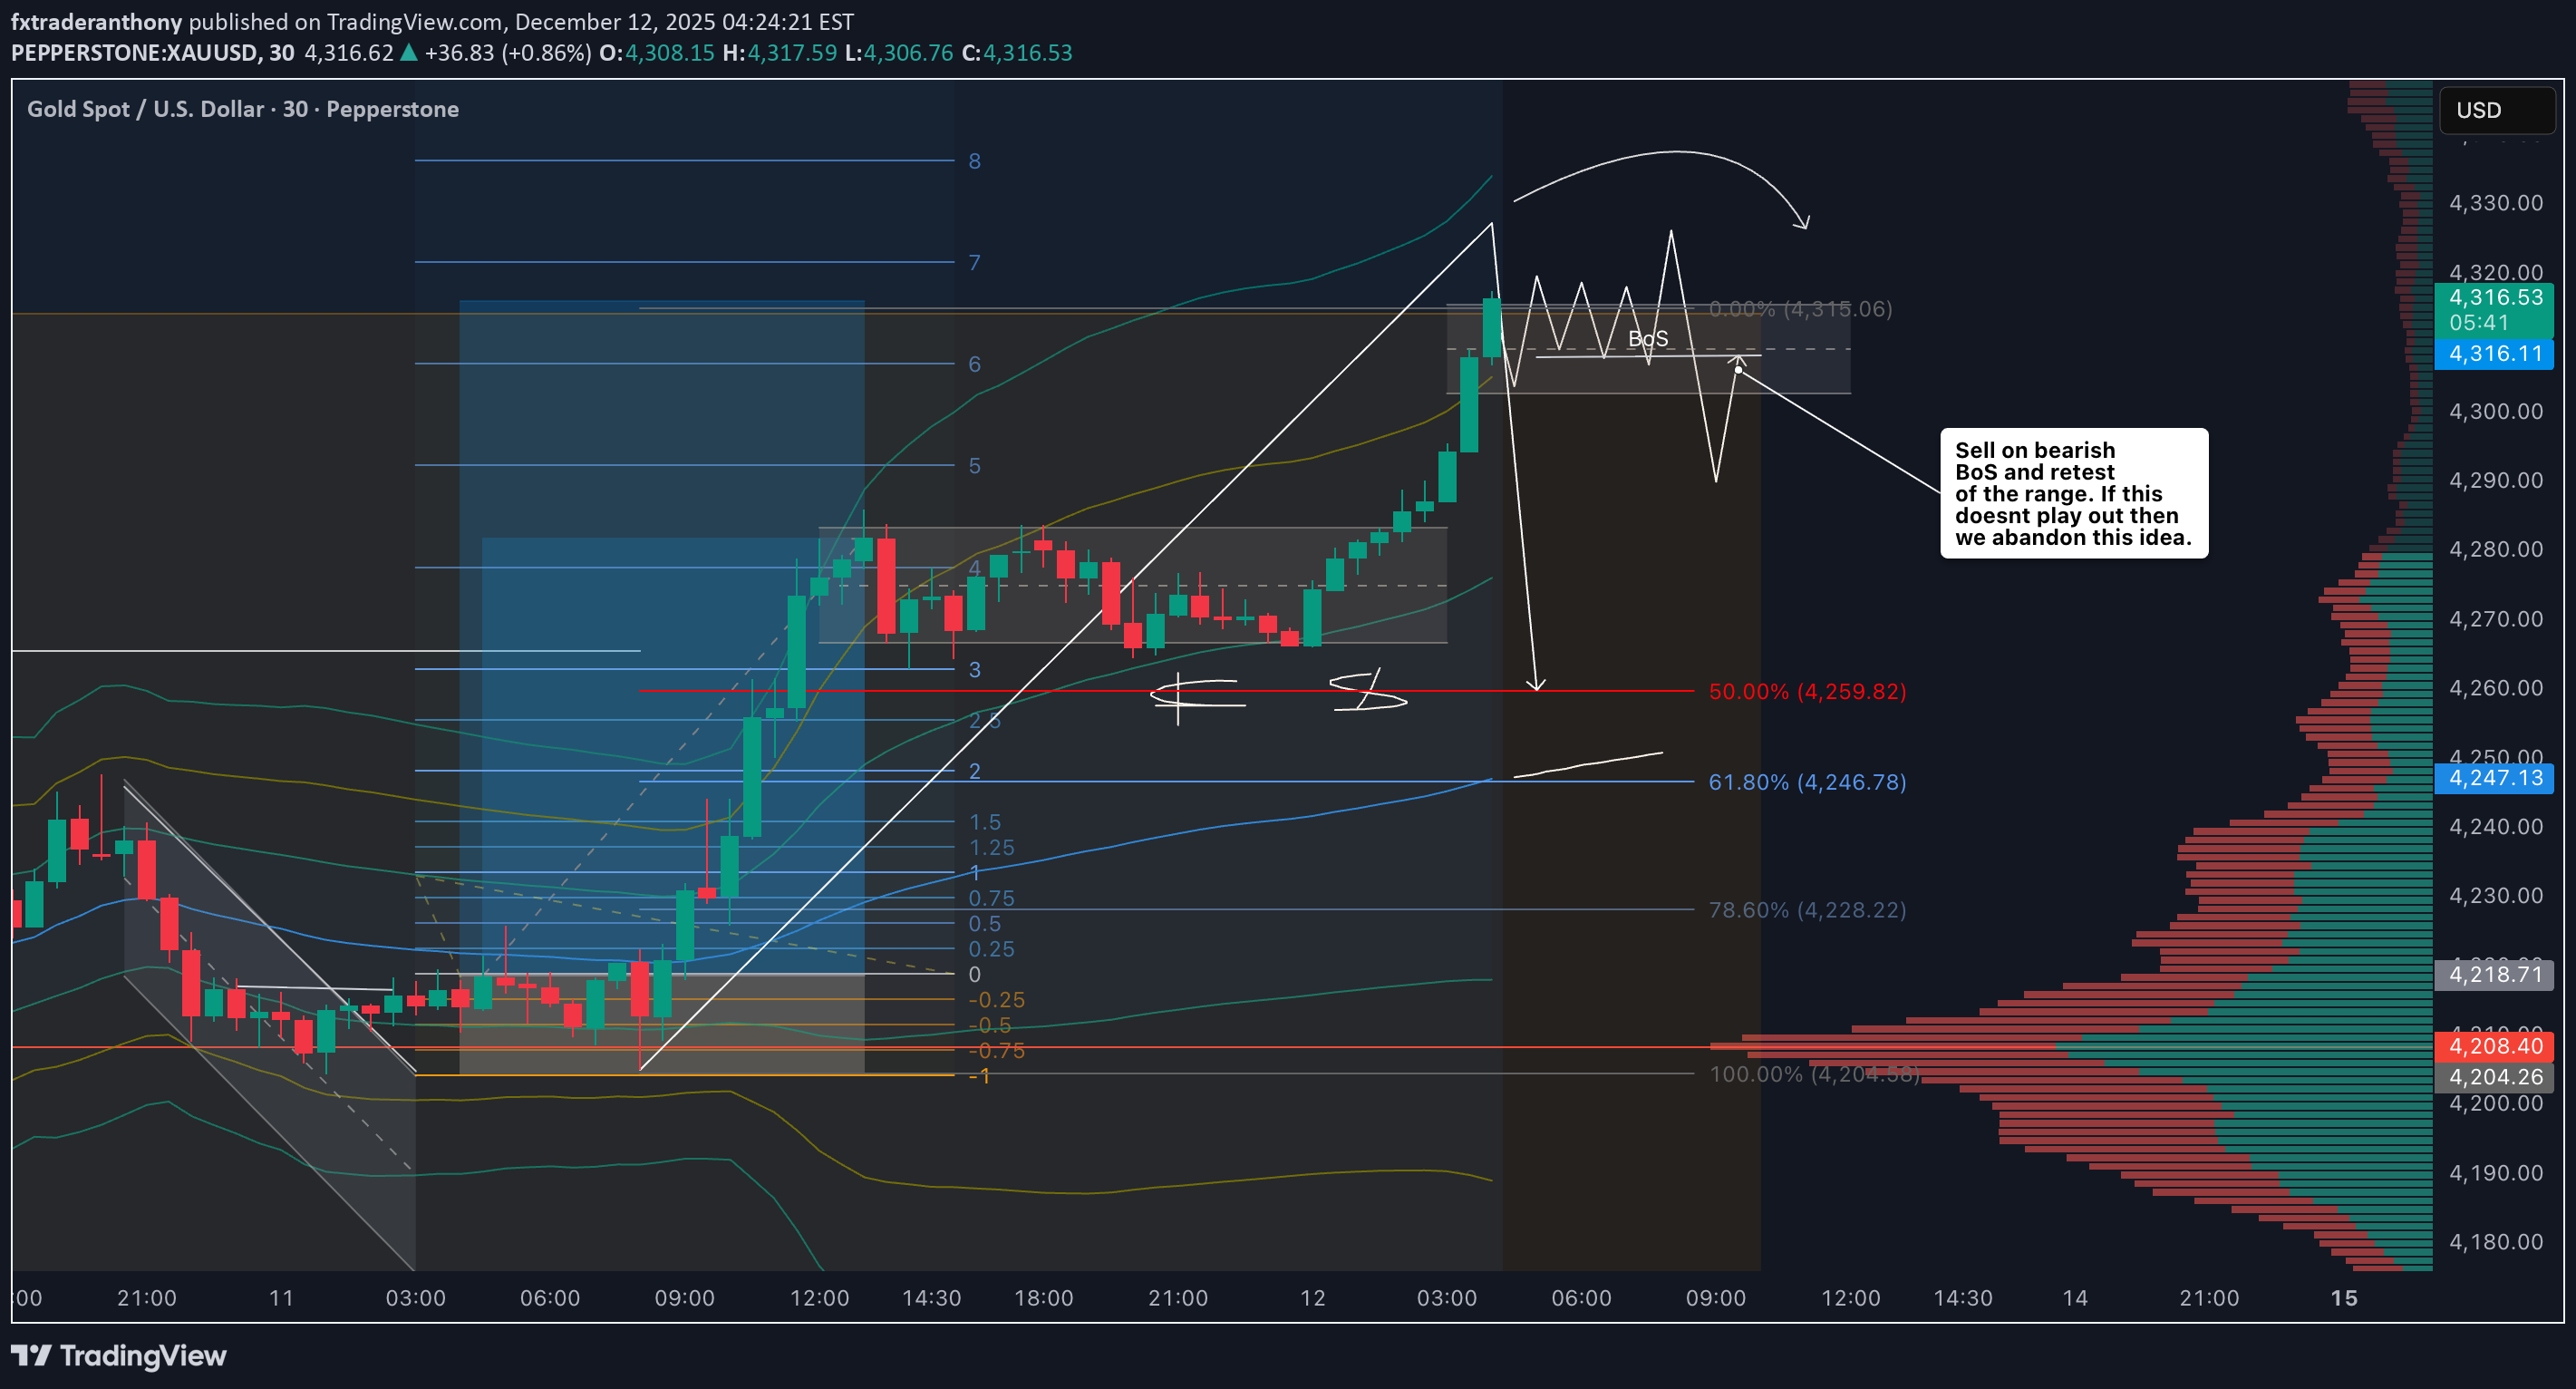
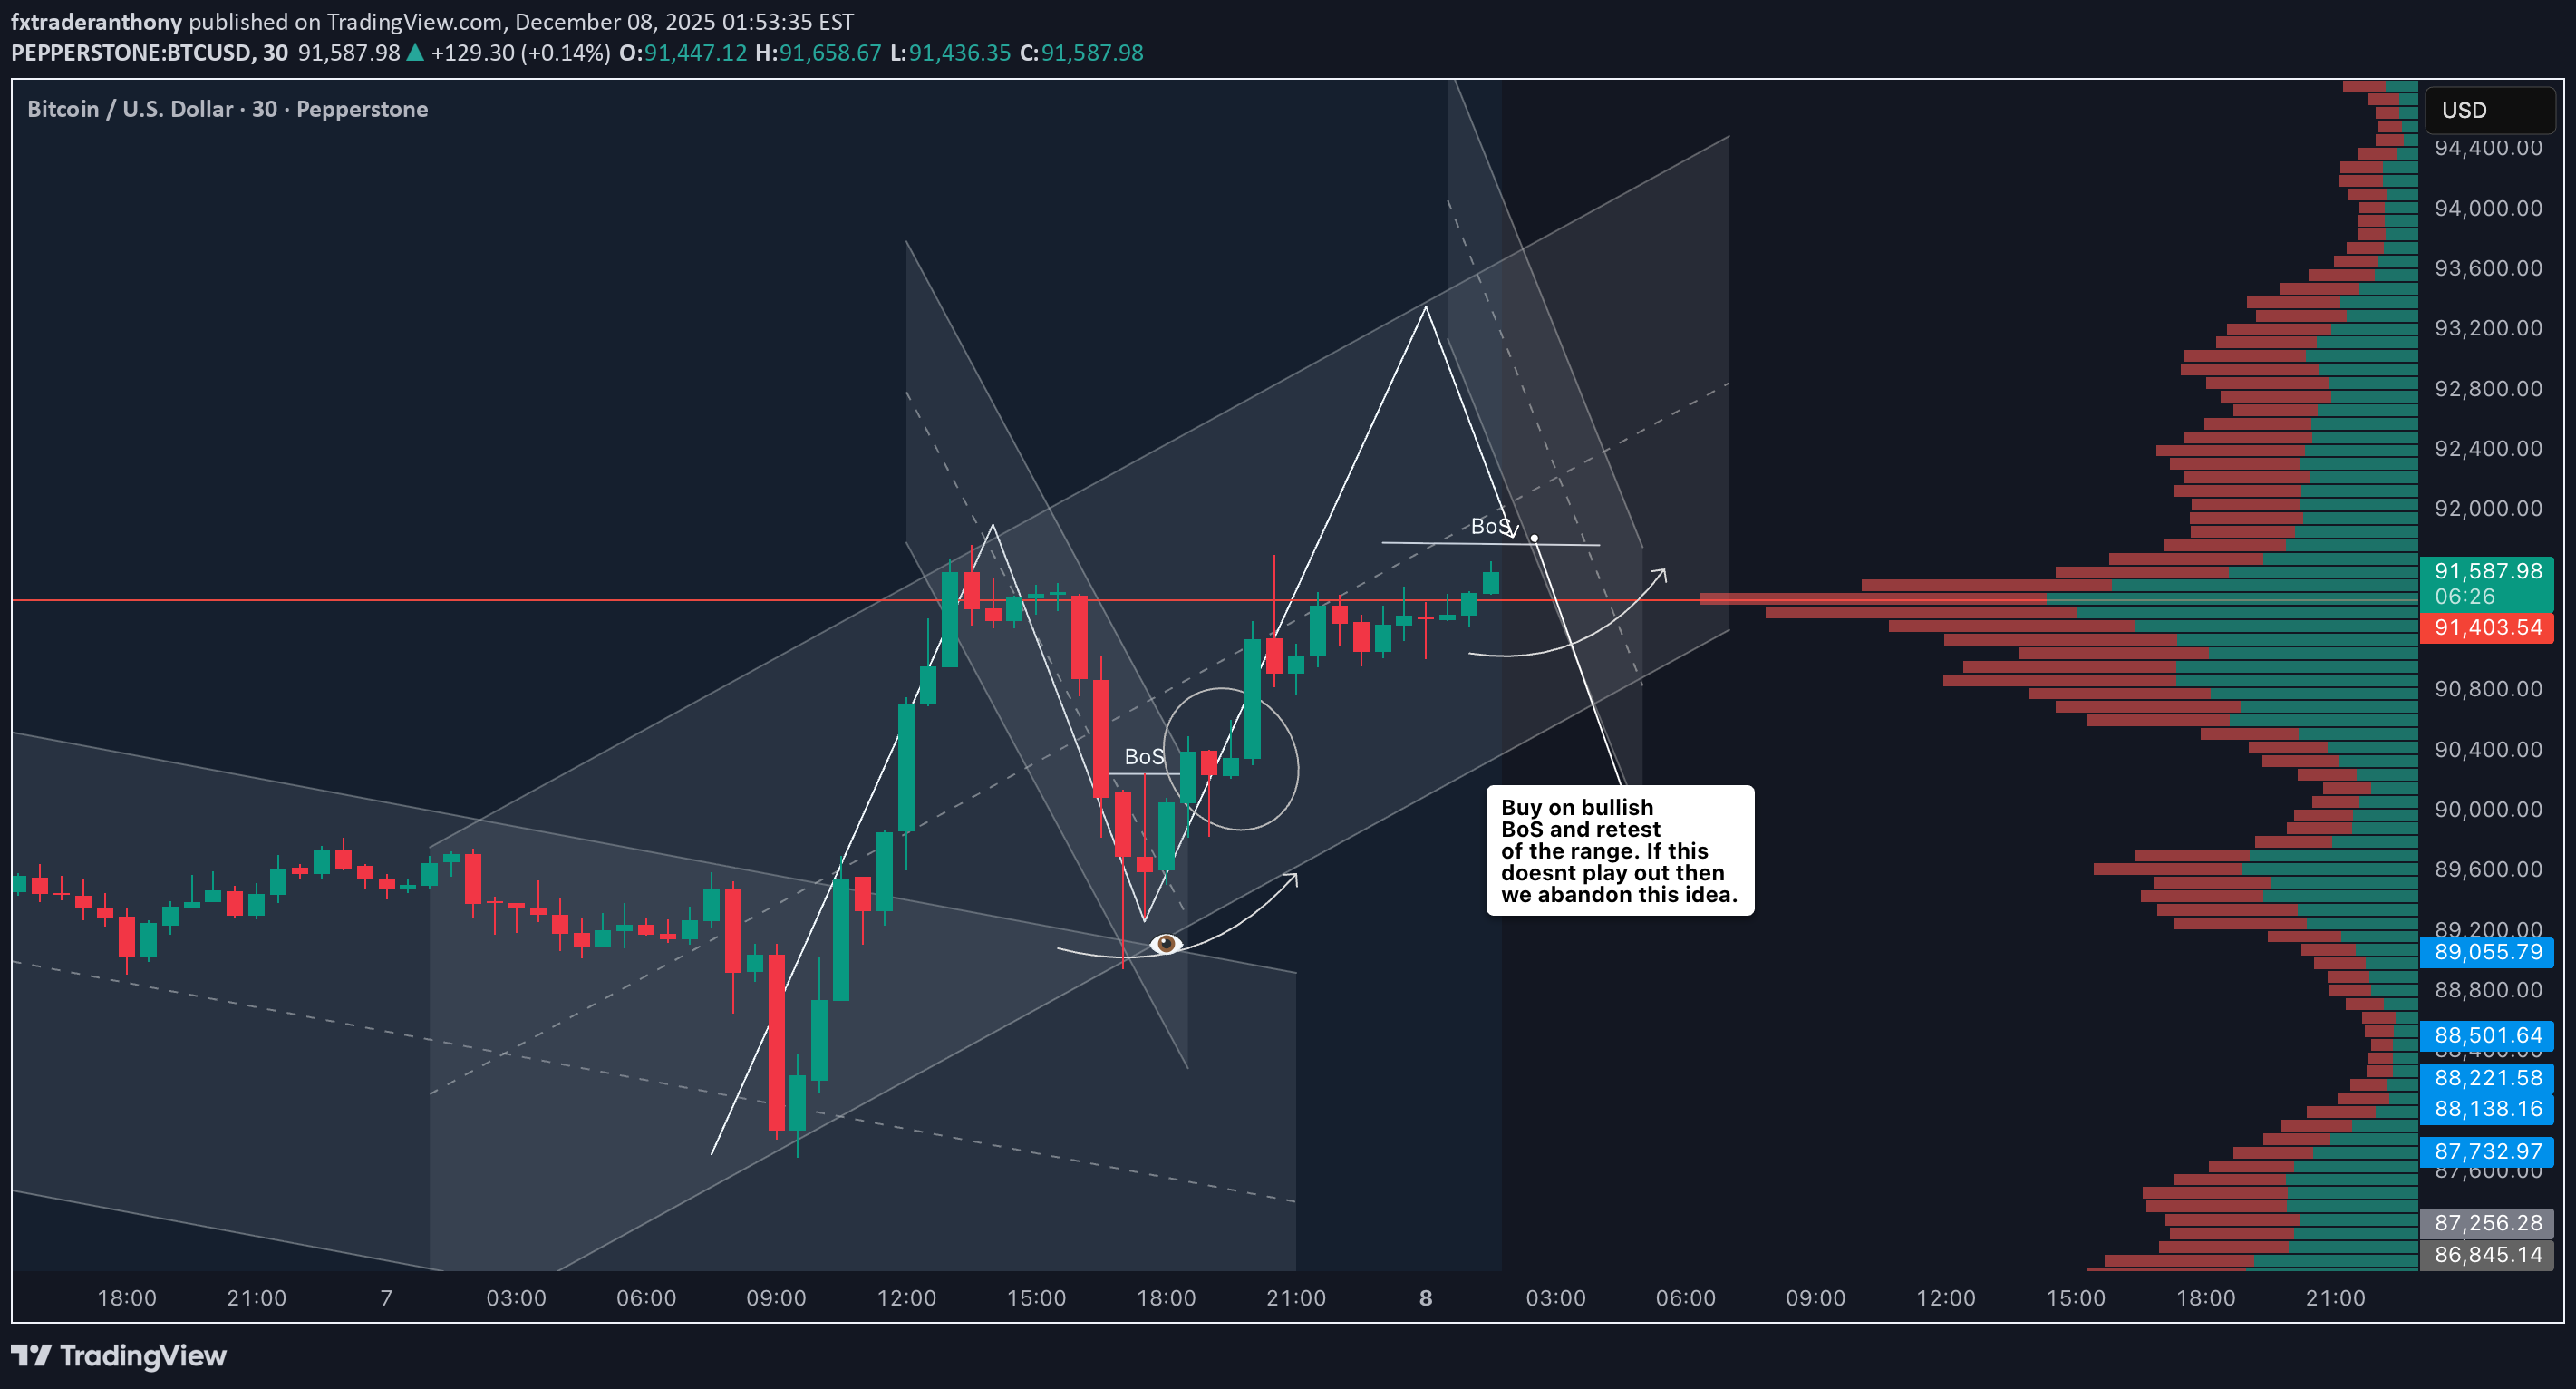
بیت کوین آماده جهش بزرگ؟ راز سطح حیاتی 61.8% برای خریداران طلا شد!
Bitcoin is showing early signs of strength, with a clear bullish shift in structure on the 30-minute timeframe 🚀. With that momentum coming in, the main level to watch now is the 61.8% Fibonacci retracement of the current price swing. A potential buy setup becomes valid only if price pulls back and holds above the 61.8 level 🔥. Holding this zone would signal that buyers are stepping in and maintaining control of the move. If price respects this level and continues to break structure to the upside, the bullish continuation becomes much more probable. If Bitcoin breaks below the 61.8 retracement, the idea is invalidated and should be abandoned. At that point, momentum would no longer support the long bias ⚠️. Not financial advice.BTC failed to hold at the 61.8 Fibo level so no trade
fxtraderanthony
طلای 24 ساعته: حمایت کلیدی کجاست؟ منتظر ریزش و شکست تاریخی!
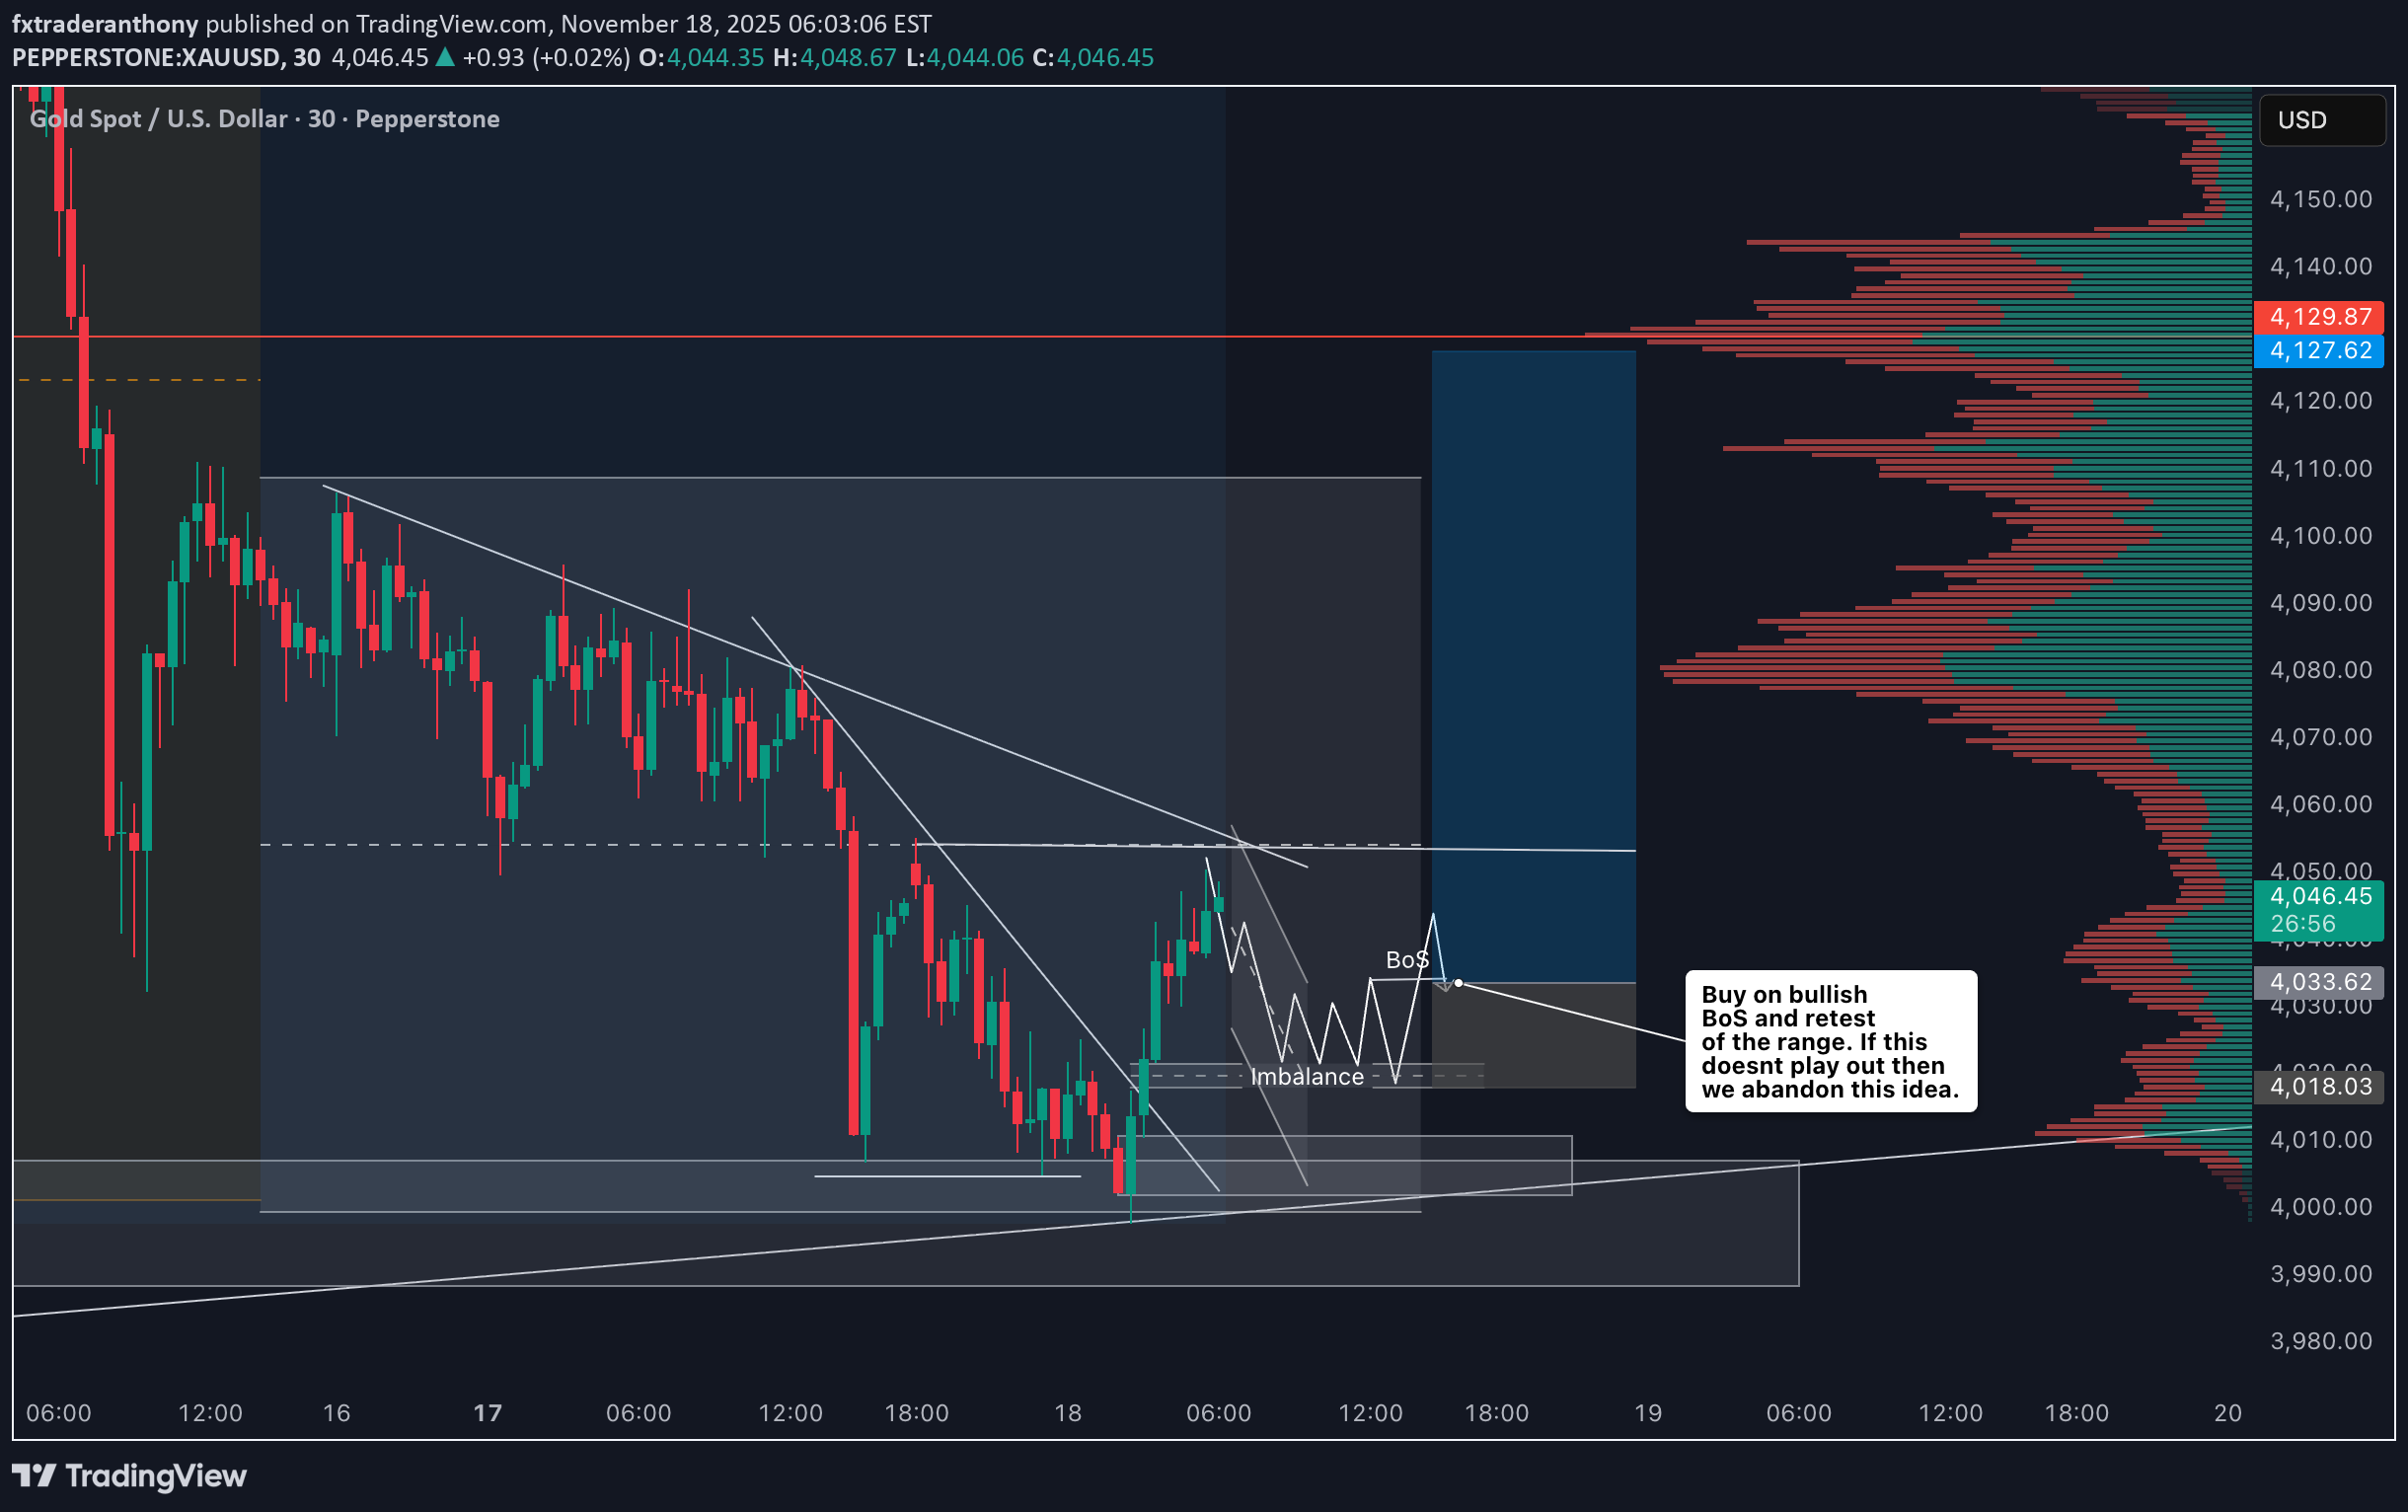
Gold has recently traded down into a major support zone, a level that has historically attracted strong buying interest. 🪙📉➡️📈 If this support continues to hold and bullish momentum resumes, I’ll be monitoring the 30-minute timeframe for a clean pullback into discount pricing. From there, a decisive break in market structure would provide a high-probability opportunity to position long with the trend. 🔍⏳✨ As always, confirmation is key — chasing early entries in consolidation zones can expose traders to unnecessary risk. 🛑 Disclaimer: This is not financial advice. Educational purposes only.
fxtraderanthony
آمادهسازی معامله طلا (XAUUSD): برنامه معاملاتی دقیق من در برابر مقاومت!
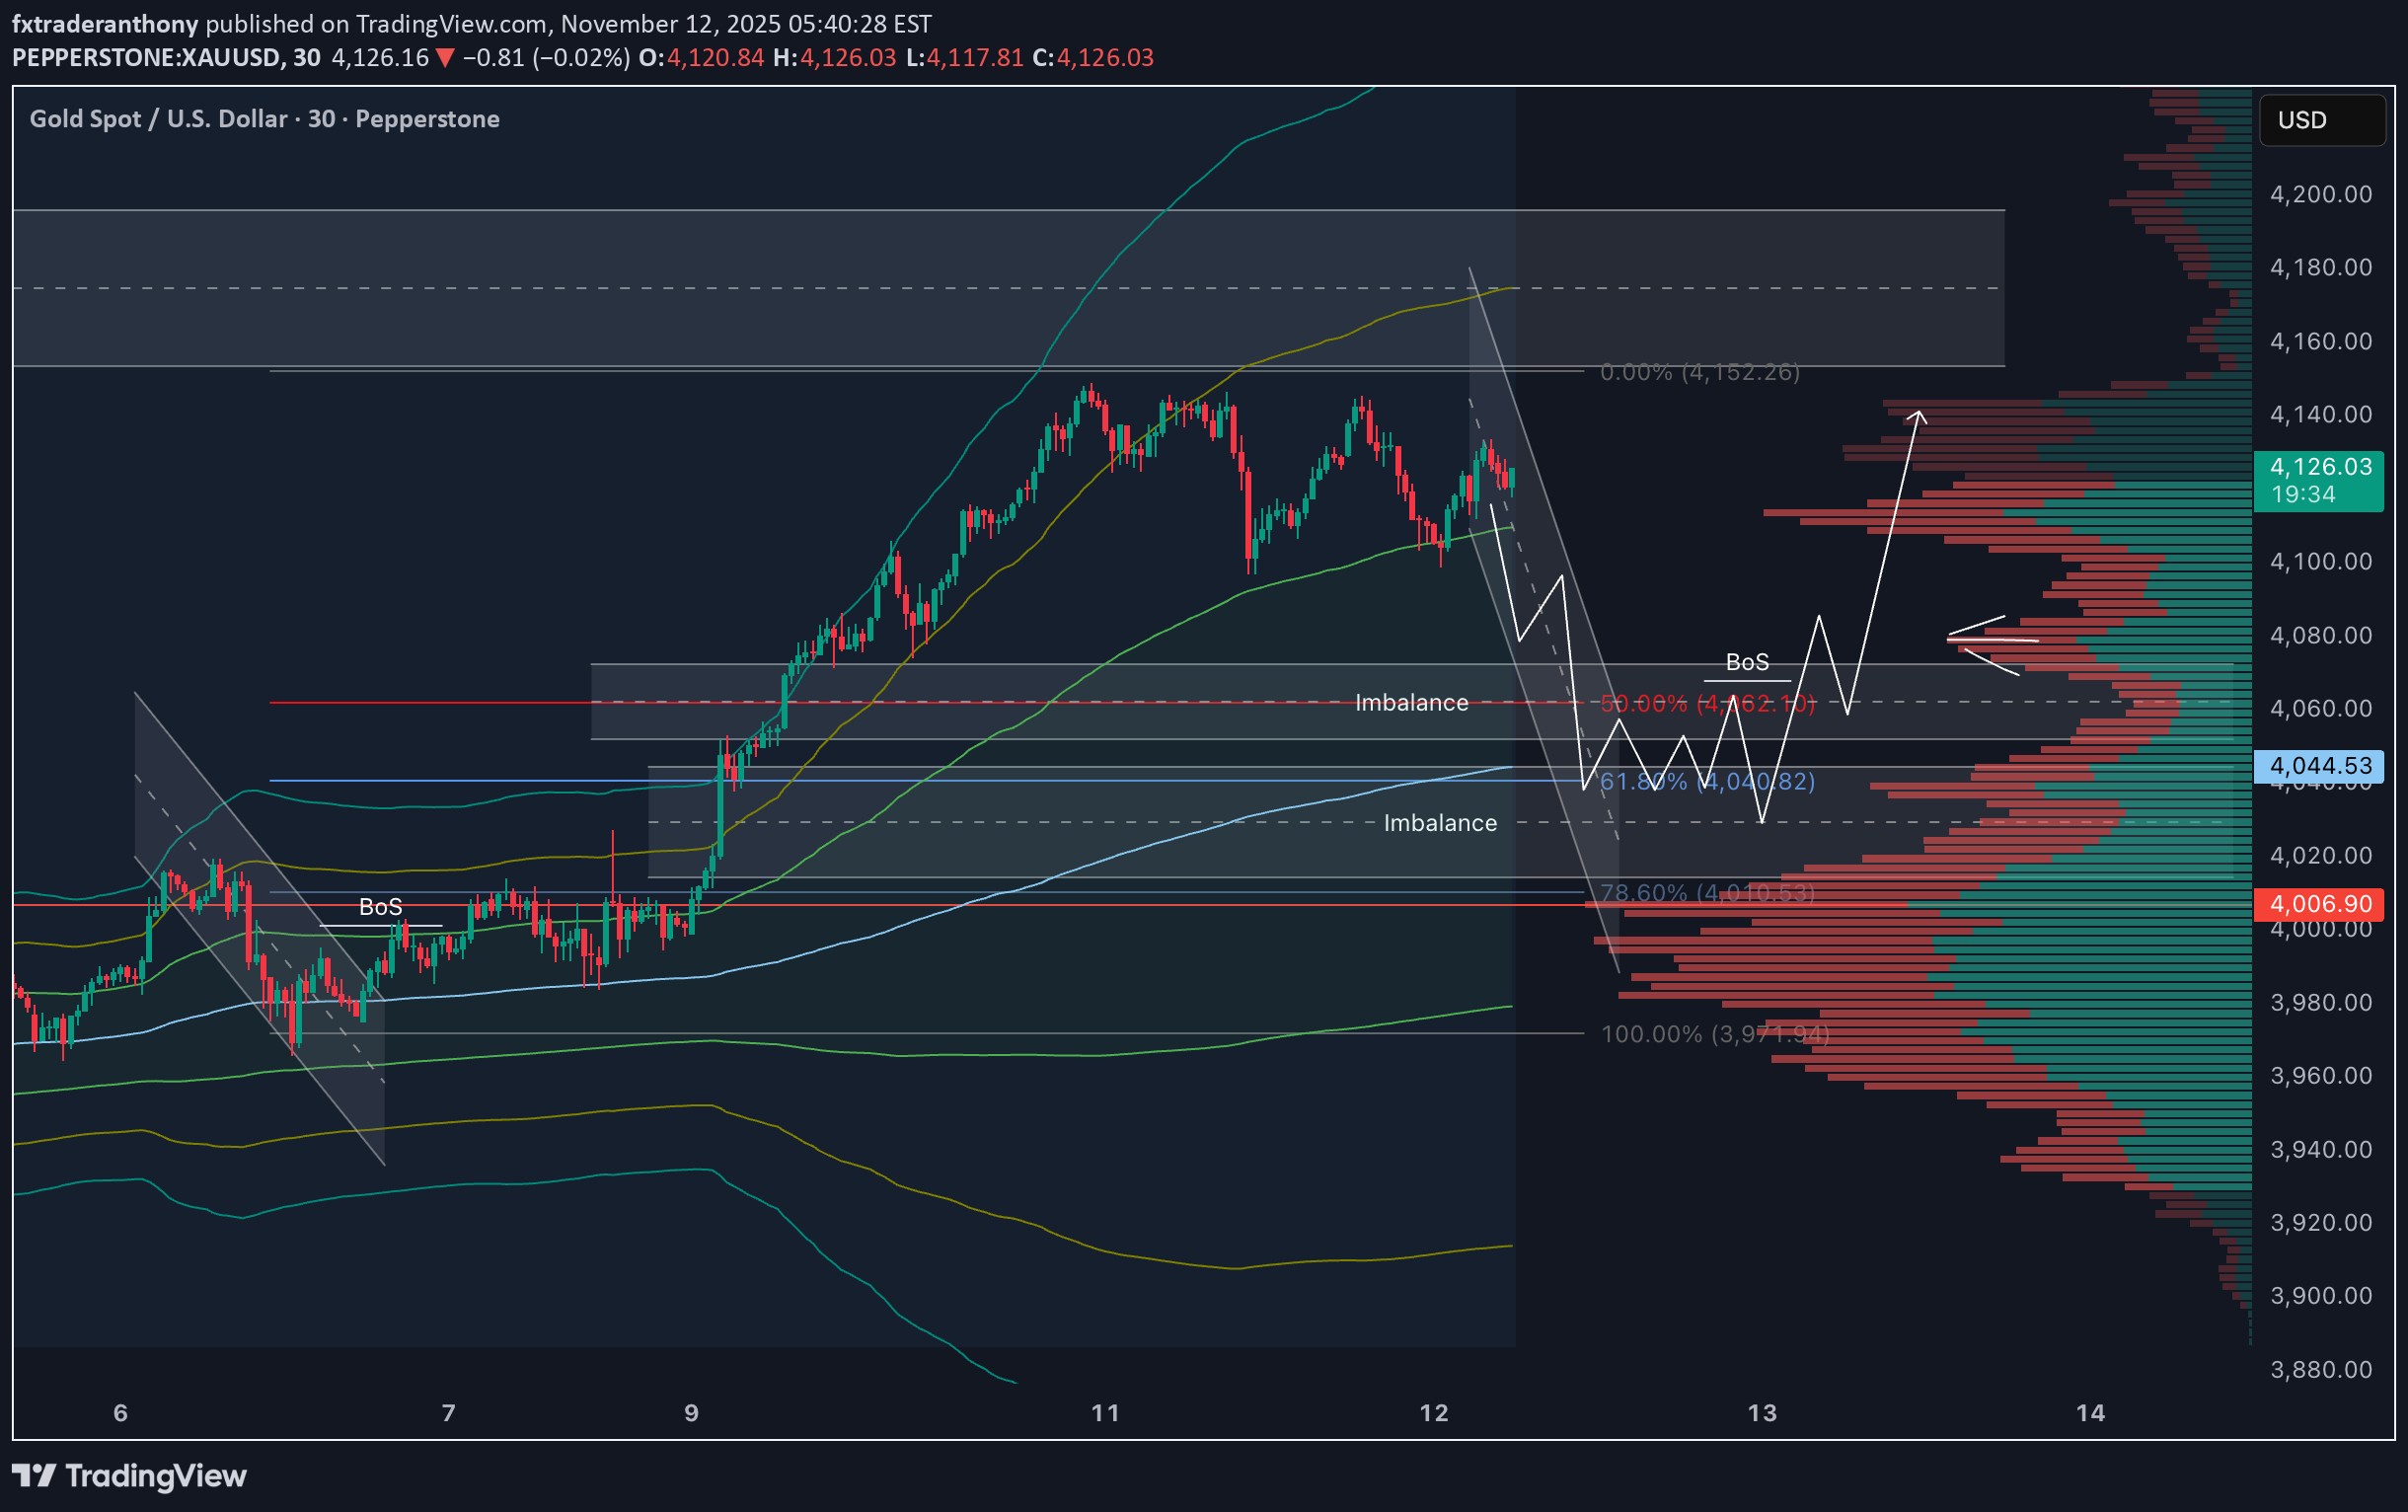
XAUUSD Gold has seen a strong rally recently, pushing into a key resistance zone 🧱. With capital currently rotating out of safe-haven assets like gold and flowing into the stock markets, we could see a potential pullback from this level. 📉 At the moment, I’m avoiding buying at a premium price. Instead, I’ll be watching for a retracement back into equilibrium — around the 50% level of the recent swing range ⚖️. If price pulls back, then breaks market structure to the upside, that could confirm renewed bullish momentum, and I’ll be looking for a long entry setup from that point. 🚀 ⚠️ This analysis is for educational purposes only and not financial advice.
Disclaimer
Any content and materials included in Sahmeto's website and official communication channels are a compilation of personal opinions and analyses and are not binding. They do not constitute any recommendation for buying, selling, entering or exiting the stock market and cryptocurrency market. Also, all news and analyses included in the website and channels are merely republished information from official and unofficial domestic and foreign sources, and it is obvious that users of the said content are responsible for following up and ensuring the authenticity and accuracy of the materials. Therefore, while disclaiming responsibility, it is declared that the responsibility for any decision-making, action, and potential profit and loss in the capital market and cryptocurrency market lies with the trader.