
francismbeg7
@t_francismbeg7

What symbols does the trader recommend buying?
Purchase History
پیام های تریدر
Filter
francismbeg7
btcusd

Ah, you're likely interested in liquidity in the context of this Bitcoin chart! Here's what we can infer about potential liquidity based on your setpoint: * Above the Resistance Zone (around 95,878): The red resistance zone often coincides with areas where sellers are likely to have limit orders placed. If the price breaks above this zone, it could trigger those orders, leading to a burst of selling volume and potentially a sharp move downwards. This area could represent a pool of sell-side liquidity. * Below the Support Level (around 93,919): Similarly, the black support line might attract buyers looking to enter the market or add to their positions. If the price breaks below this level, it could trigger stop-loss orders from buyers, resulting in significant selling pressure and a rapid price decline. This area could represent a pool of buy-side liquidity. * Areas of Consolidation: The sideways price action within the range defined by your support and resistance levels suggests periods where buying and selling forces are relatively balanced. These periods can build up liquidity as more orders accumulate within that range. A breakout from this consolidation could then trigger a significant move as this built-up liquidity is absorbed. * "BUY" Signals and Liquidity: Your "BUY" signals might be strategically placed to anticipate moves that could tap into existing liquidity. For example, a buy signal near the support level could be aiming to capitalize on a bounce driven by buy-side liquidity.In essence, your support and resistance levels are key areas to watch for potential liquidity grabs. A break beyond these levels could indicate a significant influx of volume as resting orders are triggered.Keep an eye on how the price interacts with these zones and any significant volume spikes that might confirm the triggering of liquidity.Is there a specific type of liquidity you're interested in, or perhaps how to trade around these levels?
francismbeg7
Bitcoin is going higher

Through my analysis I have seen that Bitcoin is gonna move a little higher until Monday on New York station we know that the market will make a new high from the last week though
francismbeg7
Add more sell on gold
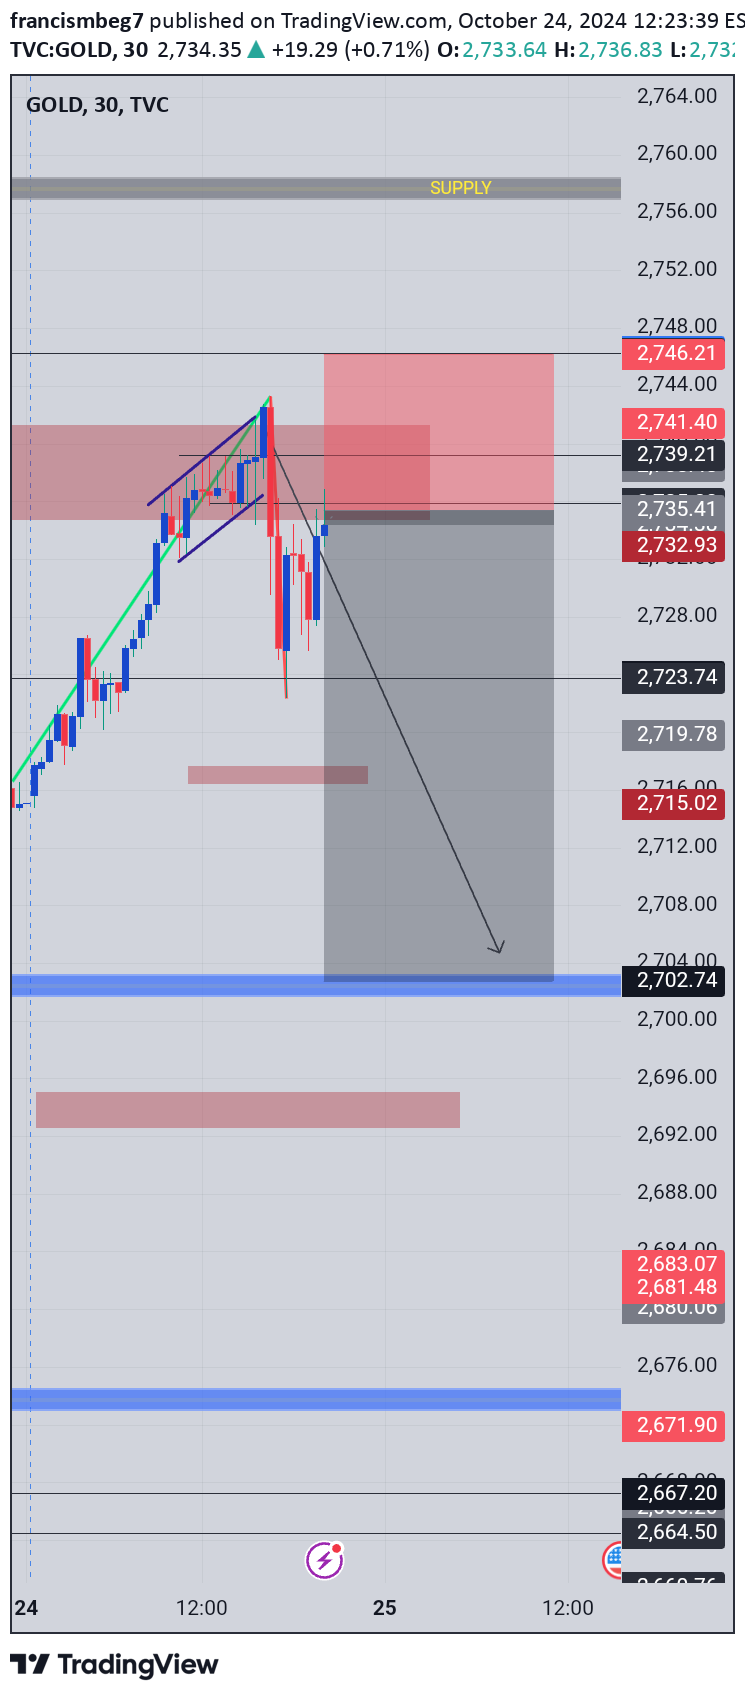
After hit 0.618 we have been see the price is moving to the down side as you can see their is more momentum of selling tomorrow we hold all sell if it help you
francismbeg7
Xauusd

We short from OTP level of fibbo within 13 candlestick o. H1
Disclaimer
Any content and materials included in Sahmeto's website and official communication channels are a compilation of personal opinions and analyses and are not binding. They do not constitute any recommendation for buying, selling, entering or exiting the stock market and cryptocurrency market. Also, all news and analyses included in the website and channels are merely republished information from official and unofficial domestic and foreign sources, and it is obvious that users of the said content are responsible for following up and ensuring the authenticity and accuracy of the materials. Therefore, while disclaiming responsibility, it is declared that the responsibility for any decision-making, action, and potential profit and loss in the capital market and cryptocurrency market lies with the trader.