
forexcapitals123
@t_forexcapitals123

What symbols does the trader recommend buying?
Purchase History
پیام های تریدر
Filter
forexcapitals123
gold is bearish now, we can sell it now

When analyzing the reasons for selling gold on a 1-hour (1H) chart, several technical and market factors might influence the decision to sell. Here are some potential reasons to consider:### 1. **Price Reaches Resistance Levels** - **Resistance Zones**: If gold has approached a previously established resistance level on the 1-hour chart (e.g., a price level where it has reversed in the past), this could suggest that the price is likely to face selling pressure. A failure to break above this resistance could prompt traders to sell. ### 2. **Bearish Technical Indicators** - **Moving Average Crossovers**: A bearish crossover, such as the 50-period moving average crossing below the 200-period moving average (a "death cross"), could signal potential downward momentum, prompting traders to sell. - **RSI (Relative Strength Index)**: An RSI above 70 may indicate that gold is overbought, and traders may anticipate a price pullback, leading to selling activity. - **MACD (Moving Average Convergence Divergence)**: A MACD bearish crossover (when the MACD line crosses below the signal line) can indicate weakening bullish momentum and a potential sell signal.### 3. **Price Action (Candlestick Patterns)** - **Bearish Candlestick Patterns**: Patterns such as "Engulfing" (a large bearish candle followed by a smaller bullish candle) or "Doji" (indicating indecision) after a rally may suggest that sellers are starting to dominate, potentially leading to a price reversal. - **Rejection at Key Levels**: If gold tests a key support or resistance level and then forms a bearish candlestick (like a pin bar or shooting star), it may signal a reversal, prompting traders to sell.### 4. **Divergence** - **Bearish Divergence**: If the price of gold is making new highs, but technical indicators like the RSI or MACD are making lower highs, this can indicate that momentum is weakening, and a reversal could be near. Traders may sell in anticipation of a price decline.### 5. **Overbought Conditions** - **Price Surge Without Fundamentals**: If gold has surged due to market speculation without strong fundamental backing (e.g., geopolitical events or inflationary fears), traders may view it as overbought, especially when the price is far from key support levels. - **Excessive Buying Volume**: A rapid increase in buying volume, followed by a slowdown or reversal, might indicate that the buying has been exhausted, leading traders to sell.### 6. **News or Economic Data** - **Hawkish Central Bank Stance**: If economic data or central bank announcements suggest that interest rates are likely to rise or monetary policy will tighten, gold prices may fall as investors shift to higher-yielding assets. This could trigger sell-offs. - **Strong Economic Data**: Positive economic reports (such as better-than-expected GDP or employment data) can reduce the demand for gold as a safe-haven asset, leading to selling.### 7. **Market Sentiment Shifts** - **Risk-On Sentiment**: If investors become more risk-on, driven by positive news or a recovery in stock markets, they might sell gold (a safe-haven asset) in favor of riskier assets like equities, leading to downward pressure on gold prices. - **Commodity Price Movement**: If other commodities or the U.S. Dollar show signs of strengthening, it might influence gold prices to drop, especially if there is an inverse correlation.### 8. **Profit-Taking** - **End of Uptrend**: After a strong upward move, some traders may decide to lock in profits, especially if they believe the gold price has reached a peak or the market is overextended.In summary, the decision to sell gold on a 1-hour chart could be based on a combination of technical indicators, price action, market sentiment, and economic factors. Traders often look for confirmation of signals before making decisions, so a confluence of several of these factors can increase the probability of a successful trade.
forexcapitals123
gold will hitt 2495 soon . ATH , its bullish trade
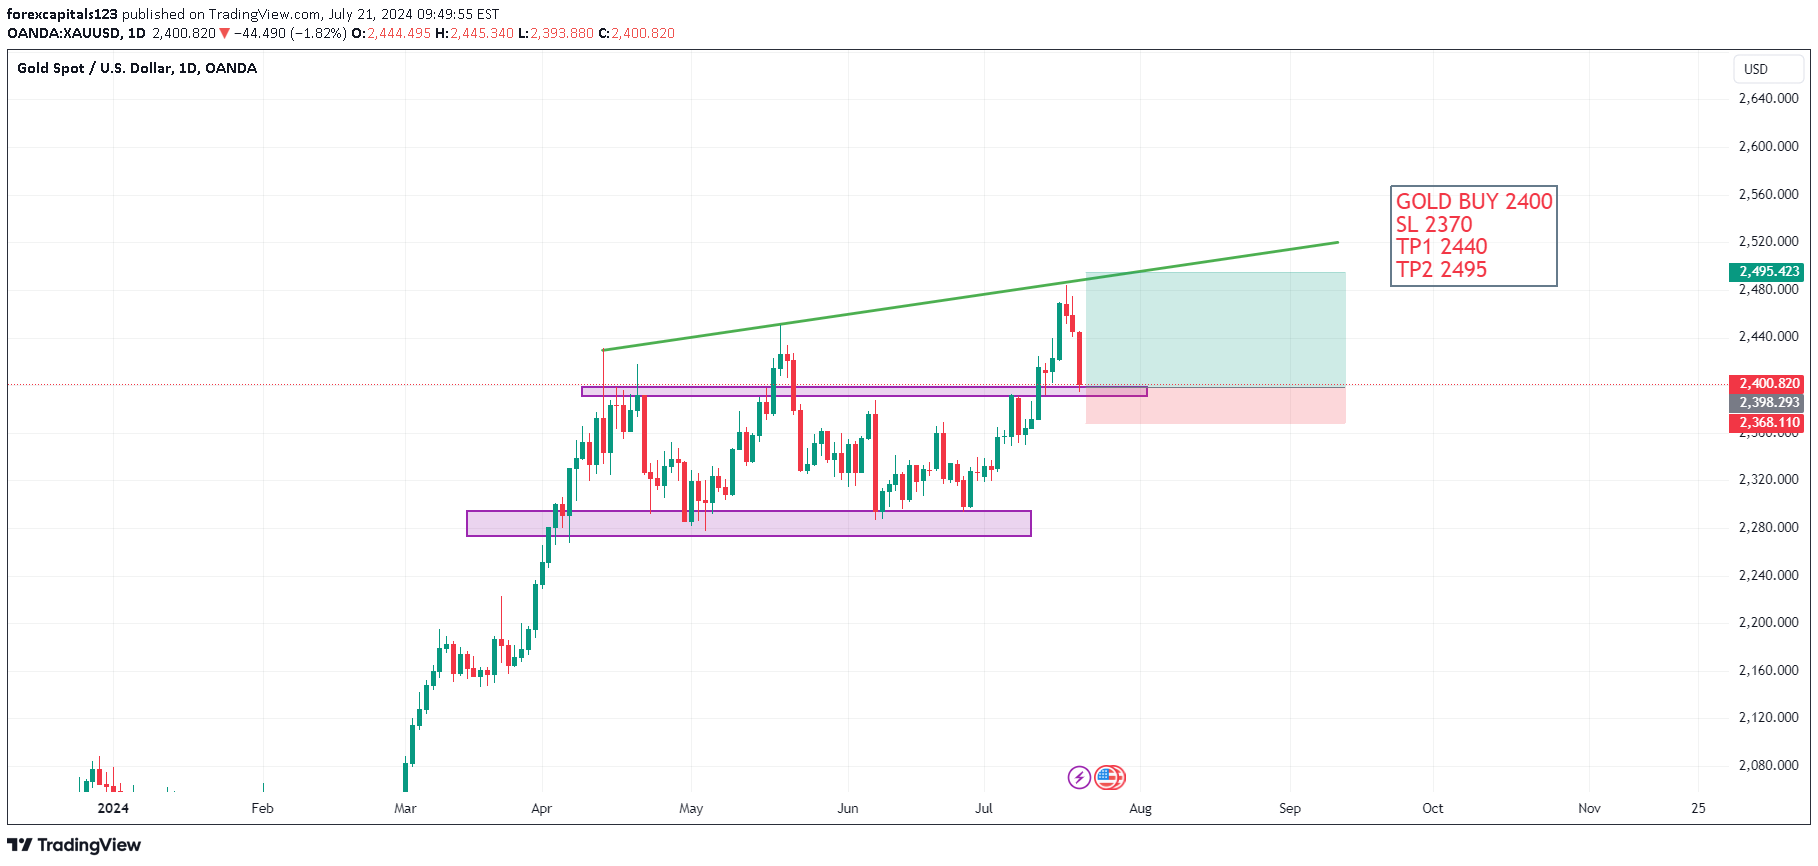
After a significant decline of over 700 pips from its all-time high, I anticipate a potential upward movement exceeding 500 pips for gold. Based on technical analysis, the 2400-2390 zone on the daily chart presents a strong support level, offering a strategic entry point for long positions. A recommended entry at 2400, with a stop loss at 2380, is proposed for this trade setup.The following reasons underpin this trade strategy:1. **Technical Support**: The 2400-2390 range has consistently acted as a support level on the daily chart. Historical price action suggests a high probability of a price rebound from this zone. 2. **Potential for Upside**: If gold rebounds from the 2400-2390 support zone, it could rally towards the 2495 level. This target is based on previous resistance levels and Fibonacci retracement analysis, indicating a robust potential for upward movement.3. **Risk Management**: A stop loss at 2380 minimizes downside risk, ensuring losses are contained if the price moves against the position. Starting with small initial positions allows for flexibility to scale into the trade as confirmation signals emerge, enhancing risk-adjusted returns.4. **Market Sentiment and Macroeconomic Factors**: Current market sentiment and broader economic indicators support the likelihood of a bullish reversal. Factors such as inflation expectations, central bank policies, and geopolitical uncertainties could further drive gold prices higher.5. **Volume Analysis**: Increased trading volume in the 2400-2390 support zone indicates strong buying interest, reinforcing the validity of this support level.Effective risk management is paramount in this trading strategy. Adhering to the stop loss and position-sizing guidelines will help mitigate potential losses while maximizing the opportunity for gains. This disciplined approach ensures a balanced risk-reward ratio and enhances the probability of successful trade outcomes.
forexcapitals123
gold is looking bullish, will hit 2345 soon.

Based on my technical analysis, gold has reached an all-time high with a current price of $2,469 USD. Indicators on the daily chart suggest that gold is currently overbought, and a retracement is likely. Historically, gold tends to drop after forming a new high, and it is now forming its third consecutive peak in this pattern.Considering this, I predict a bearish movement of approximately 350 pips, bringing the price down to around $2,445 USD before potentially resuming its upward trend. This prediction is supported by past price behavior and overbought conditions observed in the market.It is crucial to use stop-loss orders and follow risk management practices to mitigate potential losses during this anticipated retracement.TP 1 HITshift SL at entry point___________________
forexcapitals123
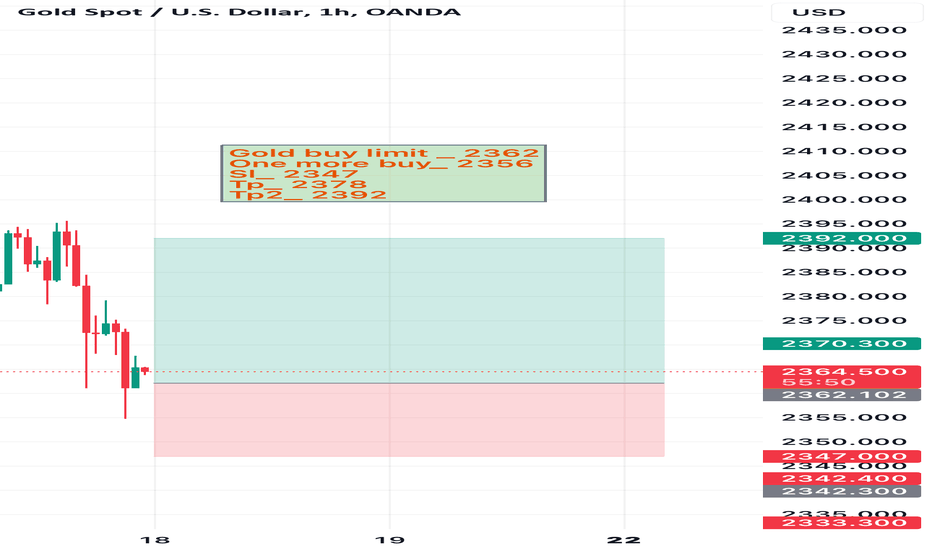
gold will hit 2350 soon. its bearish

Based on the current market analysis, we recommend the following trade setup for gold: **Trade Recommendation:** - **Sell Entry:** 2363 - **Stop Loss (SL):** 2373 - **Take Profit (TP):** 2350 **Rationale:** 1. **Technical Analysis:** The entry point at 2363 is identified as a strategic level based on recent price action and technical indicators, suggesting a potential downturn from this point. 2. **Risk Management:** The stop loss is set at 2373 to limit potential losses in case the market moves against the trade. This level is chosen to provide a balance between risk and the likelihood of market fluctuations triggering the stop. 3. **Profit Target:** The take profit level is placed at 2350, aiming to capture gains from the expected downward movement while considering key support levels and potential market behavior. This setup is designed to maximize profit potential while managing risk effectively in the current market conditions.
forexcapitals123
gold is barish . it will hit 2345 soon

- **Instrument:** Gold (presumably referring to the spot price or a futures contract) - **Sell Price:** 2364 - **Take Profit Levels:** - TP1 (Take Profit 1): 2345 - TP2 (Take Profit 2): 2355 - **Stop Loss:** 2375 These parameters suggest a bearish outlook on gold, with an entry at 2364 and targets set lower at 2345 and 2355. The stop loss at 2375 indicates the maximum acceptable loss level should the trade move against the anticipated direction. This setup reflects a structured approach to trading, incorporating both profit-taking levels and risk management through a stop loss, adhering to established trading principles aimed at managing risk and potential returns effectively.
forexcapitals123
Gold is bullish again_ will hit 2392
Gold is currently exhibiting a bullish trend, indicating that it is likely to surpass the resistance area and achieve new highs in the near future. It is crucial to employ proper risk management strategies during this period. Although gold experienced a significant drop, now is the opportune time to regain its position at the top.
forexcapitals123
Btc will hit 69000 again , #bearish

Btc is trading at its high level, as we predicted yesterday that it will hit 69000 and it hitted and we secured 300 pips , after it it touched another high Now we are predicting again that it will hit 71000 and then will hit 69000 . Btcusd sell 73200 Sl 75000 Tp 71000 Tp2 69000 Use sl at every cost
forexcapitals123
gold is bullish , hit 2025 soon # xauusd

radeIdea 👉🥇🇻🇦🚀👈XAUUSD Forecast! ☕️ Dear traders, brew some tea and prepare for FBS analysts' long-term forecast❗️ ⭐️ In the 1-month timeframe, XAUUSD formed a 'Cup and Handle Pattern", which signals bullish momentum. The asset has already broken above the resistance line and rushed to the top: 😵 Target 1: TP 2300.00; 😵 Target 2: TP 2500.00. 😶🌫️ Do you believe the target will be achieved during 2024?Comment: 350 pips move
forexcapitals123
gold (xauusd) is looking bearish. can hit 2005 soon

gold (xauusd) is looking bearish. can hit 2005 soon gold is looking bearish, after ppi data , gold moved bearish wick and then took uptrend but now its time to enter in sell channel again. we can sell from 2024 and sl should be 2031.
forexcapitals123
gold is looking sell to 1995 , #bearish

we can put sell stop at 2012 with sl 2017 and 1st tp is 2005 and 2nd tp is 1995.
Disclaimer
Any content and materials included in Sahmeto's website and official communication channels are a compilation of personal opinions and analyses and are not binding. They do not constitute any recommendation for buying, selling, entering or exiting the stock market and cryptocurrency market. Also, all news and analyses included in the website and channels are merely republished information from official and unofficial domestic and foreign sources, and it is obvious that users of the said content are responsible for following up and ensuring the authenticity and accuracy of the materials. Therefore, while disclaiming responsibility, it is declared that the responsibility for any decision-making, action, and potential profit and loss in the capital market and cryptocurrency market lies with the trader.