
financialfreedomgoals101
@t_financialfreedomgoals101

What symbols does the trader recommend buying?
Purchase History
پیام های تریدر
Filter
بیت کوین به زیر 70,000 دلار سقوط میکند؟ تحلیل موج نزولی جدید BTC
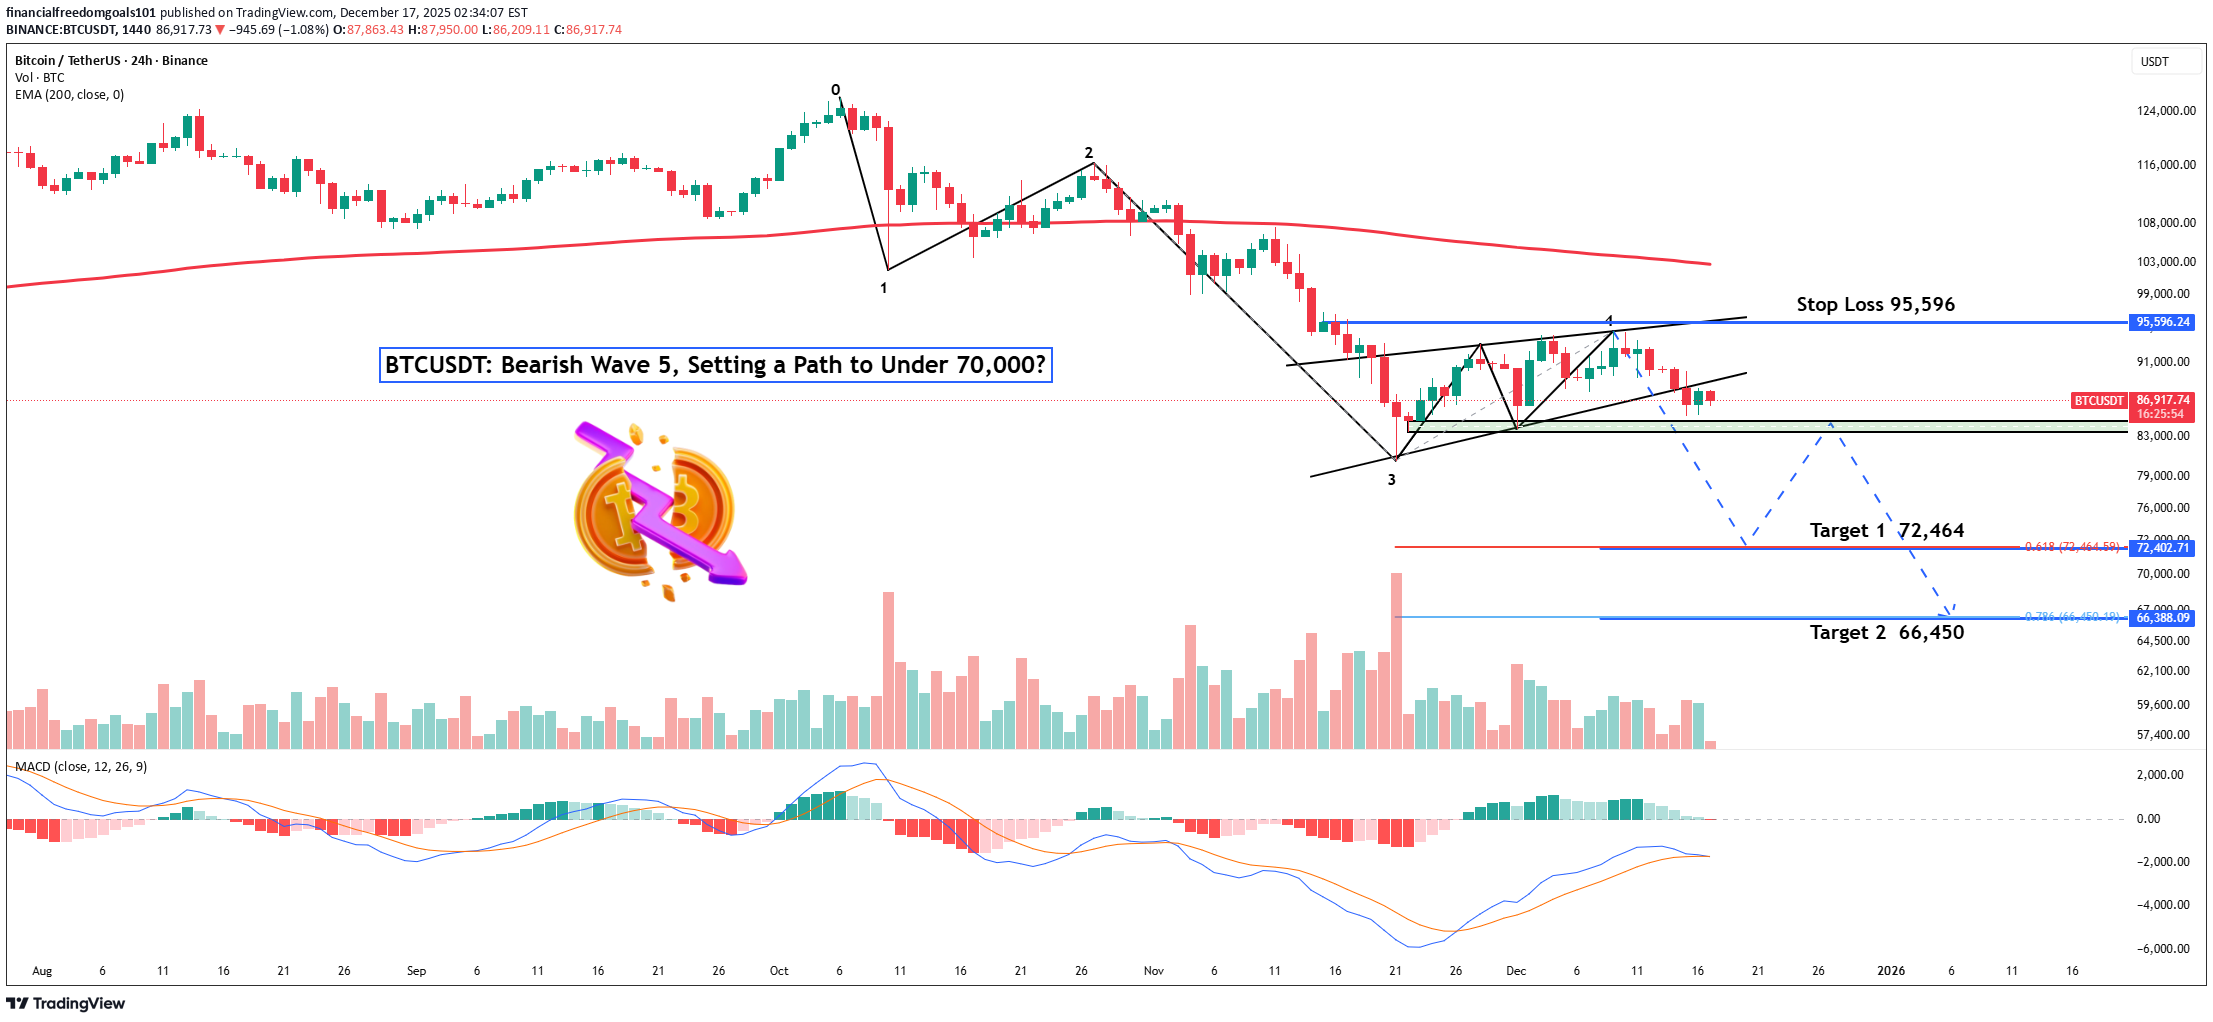
Hey Realistic Traders! “Bitcoin Is Riding Bearish Reversal Momentum, Is a New Lower Low on the Horizon?” Let’s dive into the technical analysis to answer this question and see what the chart is really telling us. Technical Analysis On the daily chart, BTCUSDT has moved below the EMA200 line. Each rebound has failed to break above, and price has rarely even touched the EMA200, reinforcing the strength of the broader bearish trend. During the Wave 4 formation, BTCUSDT consolidated within a rising wedge pattern, a corrective structure that typically appears as upside momentum weakens within a larger downtrend. A decisive breakdown from this pattern signals renewed bearish pressure and often marks the beginning of Wave 5 in Elliott Wave theory. Following the breakdown, a bearish MACD crossover occurred, adding confirmation to the bearish bias. Together, these signals strengthen the view that momentum is shifting back in favor of the bears. Based on Fibonacci projections, Wave 5 may extend toward the 0.786 Fibonacci ratio, aligning with the second downside target near 66,450. Before reaching that level, price may encounter a historical support zone around the first target at 72,464, where a temporary pullback could occur. This bearish wave count remains valid as long as price stays below the stop-loss level at 95,596 . A move above this level would invalidate the potential Wave 5 formation and shift the outlook back to neutral. Support the channel by engaging with the content, using the rocket button, and sharing your opinions in the comments below 🚀 Disclaimer: Please note that this analysis is solely for educational purposes and should not be considered a recommendation to take a long or short position on Bitcoin.An Inverted Bearish Hammer formed near the lower trendline, signaling a bearish bias
طلا پس از اصلاح، به قله جدید میرسد؟ هدف بعدی 4268 دلار!
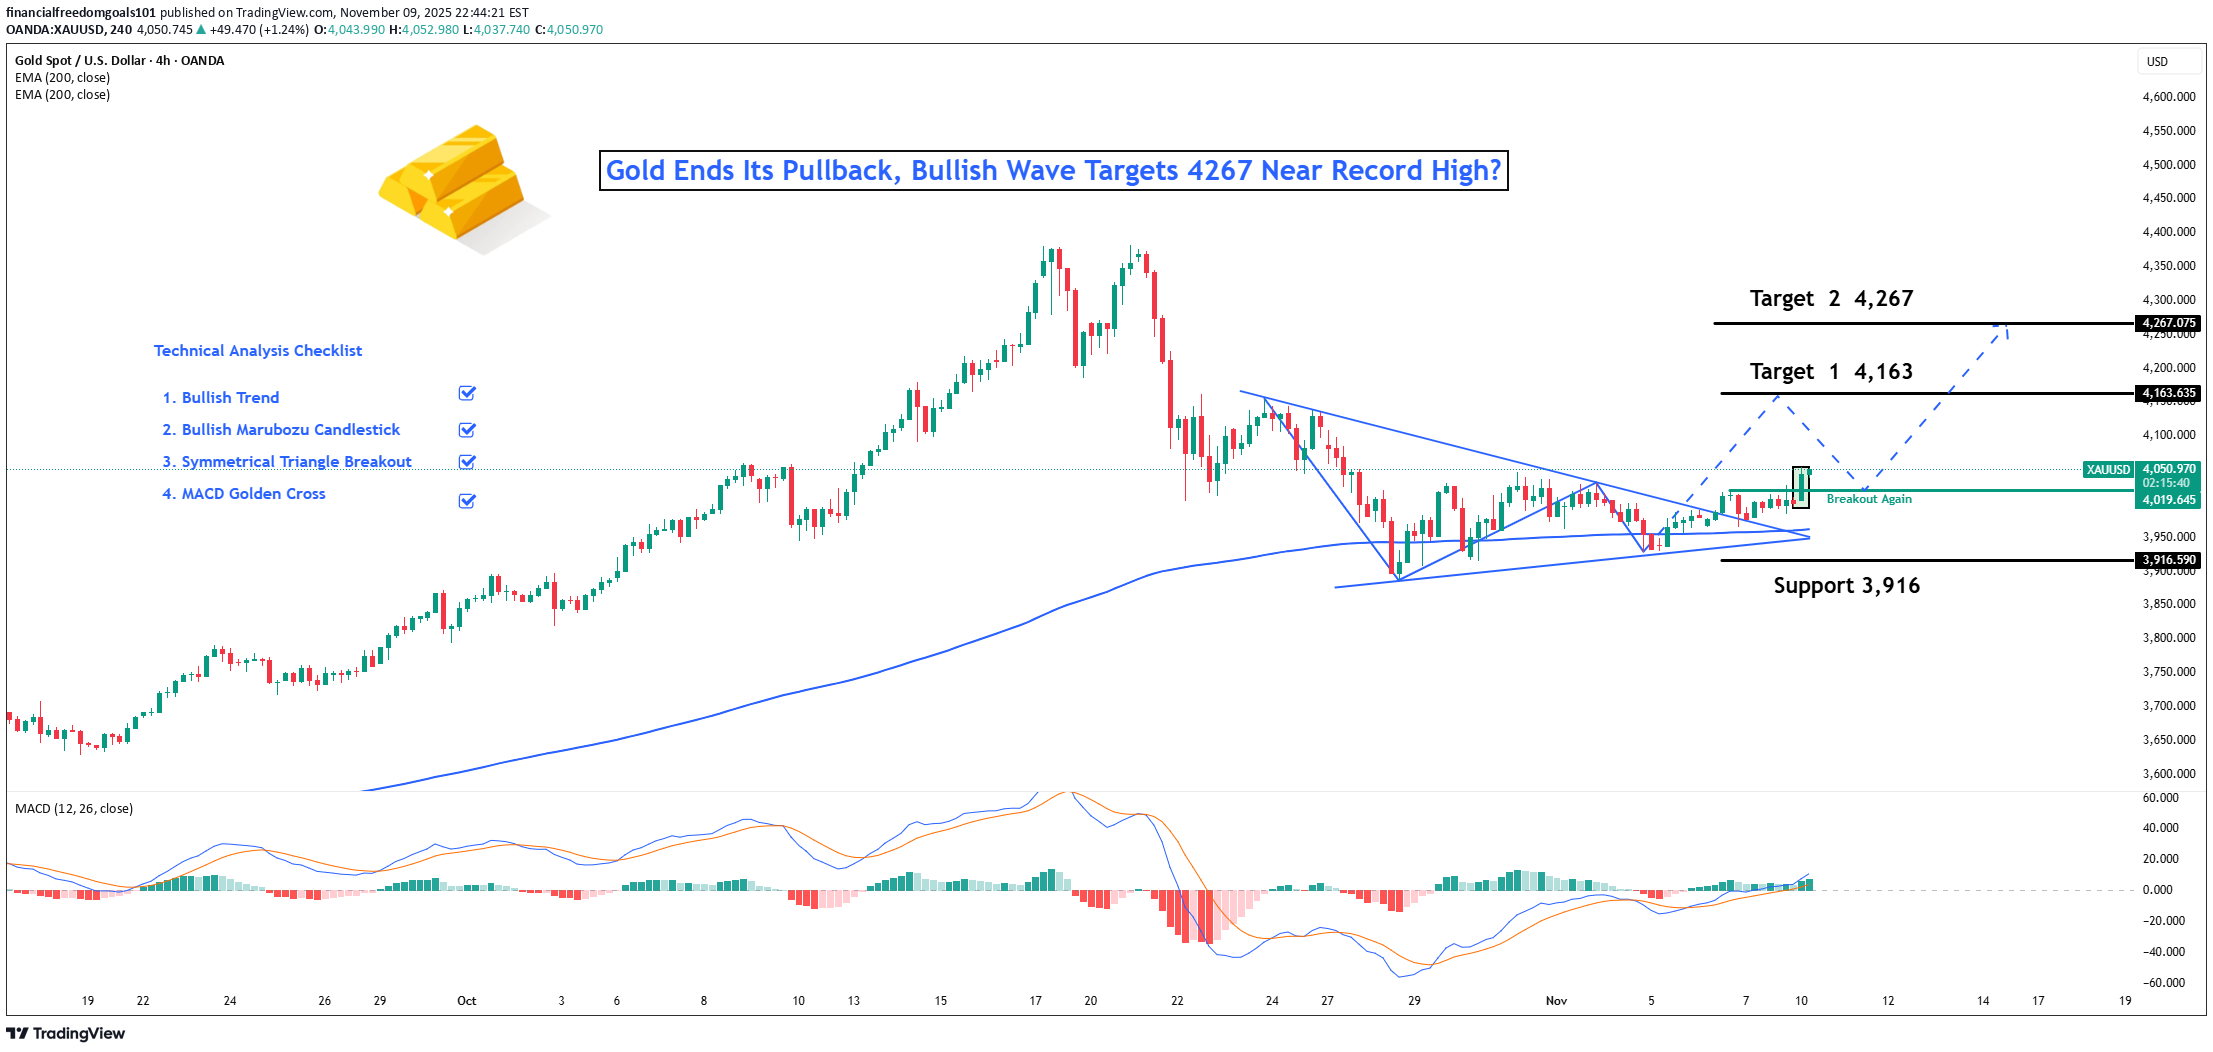
Hey Realistic Traders! "XAUUSD Correction Wave is Over, Could This Be the Next Big Move?" Let’s dive into the technical analysis to see what the chart is really telling us. Technical Analysis On the daily chart, XAUUSD has rebounded once again around the EMA200, with multiple bounces confirming the strength of its broader bullish trend. Afterward, Gold consolidated within a symmetrical triangle pattern, a formation that often appears as a corrective phase within an uptrend where selling pressure gradually weakens. A breakout from this pattern typically marks the beginning of a new bullish wave. The recent breakout was accompanied by strong momentum. A bullish Marubozu candlestick highlighted renewed buying interest, while the MACD golden cross added confirmation to the bullish bias. Together, these signals reinforce the case for a continuation of the prevailing uptrend. In this scenario, the first upside target is located near 4,163 , aligning with a historical resistance area, where a short-term pullback may occur. If bullish momentum continues, XAUUSD could extend higher toward the second target near 4,267, just below its all-time high. This bullish outlook remains valid as long as the price stays above 3,916. A move below that level would invalidate the setup and shift the outlook back to neutral. Beyond technicals, Gold’s bullish outlook is also supported by a broader macro trend, as many central banks continue to reduce their U.S. dollar exposure and increase gold allocations in their reserves, adding further strength to the long-term bullish narrative. Support the channel by engaging with the content, using the rocket button, and sharing your opinions in the comments below. Disclaimer: "Please note that this analysis is solely for educational purposes and should not be considered a recommendation to take a long or short position on Gold."Almost Hit the First Target Again, The impulsive series of bullish candlestick made us maintain the second target for XAUUSD Bullish Outlook.Finally, exceeded the second target, you can consider taking your profit :D
Gold Bulls Back in Control as Trump Pressures Fed for Rate Cuts
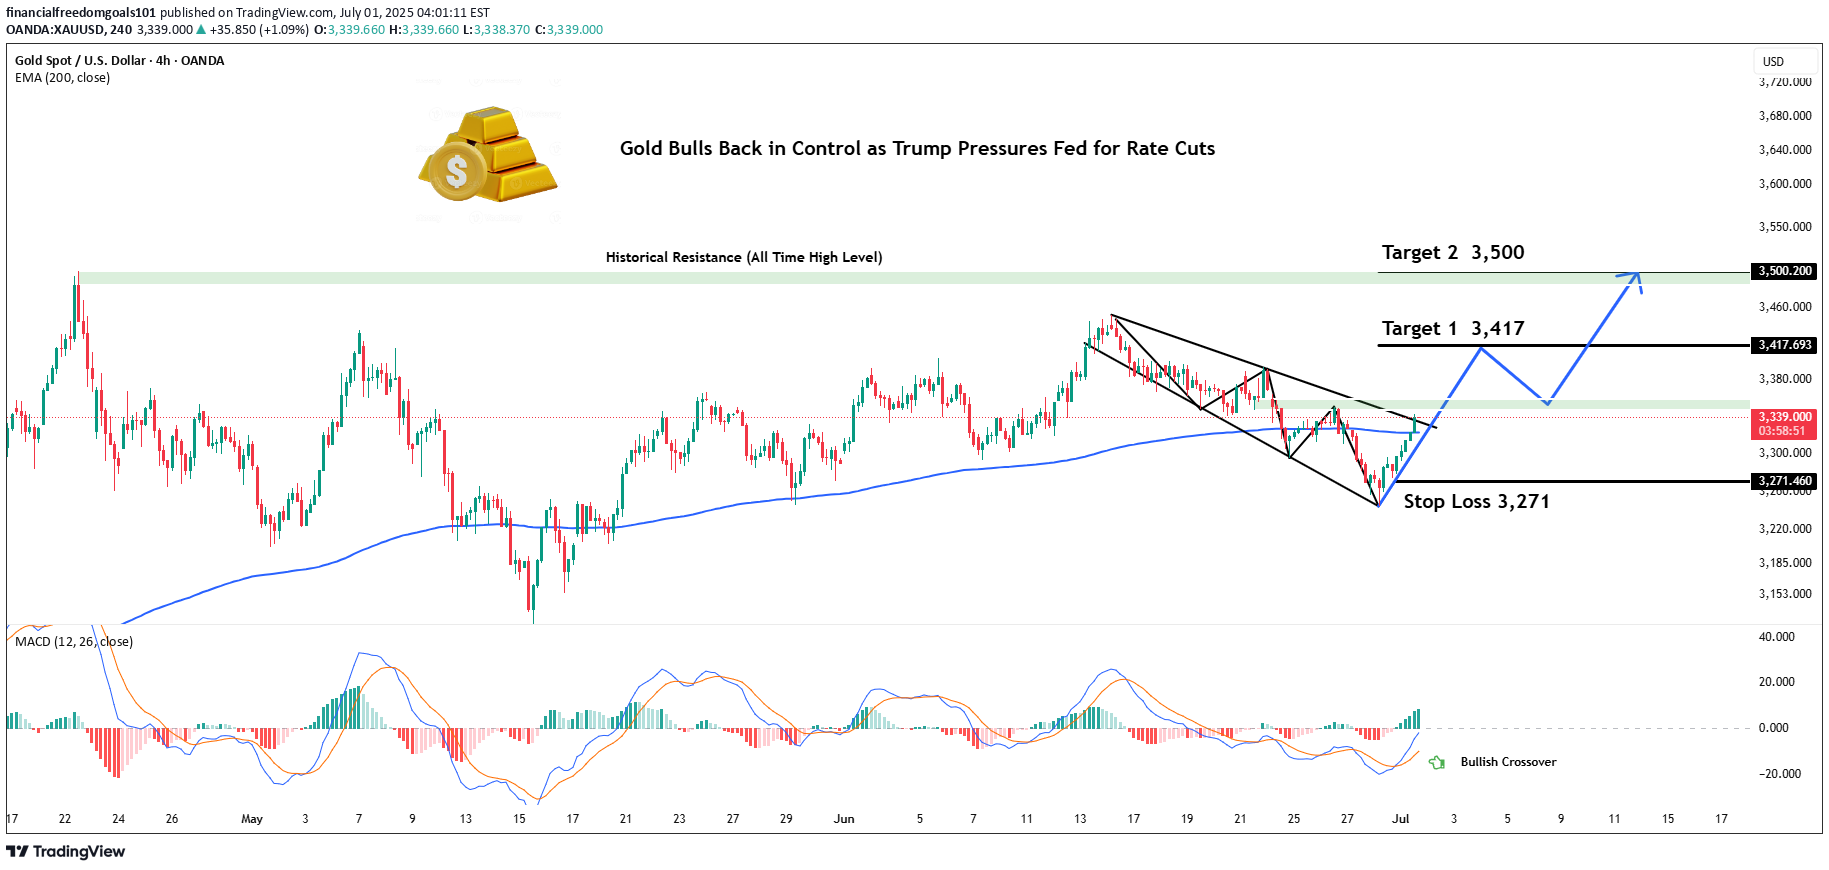
Hey Realistic Traders! President Trump is ramping up pressure on the Fed to cut interest rates , saying the U.S. is falling behind countries with looser policies. As several Fed officials begin to shift their stance, expectations for rate cuts are growing. That’s putting pressure on the dollar and giving gold a fresh boost. We’ll take a closer look at what this means for XAUUSD (Gold) through technical analysis and explore its upside potential. Technical Analysis On the 4-hour chart, Gold has moved above the EMA-200, signaling a shift in momentum to the upside. Price has also broken out of a Descending Broadening Wedge (DBW) pattern, which often indicates the start of a bullish trend. The breakout was confirmed by a Bullish Marubozu candle, reflecting strong buying pressure. To add further confirmation, the MACD has formed a bullish crossover, reinforcing the upward momentum. Looking ahead, the first target is seen at 3417. If reached, a minor pullback toward the historical resistance zone (green area) may occur, with a potential continuation toward the second target at 3500. This bullish outlook remains valid as long as the price stays above the stop-loss level at 3271 . A break below this level would invalidate the setup and shift the outlook back to neutral. Support the channel by engaging with the content, using the rocket button, and sharing your opinions in the comments below. Disclaimer: "Please note that this analysis is solely for educational purposes and should not be considered a recommendation to take a long or short position on XAUUSD.We remains bullish as the price has rebounded from the upper trendline with an impulsive moves If the price breaks beyond the latest resistance level, we foresee a potential upward movement to the target 1another breakout of the H4 timeframe, we remains bullish on GOLDFinally, it surpassed the first target. We remain positive. It can reach the second target at 3500 You can trail your stop loss to minimize the risk of losing your profit. Wish you the best luck :D
Solana Bearish Divergence, 20% Drop Incoming?
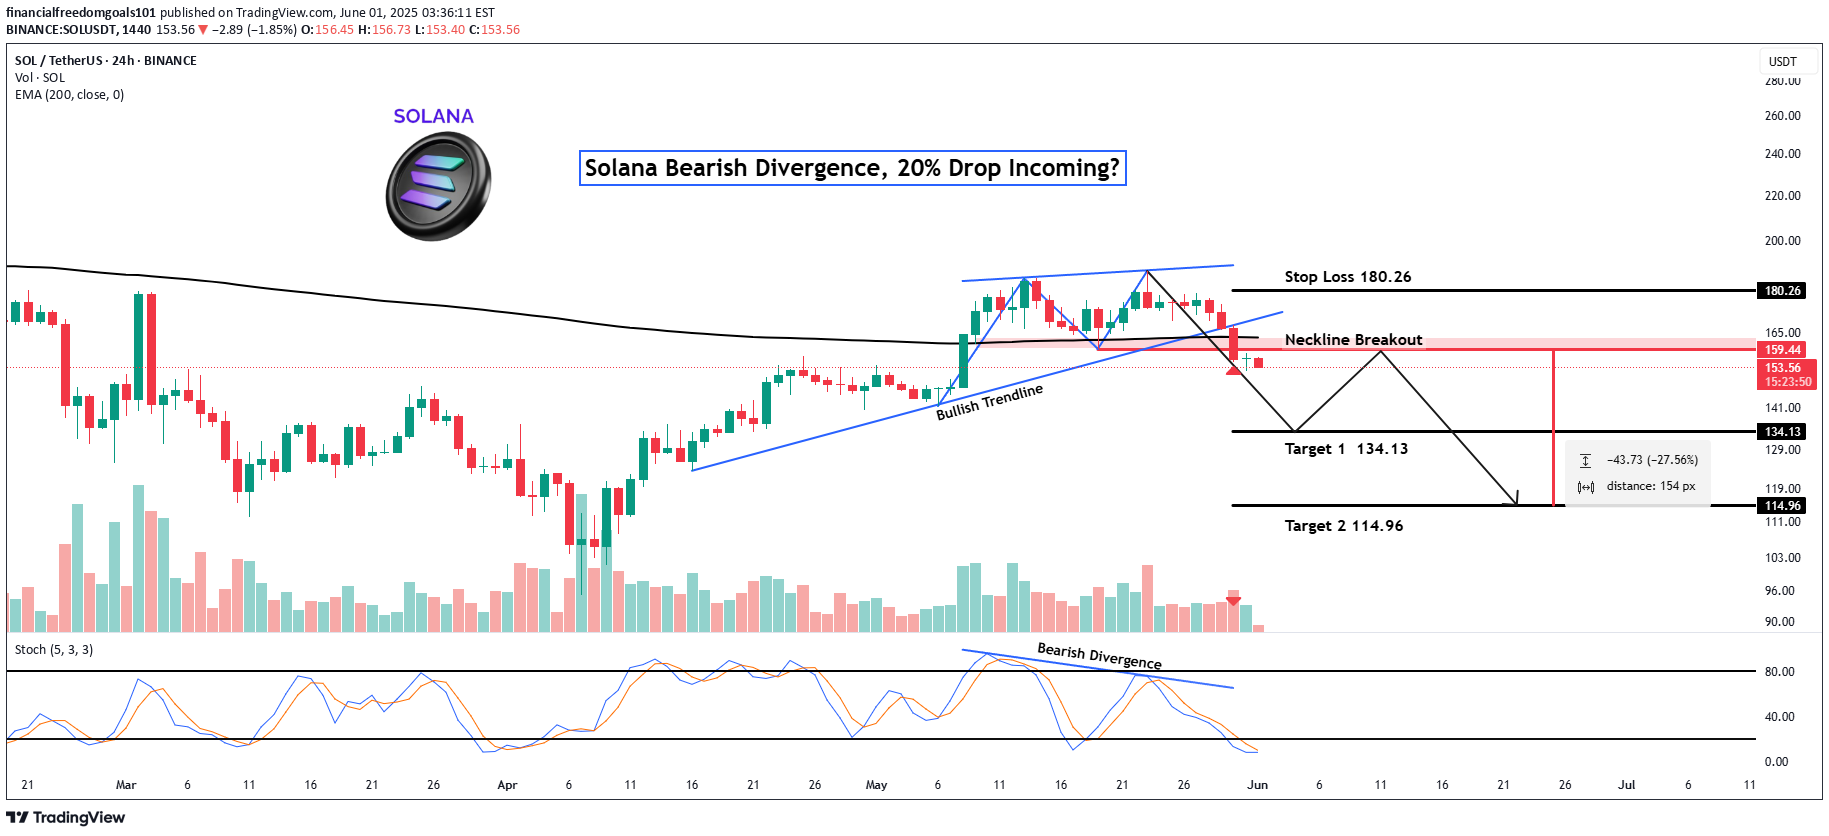
Hey Realistic Traders!Bearish Signal Flashing on SOLUSDT, What Signals Are Showing? Let’s Break It Down..On the daily timeframe, Solana has formed a double top pattern, followed by a neckline breakout, which is a classic sign of a potential shift from a bullish to a bearish trend.This breakout was confirmed by a break of the bullish trendline, accompanied by rising selling volume, which reinforces the bearish momentum. Adding to this, a bearish divergence has appeared on the stochastic oscillator. Bearish divergence occurs when price makes higher highs while the oscillator forms lower highs, signaling weakening buying pressure and increasing the likelihood of a reversal.Given these technical signals, the price is likely to continue moving lower toward the first target at 134.13, with a possible extension to the second target at 114.96.This bearish outlook remains valid as long as the price stays below the key stop-loss level at 180.26.Support the channel by engaging with the content, using the rocket button, and sharing your opinions in the comments below.Disclaimer: "Please note that this analysis is solely for educational purposes and should not be considered a recommendation to take a long or short position on Solana.- Retested on the neckline structure- And formed a Bearish Marubozu Candlestick- Signal a continuation of the medium term bearish trend
XRPUSDT: Turning Bullish, Chart Signals +20% Upside Potential
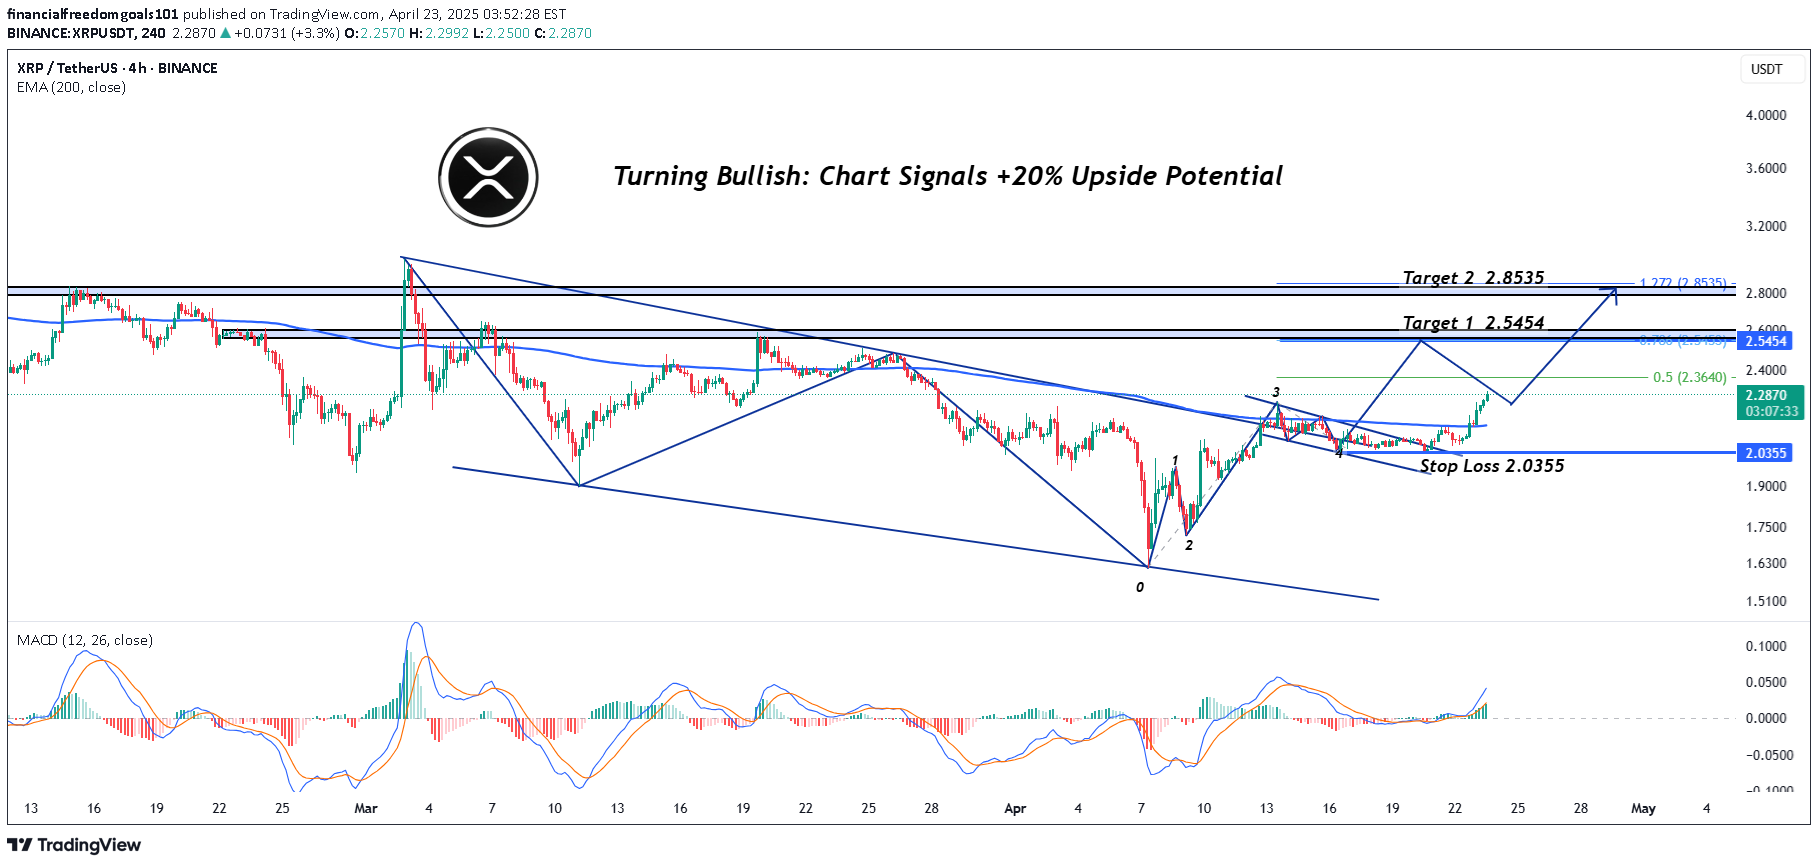
Hey Realistic Traders! Is XRPUSDT Gearing Up for a Major Bull Run or Just Faking Us Out Again? Let’s Break It Down...XRPUSDT has finally broken out of its bearish channel, and price action is holding strong above that zone. This is a solid indication that bulls are gaining control. Shortly after the breakout, a smaller falling wedge formed, which is typically a bullish continuation pattern.What adds further interest to this setup is that the falling wedge appears to be developing during what may be Wave 4 of the Elliott Wave cycle. While Wave 4 is usually corrective, it can occasionally take the form of a wedge or triangle-like pattern. If this interpretation holds, it would suggest that a bullish Wave 5 may follow, often the final impulse leg in the trend.Zooming into the 4-hour chart, a fresh breakout has just occurred, further strengthening the bullish case. Adding to this, the MACD has printed a golden cross, a classic momentum signal that supports the outlook for continued gains.With all these factors aligning, the first target is set at 2.5454. A minor pullback could occur at that level before price continues its move toward the second target at 2.8535. Both targets have been calculated using Fibonacci extension levels from the current bullish wave.This outlook remains valid as long as the price stays above the stop-loss level at 2.0355.Support the channel by engaging with the content, using the rocket button, and sharing your opinions in the comments below.Disclaimer: "Please note that this analysis is solely for educational purposes and should not be considered a recommendation to take a long or short position on Ripple.You can observe the higher timeframe. Price has moved above the EMA and trendline simultaneously. This is main reason why we remain bullish on XRPUSDT.break the latest resistance, another confirmation for our bullish outlookAm I the only one, not finding a ideal setup lately??At Last, the first target hit after several weeks of waiting and wandering around lol
Bullish Momentum Building, $112K Breakout on the Horizon?
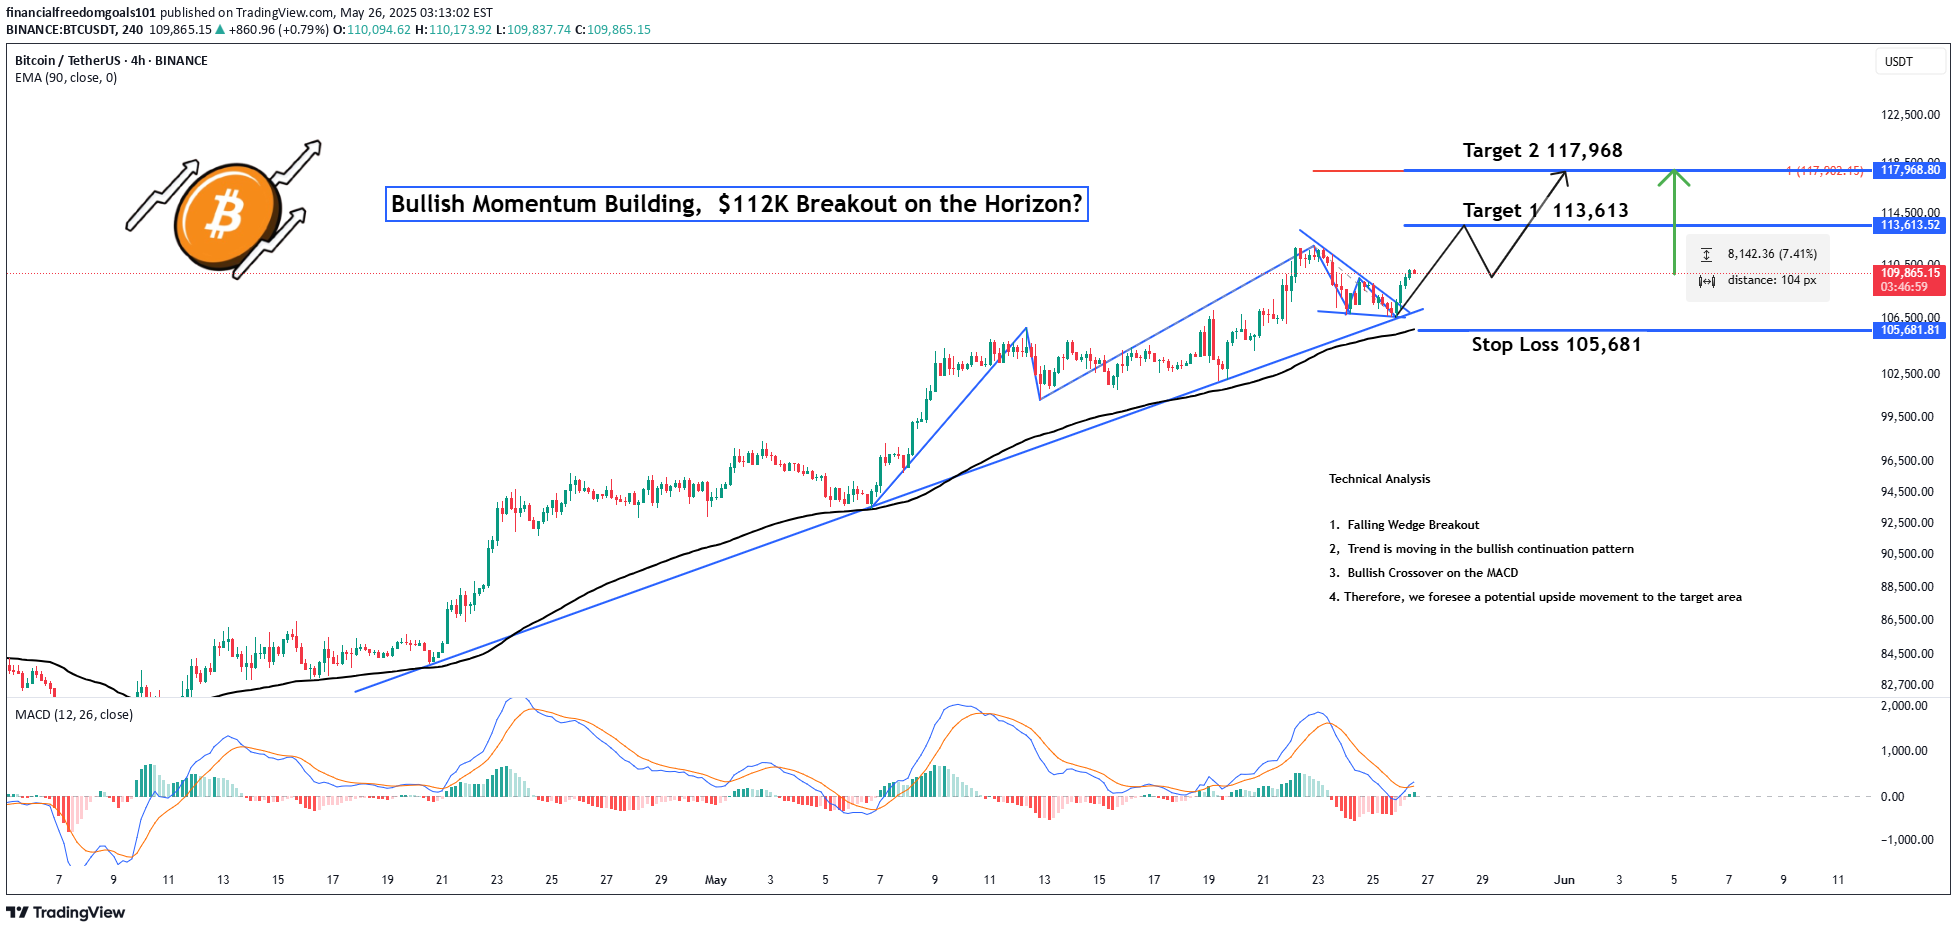
Hey Realistic Traders!Can BTCUSDT Break Past $112K and Set a New All-Time High? Let’s Break It Down...Trend AnalysisOn the H4 timeframe, BTCUSDT has consistently traded above the EMA-90 line, confirming the continuation of a bullish trend. Within this trend, a falling wedge pattern formed, which is typically considered a bullish reversal signal. This pattern was followed by a breakout marked by a bullish Marubozu candle, further strengthening the bullish outlook.In addition, a bullish crossover appeared on the oscillator, providing additional confirmation of upward momentum. Based on these technical signals, the price is expected to continue its upward move toward the first target at 113,613, with a potential extension to the second target at 117,968.The outlook remains valid as long as the price stays above the key stop-loss level at 105,681.Support the channel by engaging with the content, using the rocket button, and sharing your opinions in the comments below.Disclaimer: "Please note that this analysis is solely for educational purposes and should not be considered a recommendation to take a long or short position on Bitcoin.Rebound on the latest falling wedge structure
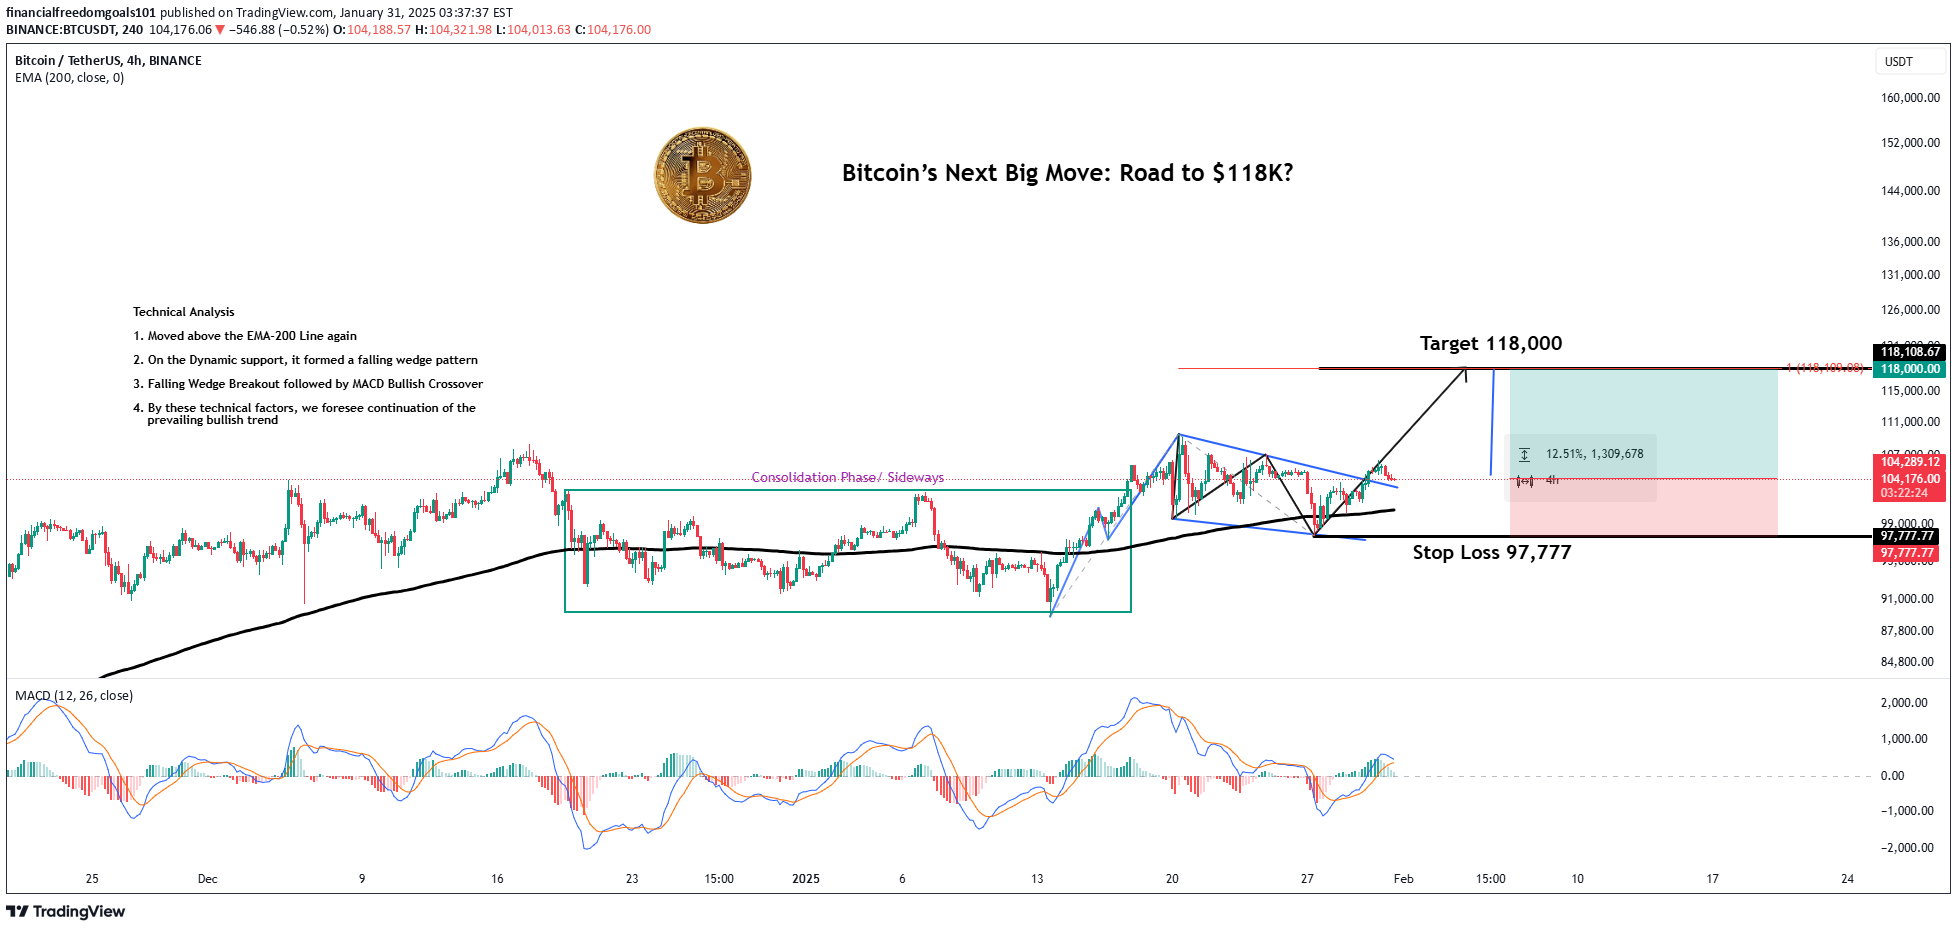
Hey Realistic Traders, Is BTCUSDT Bullish Outlook Over Yet?Let’s dive into the analysis...For nearly a month, BTC/USDT remained in a consolidation phase. However, on January 17, 2025, it successfully broke through resistance, signaling the beginning of a bullish phase.Since then, the price has consistently traded above the EMA 200, reinforcing a strong uptrend.On the H4 timeframe, a Falling Wedge Breakout has been confirmed, accompanied by a bullish MACD crossover, further supporting the likelihood of continued upward momentum.Based on these technical factors, the price is projected to rise toward Target at 118,000, as long as it stays above the critical stop-loss level of Stop Loss 97,777.Support the channel by engaging with the content, using the rocket button, and sharing your opinions in the comments below.Disclaimer: "Please note that this analysis is solely for educational purposes and should not be considered a recommendation to take a long or short position on Bitcoin."
Bitcoin: Breaking Below $80K Soon,10% Correction on the Horizon?
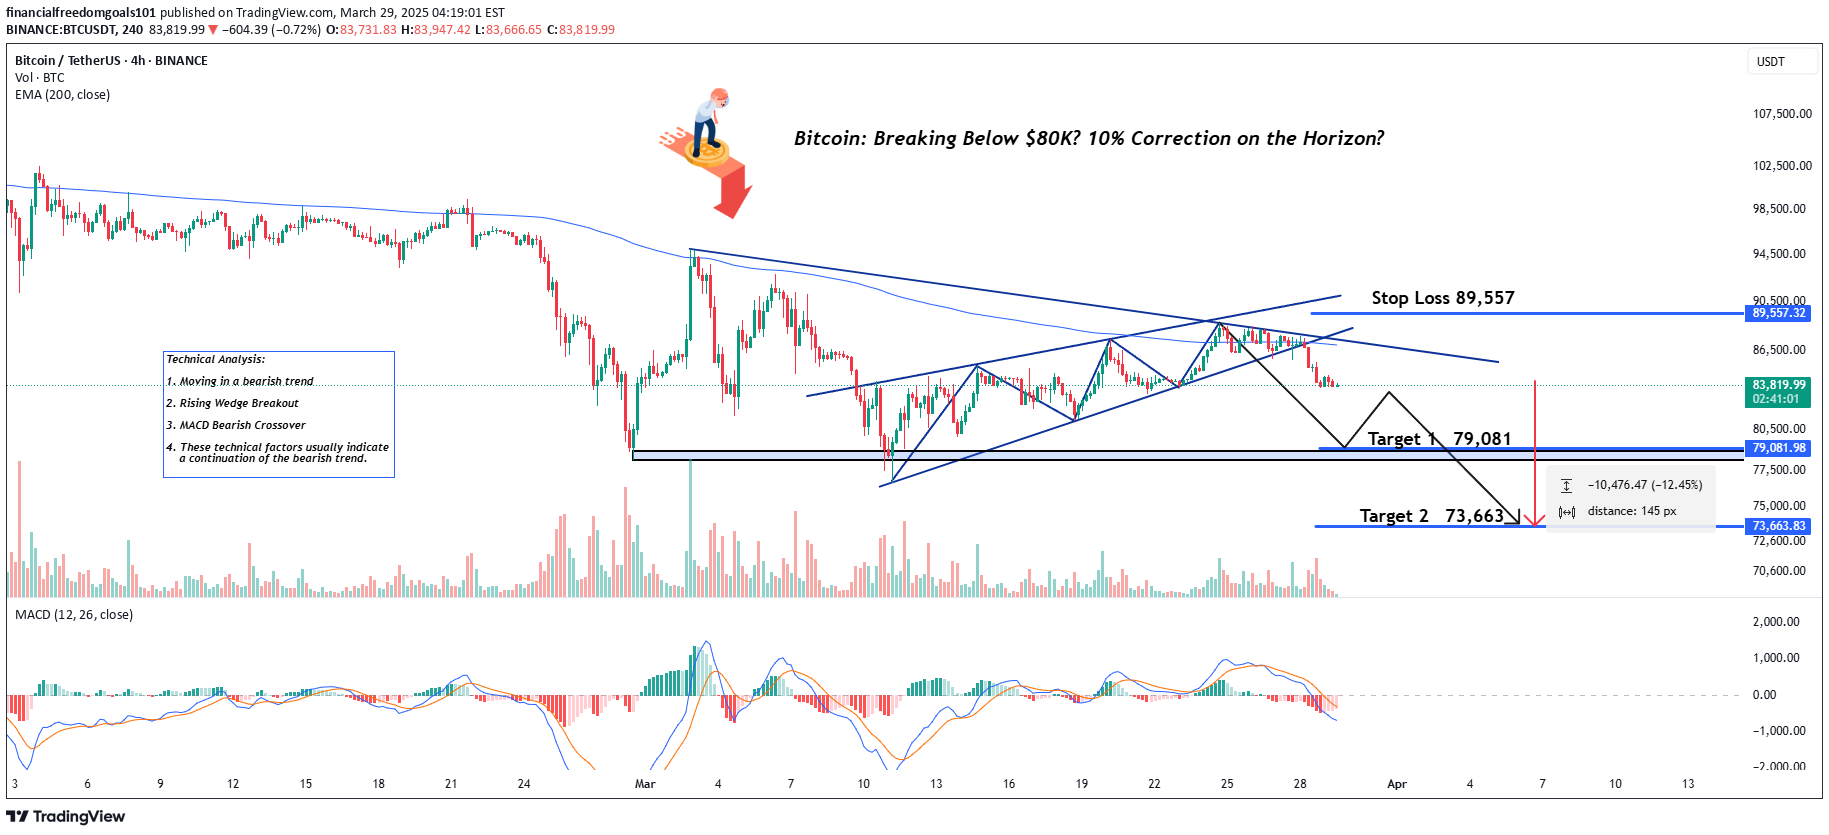
Hey Realistic Traders, Bitcoin is consistently hitting new lower lows. Could this signal that the bear market is here to stay? Let’s dive in.......On the H4 chart, Bitcoin is clearly in a bearish phase. It consistently trades below both the trendline and the EMA 200, reinforcing the downtrend. Additionally, a rising wedge pattern has formed and broken out, and the MACD has shown a bearish crossover. This crossover is a key indicator, signaling that momentum is shifting from buyers to sellers.Together, these signals suggest that Bitcoin may drop toward our first target at 79,081. After reaching this level, a short pullback is expected as traders take profits before the price continues its descent toward a new low at 73,633.This outlook remains valid as long as the price moves below the stop-loss level at 89,557Support the channel by engaging with the content, using the rocket button, and sharing your opinions in the comments below.Disclaimer: "Please note that this analysis is solely for educational purposes and should not be considered a recommendation to take a long or short position on Bitcoin.made another impulsive bearish candlestick, confirming the bearish bias in BTCUSDTbreakout H1 confirmed, we still foresee bearish outlook on BTCExceeded the first target with a nice impulsive candlestick, we foresee a continuation of ongoing bearish trend to the second target.
SOLUSDT Ready to Soar? Wave 5 Points to +30 % Upside Potential
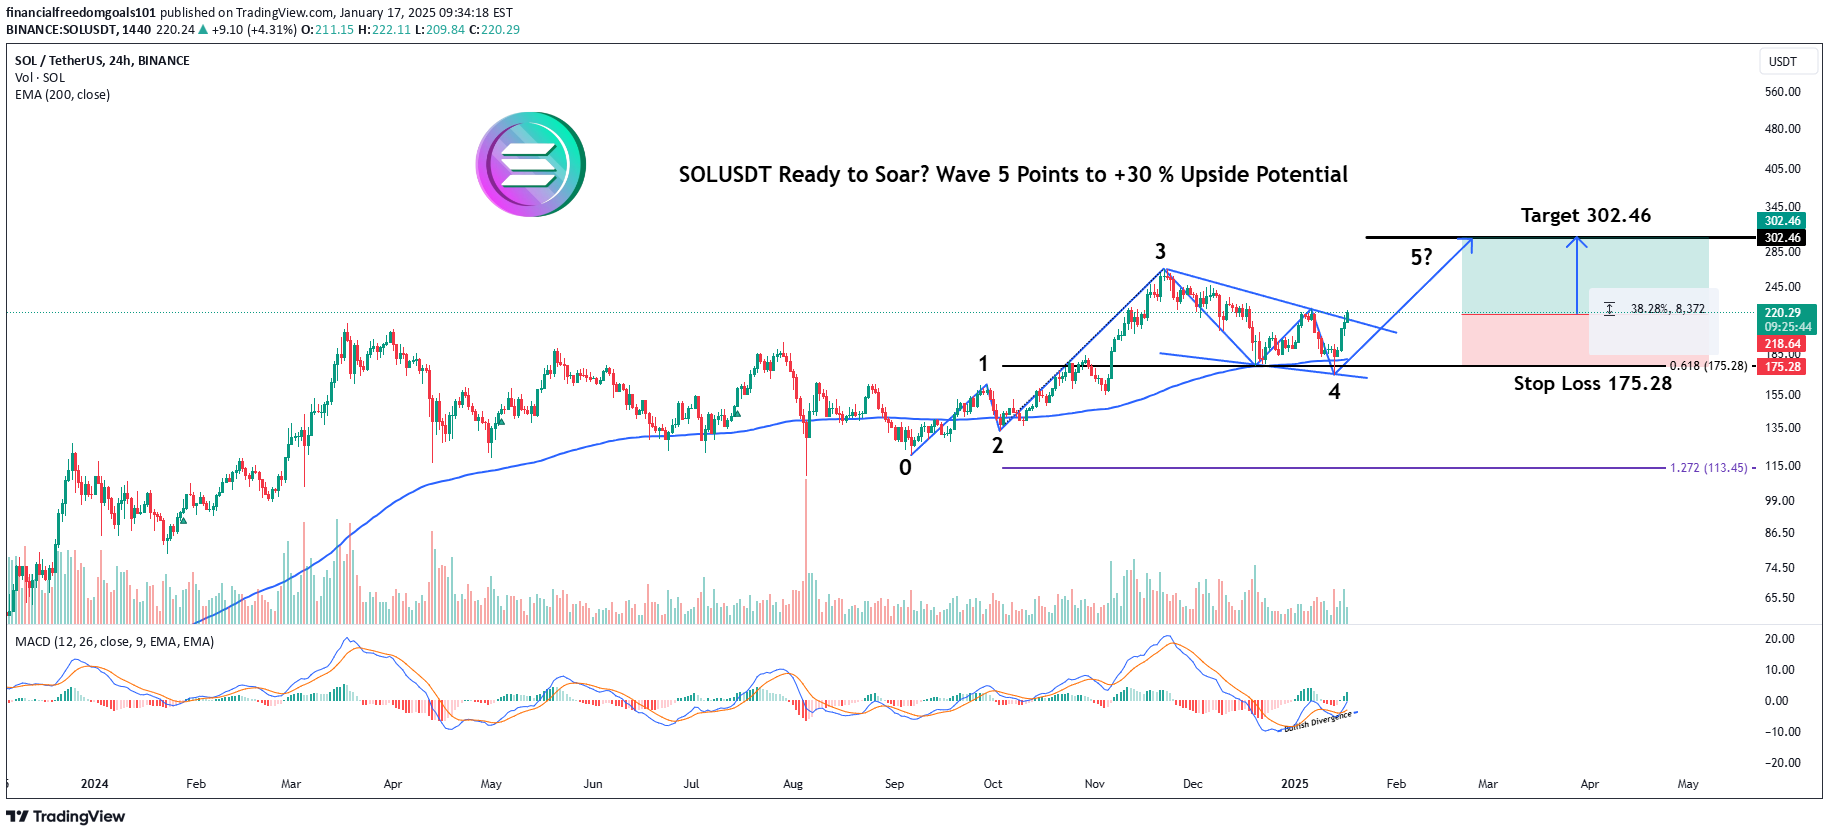
Hey Realistic Traders, Will SOLUSDT Create New All-Time High? Let's dive into the analysis...Analyzing Solana's (SOLUSDT) price movements using Elliott Wave Theory indicates the potential for a significant upside in Wave 5. Wave 3 previously extended beyond the 1.618 Fibonacci extension, classifying it as an extended wave. Following this, Wave 4 retraced approximately to the 0.618 Fibonacci level, forming a falling wedge pattern, which is a bullish signal.The breakout from this falling wedge on the 4-hour chart, combined with a bullish divergence in the MACD indicator, suggests the possible initiation of Wave 5. However, as Wave 5 is expected to be a standard wave rather than an extended one, its movement may be relatively limited compared to the high of Wave 3. Based on these technical signals, the price is projected to rise toward the $302.46 target, provided it holds above the critical stop loss level of $175.28.Support the channel by engaging with the content, using the rocket button, and sharing your opinions in the comments below."Disclaimer: "Please note that this analysis is solely for educational purposes and should not be considered a recommendation to take a long or short position on Solana".The upward movement aligns with our view. The breakout is so impulsive that we foresee it reaching the target.
XAUUSD: Riding the Trade War Wave: Will We See New Highs?

Hey Realistic Traders, Will XAUUSD See New All-Time High Soon? Let's dive into the analysis...Analyzing XAUUSD price movements using Elliott Wave Theory suggests a possible significant upside in Wave 5. Wave 3 previously didn't go beyond the 1.618 Fibonacci extension, classifying it as a normal wave. Wave 4 then retraced to around the 0.618 Fibonacci level, forming a bullish descending broadening wedge pattern.The breakout from this descending broadening wedge on the 1-hour chart, combined with a golden cross in the MACD indicator, indicates the potential start of Wave 5. Since Wave 5 is expected to be extended, its movement might be greater than Wave 3. However, we conservatively expect the extended Wave 5 to reach a maximum of the 0.786 Fibonacci level.Based on these technical indicators, the price is projected to rise towards the target of 2950, and possibly the second target at 2969, as long as it stays above the critical stop loss level of 2900.Support the channel by engaging with the content, using the rocket button, and sharing your opinions in the comments below."Disclaimer: "Please note that this analysis is solely for educational purposes and should not be considered a recommendation to take a long or short position on Gold".Sorry for the recent consecutive losses :(
Disclaimer
Any content and materials included in Sahmeto's website and official communication channels are a compilation of personal opinions and analyses and are not binding. They do not constitute any recommendation for buying, selling, entering or exiting the stock market and cryptocurrency market. Also, all news and analyses included in the website and channels are merely republished information from official and unofficial domestic and foreign sources, and it is obvious that users of the said content are responsible for following up and ensuring the authenticity and accuracy of the materials. Therefore, while disclaiming responsibility, it is declared that the responsibility for any decision-making, action, and potential profit and loss in the capital market and cryptocurrency market lies with the trader.