
fifty2kph
@t_fifty2kph

What symbols does the trader recommend buying?
Purchase History
پیام های تریدر
Filter
fifty2kph
PIVX: رمز ارز حریم خصوصی با پتانسیل انفجار در بازار صعودی!
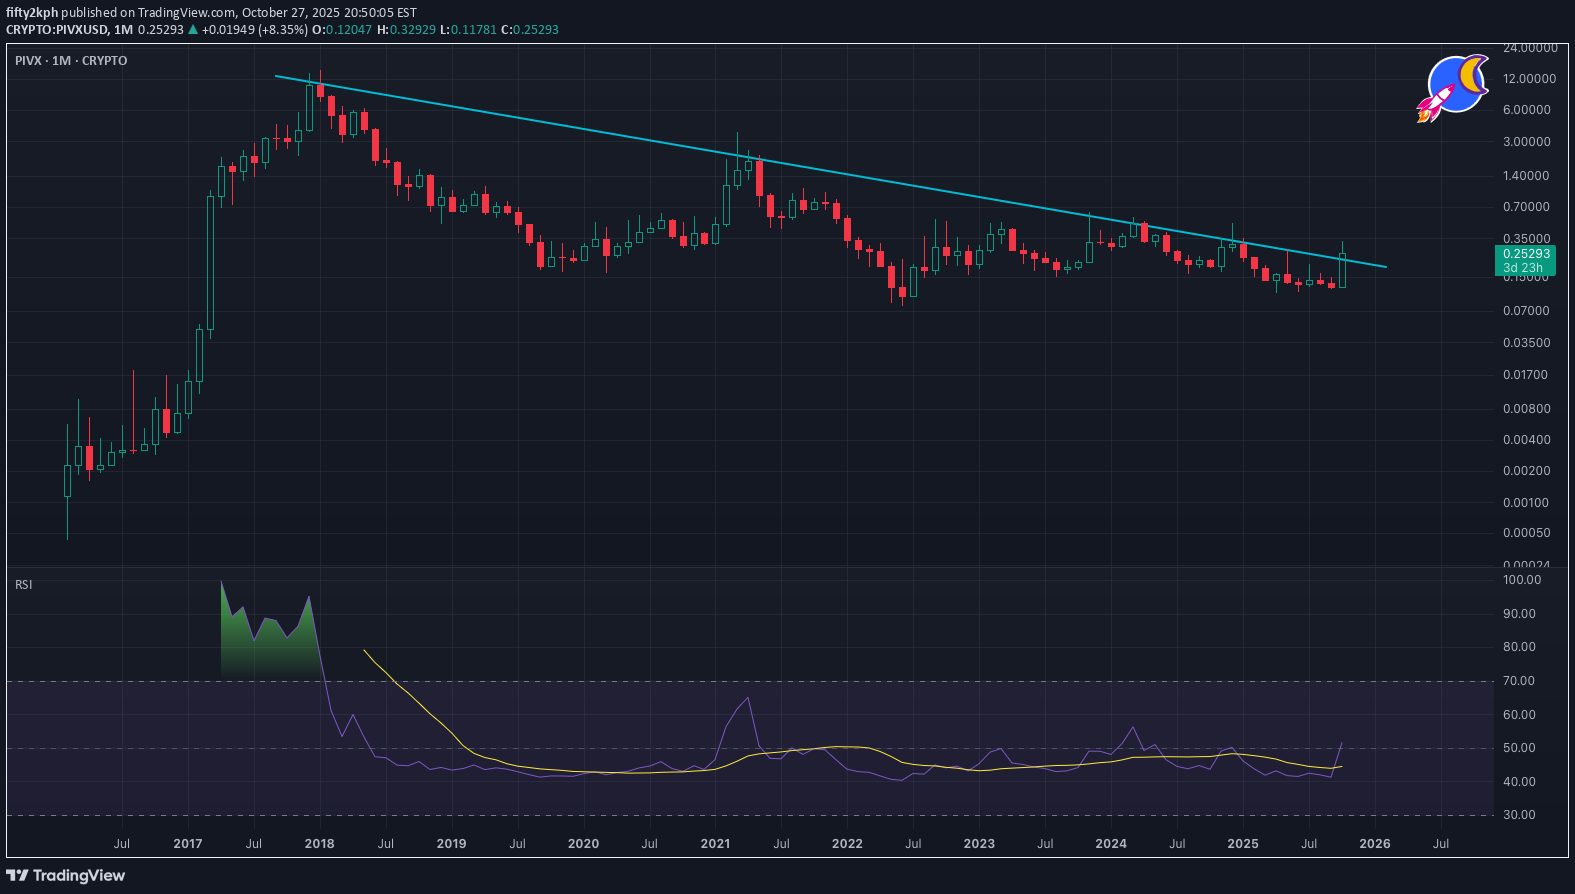
It's been a while...since I've been motivated enough to make a chart. About PIVX 1. Private Proof-of-Stake (PoS) • First to offer anonymous staking: PIVX allows users to stake coins privately, meaning you can earn rewards without revealing your wallet or transaction A history. 2. Zero-Knowledge Proofs (zPIV) • PIVX uses zero-knowledge proofs to mint zPIV coins, which have no transaction history. 3. Community Governance • PIVX employs a community-based governance system, allowing stakeholders to vote on proposals and development directions. 4. Staking Rewards Instead of Mining • Unlike many privacy coins that rely on energy-intensive mining, PIVX uses energy-efficient staking. 5. Optional Privacy • PIVX supports optional privacy, giving users the flexibility to choose between transparent and private transactions C depending on their needs. 6. Positioning for Mainstream Privacy Adoption • PIVX is actively positioning itself for the next wave of privacy adoption, especially in light of regulatory C shifts and growing demand for financial confidentiality. PIVX Technical Analysis (monthly chart) + The RSI has risen above 50 indicating it has bullish momentum. + Price has already broken the 7 year downward trend line, now needs to close above it. That is it! It doesn't need to be complicated. This market cycle hasn't been easy for alts, but now Bitcoin domination is finally falling and the alt market is heating up. Also historically, during the 4th year of the cycle is when things go parabolic, especially in November and December. Thanks for reading. More charts coming soon!
fifty2kph
ETHUSD - Shapes of a Bottom Feat. The CMF & RSI
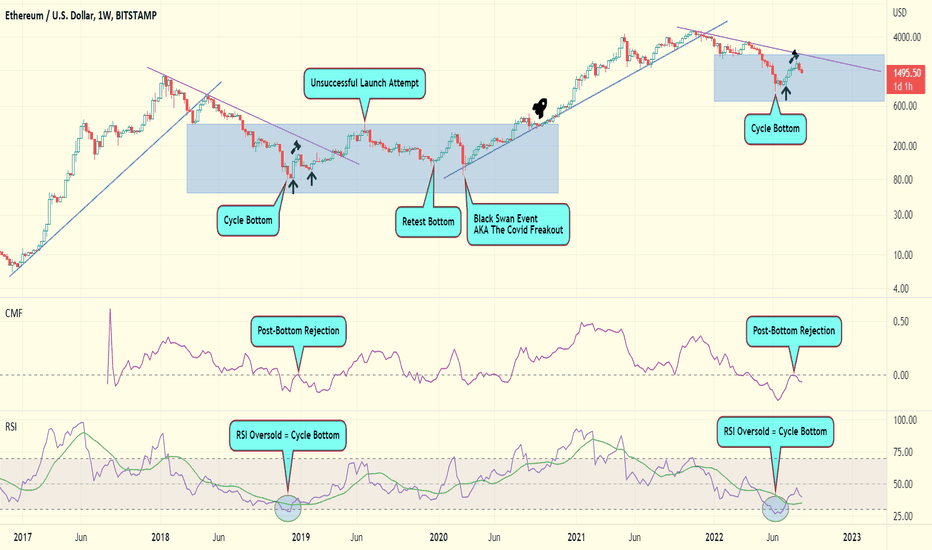
"Ah, freak out! Le freak, c'est Chic Freak out!" I made this chart in an attempt to counteract the various freak-out fests I have seen on Twitter and Telegram these last few months. I am not sure what charts the Freak-Out Crew (FOC) are watching, but they can't be the same ones as I am looking at today. The cycle low is in and the bottom is being made, what's the problem, bois? A good, solid foundation takes months, not weeks to build so what is left to do, other than appreciate the shape and movement of it all? But, oh the macro! Right, the macro narrative is what made me sell everything during the Covid Crash March 2020; never again, my friends...never again. I have learned to trust the weekly and monthly charts. I hope the heavily labelled chart is easy enough to understand, if not shoot me a comment down below and I will do my best to help you understand. Also any counter-arguments are very welcome. Enjoy your day. Cheers.
fifty2kph
BTCUSD - Multi-Cycle Main Trendlines
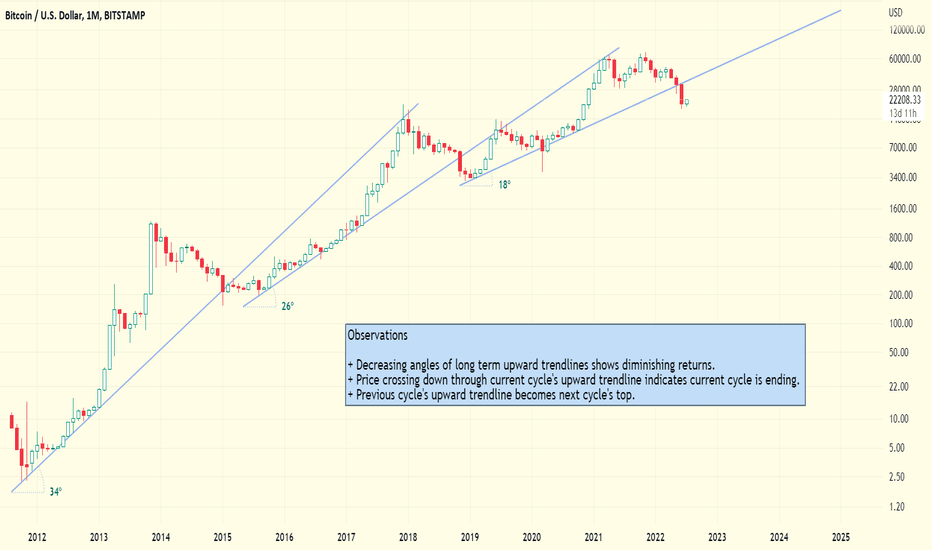
Bottom is top and top is bottom? Observations from the BTCUSD monthly chart + Decreasing angles of long term upward trendlines shows diminishing returns. + Price crossing down through current cycle's upward trendline indicates current cycle is ending. + Previous cycle's upward trendline becomes next cycle's top. What have I missed? Comments down below. Thanks.
fifty2kph
ETHUSD W - Trendline Broken + Rejection = Bear?
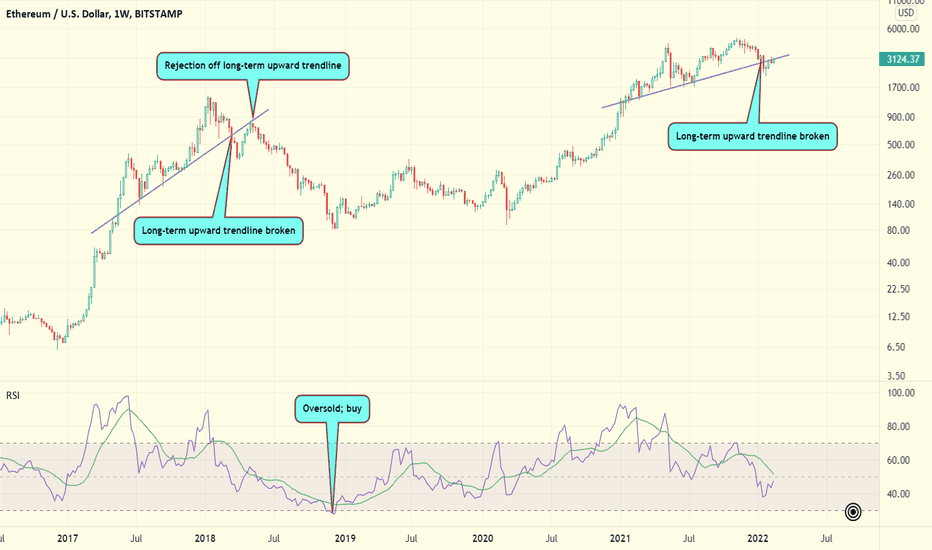
During the 2018 move down, I must have bought into 100 pumps (and then sold 100 dumps).What can we see by (dangerously?) comparing the previous cycle with the current one on the ETHUSD weekly chart?Previous Cycle1. The long term upward trendline got broken2. Price tried to break above it again, but got rejected3. A bear market began that ended with the RSI becoming oversold (my signal to buy for the next cycle)Current Cycle1. The long term upward trendline got broken2. Price is trying to break above it again...3. ?What can you see? Any comments or discussion points, please leave in comments section.Thanks for reading.
fifty2kph
BTCUSD Monthly - Coppock Curve = The Perfect Buying Indicator
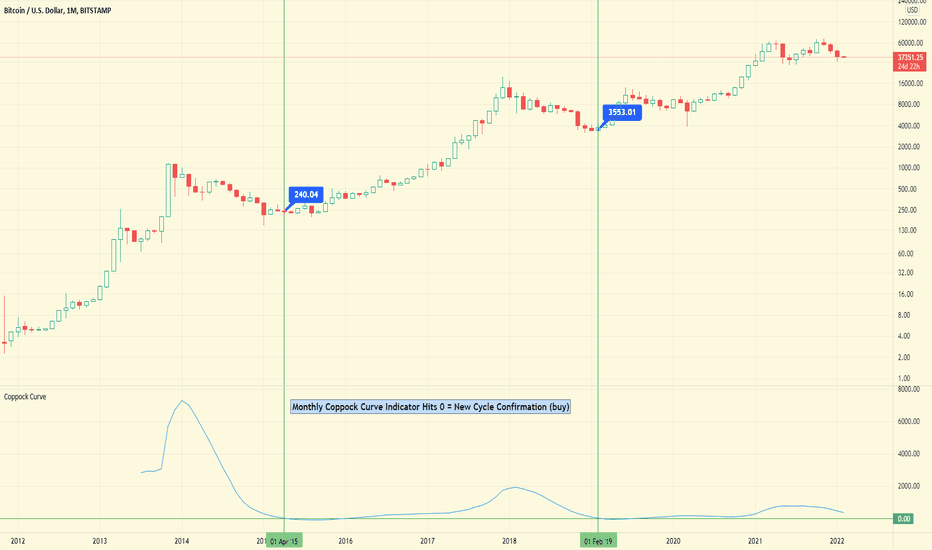
When Will I See You Again? and Patience is a VirgoTL; DR - waiting for the Coppock Curve indicator to hit 0 on the monthly chart has proven to be an excellent move so far for long term buying of BTC.What is the Coppock Curve indicator?+ Coppock, the founder of Trendex Research in San Antonio, Texas, was an economist. He had been asked by the Episcopal Church to identify buying opportunities for long-term investors. He thought market downturns were like bereavements and required a period of mourning. He asked the church bishops how long that normally took for people, their answer was 11 to 14 months and so he used those periods in his calculation.+ The indicator is designed for use on a monthly time scale. It is the sum of a 14-month rate of change and 11-month rate of change , smoothed by a 10-period weighted moving average .+ A buy signal is generated when the indicator is below zero and turns upwards from a trough. No sell signals are generated (that not being its design). The indicator is trend-following, and based on averages, so by its nature it doesn't pick a market bottom, but rather shows when a rally has become established.Here is another idea I published back in Jan 2019 regarding BTC and the Coppock Curve (click to open):Any counter arguments or praise for my ego, please leave in the comments below. Thanks for reading.
fifty2kph
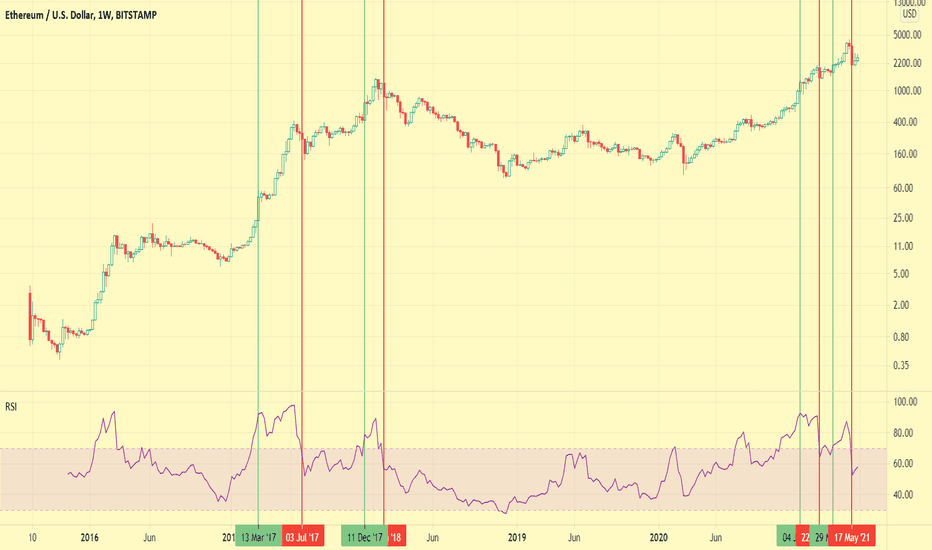
BTCUSD: Consistent Historic New Market Cycle Indications
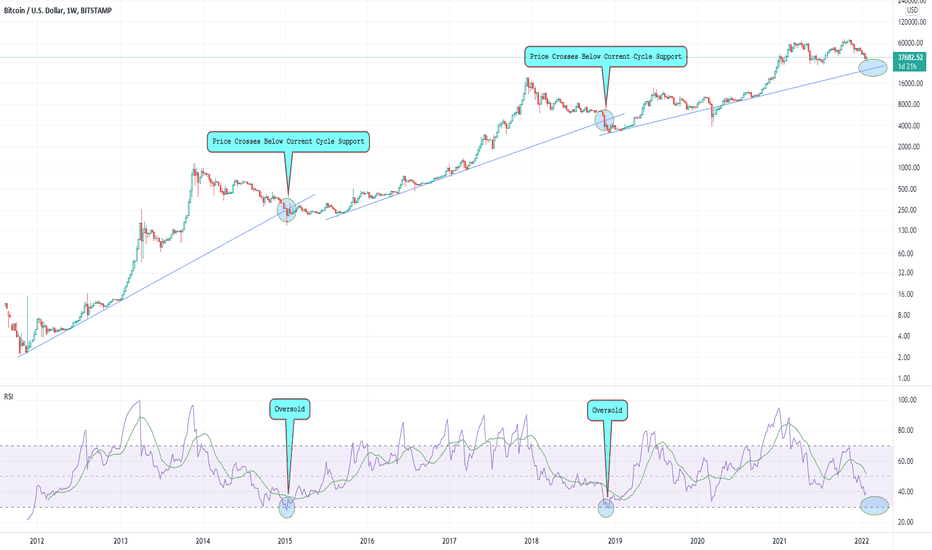
This much I know is true.What is it?This is the BTCUSD weekly chart from the Bitstamp exchange + RSI Indicator.What does it show?The price crossing below current cycle support trendline always coincides with the RSI being oversold (<30). These both indicate a new market cycle has begun. The price has not yet crossed through so a new market cycle has not yet begun.Will price go up or down short term is anyone's guess, but looking at momentum on the weekly and monthly charts, it is definitely down.Comments down below to open discussion and thank you for reading.
fifty2kph
ETHUSD - When to Start Selling? (Monthly 3MA, RSI & MACD)

This is not financial advice blah blah blah and happy new year to all.Observations from the Monthly ETHUSD Chart+ The MACD histogram has been stuttering since the first time ETH hit around $2,500; the main drive was from $70~$2,500 it would seem.+ The MACD 12MA (blue) has already flattened so maybe the tide is turning.+ The RSI-based MA has flattened suggesting upward momentum has slowed down.+ The RSI has been making lower highs and lower lows since around $2,500 suggesting slowing momentum.+ If history is anything to go by, starting to sell when the monthly RSI makes a higher low after the peak seems a good idea.+ The 3MA (applied due to quarterly logic?) seems to also show long term local or whole market cycle tops.Any comments or thoughts, please share below in the comments.Cheers.
fifty2kph
ETHUSD - The Grand Finale? (BBW, RSI & Structure)
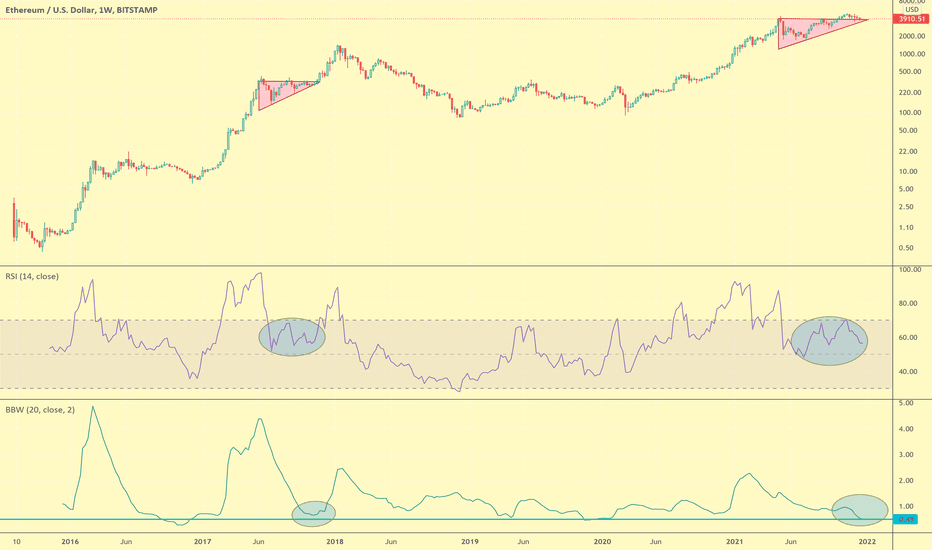
This is not financial advice - just check my past posts to see how accurate they are.Will there be one final and unstable push to the upside that ends in a blow off top and ends this current cycle?My Observations on the ETHUSD Weekly Chart+ The price is currently ranging in a very similar ascending triangle to the one in 2017.+ The general structure of the market and shape of the RSI is also similar.+ The BBW has only been this low at two other times in the last 5 years so we should expect a big movement in the next few weeks.I try not to be bearish or bullish, just note what I see. Any crazy predictions or anything you see in the chart, shoot in the comments down below. Thank you for reading and season's greetings to you all.
fifty2kph
BTCUSD: Bull Market Peaked? THE RSI & MA Say "Maybe, Baby"
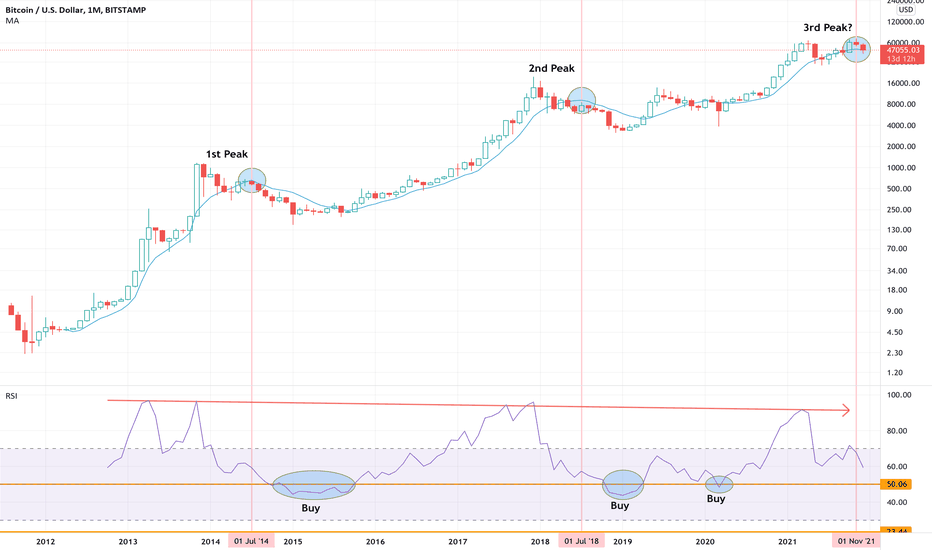
This is not financial advice - just check my past posts to see how accurate they are. I have been greatly confused by this market cycle. I can't be the only one. Such volatility. Are the institutions responsible? China? Because of this feeling, I had kind of given up using TA to predict future price, but that doesn't stop me observing interesting pattern and posting them on here so here we are.My Observations on the BTCUSD Monthly Chart+ When the RSI drops below 50, it is a good time to accumulate+ There is a general downward trend in the peaks of the RSI+ The 9MA peak lags the price peak by 7~8 months+ By the time the 9MA peaks, the RSI already has strong downward momentum+ Once the 9MA peaks and the RSI is below 70, BTC does not recover and heads into a bear market+ The only difference this time is the price is CURRENTLY above the 9MA. Should there be a sudden price surge, the 9MA will straighten or turn up and this whole post will be a complete waste of time. Well no, it was still interesting to make.Let's see what happens. Any crazy predictions or anything you see in the chart, shoot in the comments down below. Thank you for reading and season's greetings to you all.
fifty2kph
When to Start/Stop Selling Cryptocurrencies? Ask the W+M RSI.
I have felt confident that I would know when to buy at the start of a new cycle, but the question of when to sell has always left me feeling clueless...until now. As an example, I am using the ETHUSDT weekly (main chart in this post) and the ETHUSDT monthly chart (see attachment below). I believe this startegy can be applied to most cryptocurrencies; providing they have been around long enough to have a monthly RSI.Prove this sell-off plan wrong:1. Monthly RSI closes >70 + Weekly RSI >70 = start selling 5% - my personal allocation (green horizontal line)2. Weekly RSI closes <70 = stop selling (red horizontal line)I hope you find this useful and I am very inetrested to see what others have to say. Feel free to share your strategies down below in the comments section.Cheers.Selling 5% following the RSI system is too much. Last market cycle there were 30 weeks of selling according to the system, if you had sold 5% each time, you would have ran out before the end: 30*5%=150%; only 52 weeks per year. So IF there are around 30 weeks of selling again this cycle, selling 3.3% each time from the start is appropriate: 30*3.3%=99%. So far for ETH USDT, there have been 22 weeks of selling.
Disclaimer
Any content and materials included in Sahmeto's website and official communication channels are a compilation of personal opinions and analyses and are not binding. They do not constitute any recommendation for buying, selling, entering or exiting the stock market and cryptocurrency market. Also, all news and analyses included in the website and channels are merely republished information from official and unofficial domestic and foreign sources, and it is obvious that users of the said content are responsible for following up and ensuring the authenticity and accuracy of the materials. Therefore, while disclaiming responsibility, it is declared that the responsibility for any decision-making, action, and potential profit and loss in the capital market and cryptocurrency market lies with the trader.