
ferulianov
@t_ferulianov

What symbols does the trader recommend buying?
Purchase History
پیام های تریدر
Filter
ferulianov
ONDOUSDT 1D - Descending channel
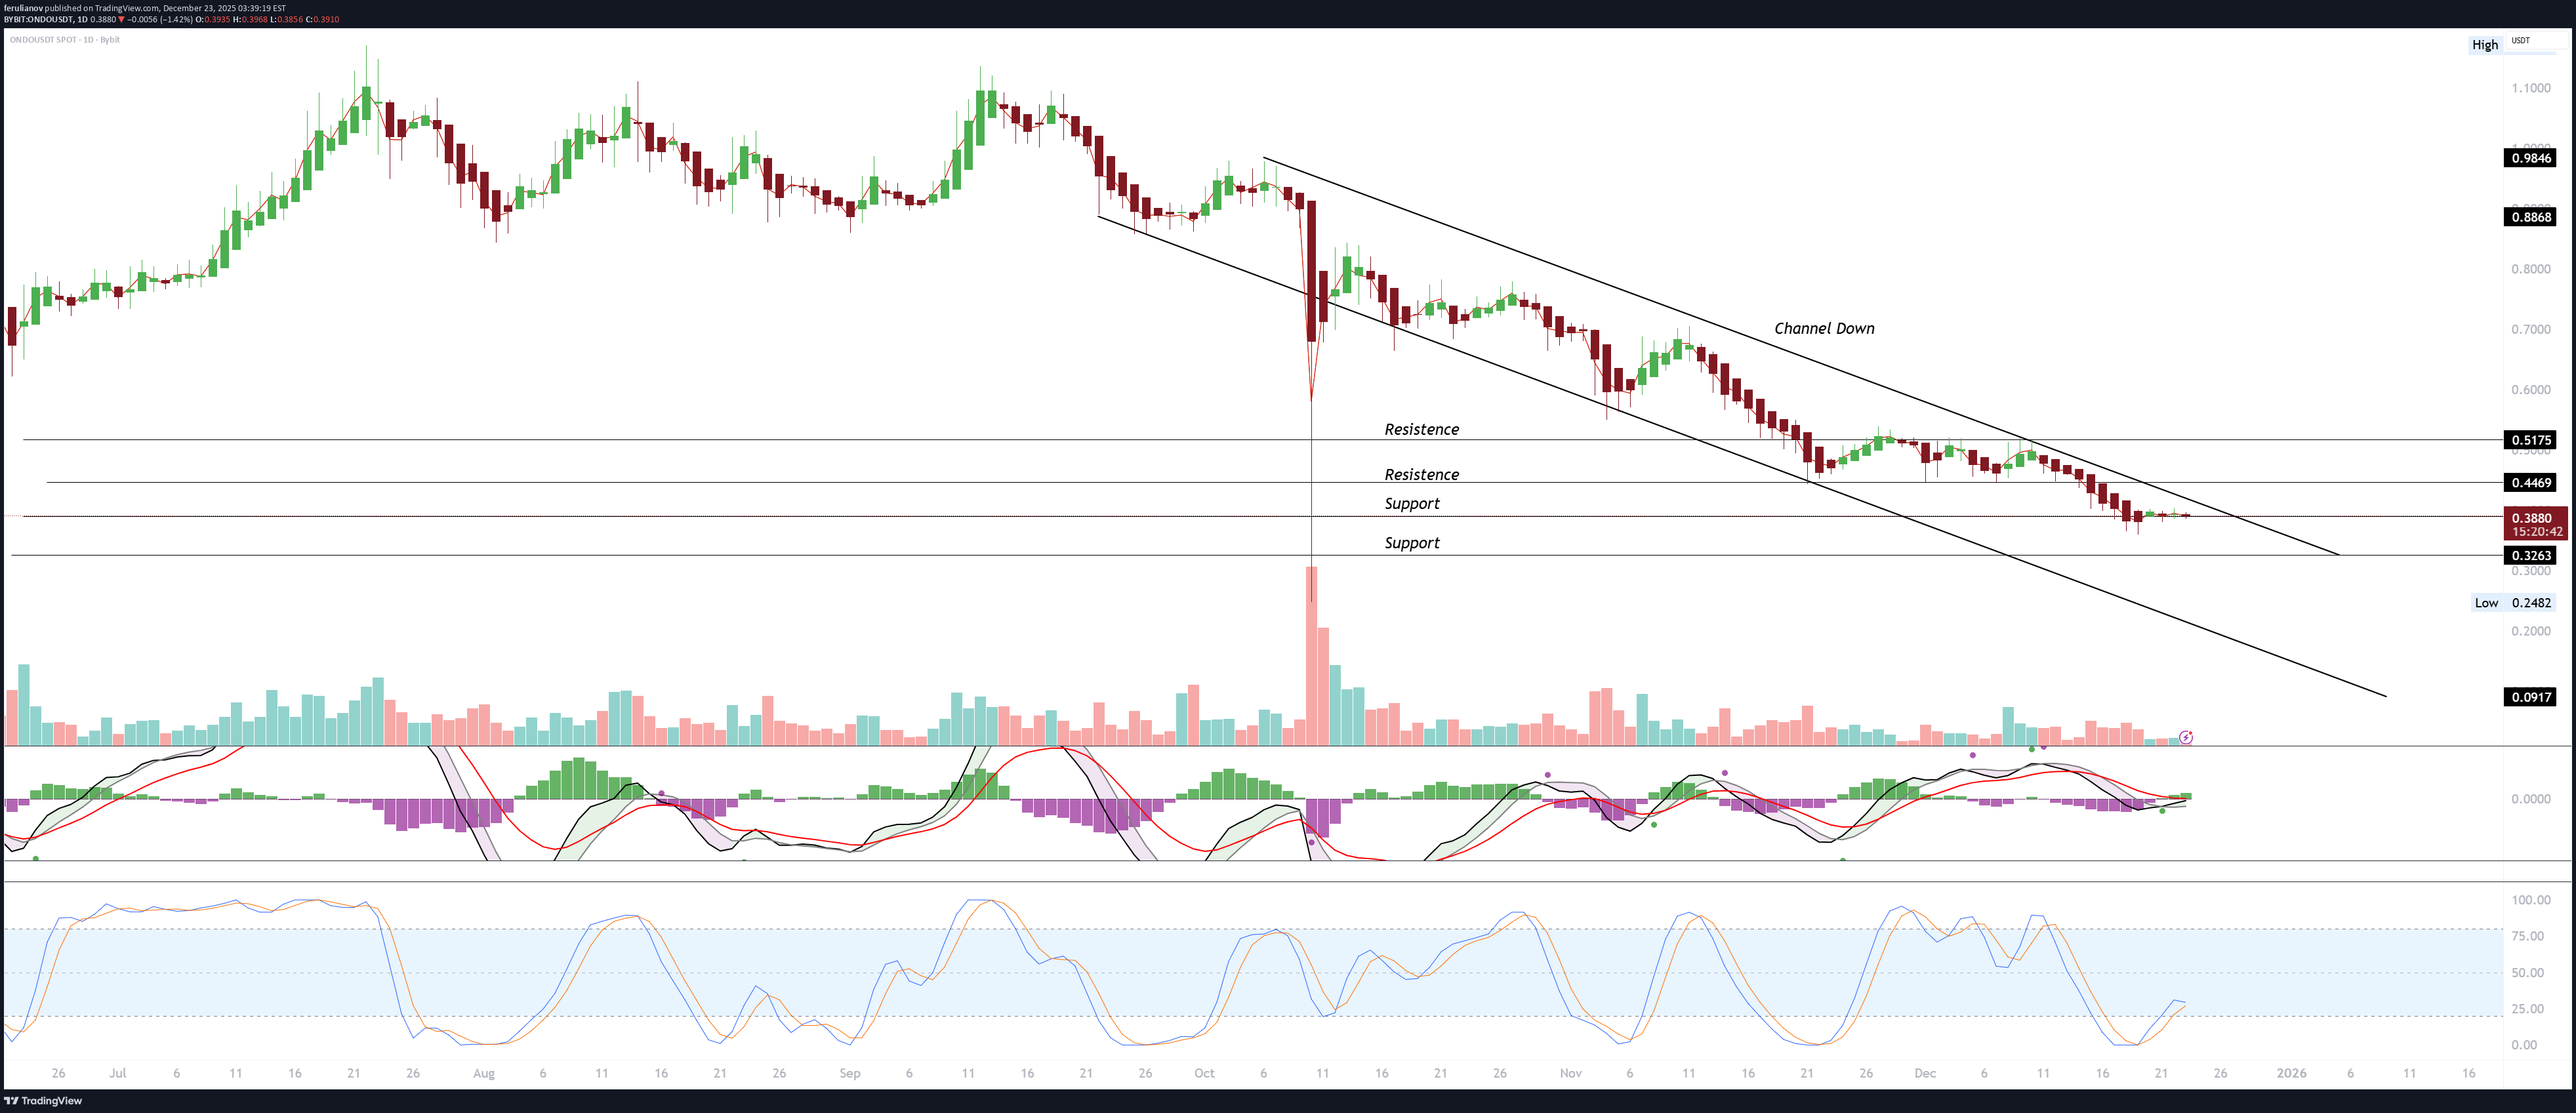
ONDO is trending downwards within a descending channel on the daily chart. The price remains below the resistances of 0.4469 and 0.5175. The MACD shows the beginning of a bullish divergence, and the Stoch RSI is exiting the oversold zone, indicating a possible pullback to the upper downtrend line of the channel. The reversal will only be confirmed if the price breaks out of the channel, closes above 0.4469, and subsequently surpasses 0.5175, which would create a new ascending high and invalidate the bearish structure. Otherwise, rejections in the aforementioned regions could lead the price back to the supports of 0.3880, 0.3263, and 0.2482. Twitter: negotiate with Renato Ulianov ( @twrulianov ) / YouTube: youtu.be/6J5odIOekzw Instagram: instagram.com/trade_with_renato_/ Tiktok: tiktok.com/@renato_ulianov?_r=1
ferulianov
QUBICUSDT 4H
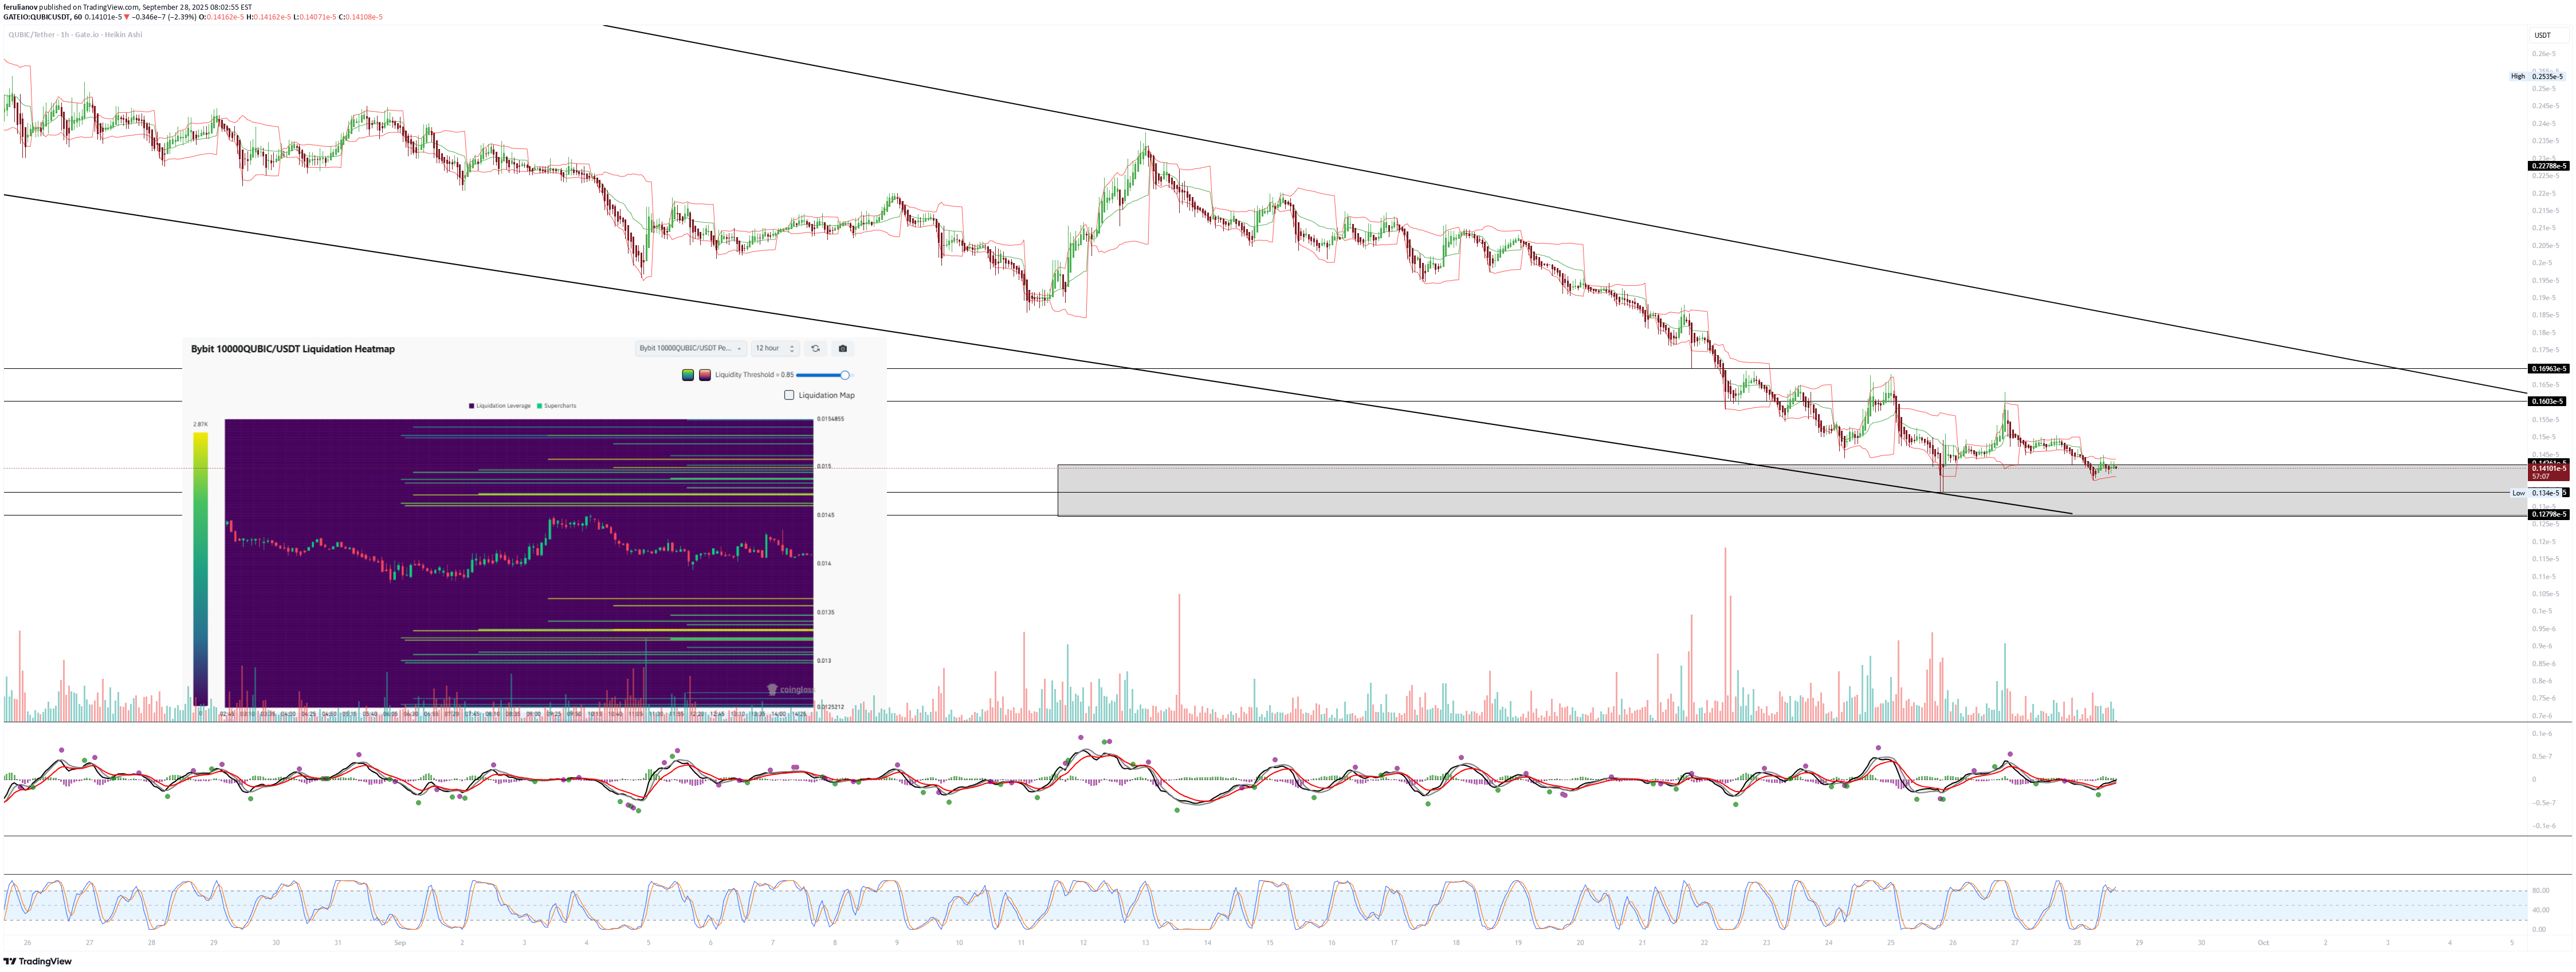
QUBIC is technically falling within a wedge, but it's already nearing a significant bottom. This could generate a reaction, is a strong AI narrative, and is heading toward real adoption. The chart shows a falling wedge, with QUBIC falling within this pattern. This pattern could indicate the end of the decline and the possibility of a reversal, but it still clearly requires notification of buying volume. The MACD is attempting to cross upwards, indicating a possible start to a recovery in the short term, and the stochastic is in the oversold region, favoring a pullback. In other words, all indicators favor a pullback, awaiting confirmation from volume. No heatmap shows a strong concentration of liquidity from long positions below $0.0000013 and short positions at $0.00000160 – 0.00000169. Major Supports $0.000001340 $0.000001279 Major Resistances $0.00000160 $0.00000169 QUBIC positions itself in the AI + blockchain narrative, which is highly hyped in bull cycles. The difference lies in its attempt to combine ultra-fast smart contracts with the execution of AI algorithms on a decentralized network. In tokenomics, the supply is relatively high, but with controlled issuance. A large portion of the tokens are still used for network rewards, which could generate selling pressure in the short term. The value of the token depends heavily on the actual adoption of smart contracts and the use of the network for AI.
ferulianov

Technical AnalysisCurrent Price: $2,804.39Supports:$2,735.55 –$2,635.90 –Resistances:$2,921.99 –$3,034.50 –ETH is trying to sustain itself above the short-term averages, but without a clear bullish bias in the short term. The price is consolidating within the mid-bands, suggesting a possible accumulation before a breakout.ETH is in a consolidation phase, and it is crucial to observe breaks of the $2,921.99 levels to validate a more significant rise. If it loses $2,735.55, it may retest the $2,635.90 region.Fundamental Analysis🔸 Ethereum Inflation: The supply of ETH has increased again, making the asset inflationary after the Dencun update.The introduction of blob transactions, designed for large data loads, has reduced the proportion of fee burns.The Pectra upgrade (March 2025) could further increase inflation by increasing the gas limit, potentially impacting the supply and demand balance.If fee burns remain low and supply remains inflationary, selling pressure could increase, limiting price growth. Monitoring the impact of Pectra will be essential to assess the effects on ETH supply and price.While technically ETH is seeking consolidation, fundamentally rising inflation could impact its performance. Stay tuned for market movements and changes in fee burn policy! 🚀
ferulianov

ONDO is positioned within a symmetrical triangle, with upper resistance at 1.77972 and ascending support near 1.32120.If it breaks the triangle resistance, there is room to seek 2.14, the last significant top.🔸 Key support levels 1.446 / 1.32🔸 Key resistance levels: 1.64871 / 1.77972.🔸RSI: It is overbought, indicating a possible pullback before breaking resistance.🔸MACD: Buyer, close to an index, which may signal buying strength at the breakout.The uptrend is still valid if it remains above 1.44675, if it breaks 1.53369 it may lead to an accelerated rise, but it needs volume.
ferulianov

Technical Analysis of the PENDLE Token (USDT) - 1H (BINANCE)PENDLE has recently experienced a strong drop, reaching support near $3.39.In the short term, there are signs of recovery, with the price consolidating between $3.72 and $4.08.The short-term averages, EMA 9 and 21, show upward directions, signaling a bullish view level.The long-term average is still descending, indicating that the market has not fully reversed to the upside.The histogram, on the other hand, shows a loss of bearish momentum, with the lines attempting a bullish index.If this movement continues, it will be possible to reinforce a recovery scenario.🔹Support: $3.39 / $3.72🔹Resistance: $4.08 / $4.33Should the price break $4.08 on volume, there is a chance of a push towards $4.33 and then $5.59.Pendle continues to explore new asset types for yield tokenization and integrate with high-impact DeFi protocols. Some future trends include:Expanding to more blockchain networks to increase liquidity and adoption.Partnering with institutional platforms, making yield tokenization a more accessible product.Enhancing governance, allowing PENDLE holders to play an even bigger role in the future of the protocol.📈 Pendle is becoming one of the leading yield management protocols in DeFi, paving the way for a more efficient and accessible market
ferulianov

BTCUSDT is in an uptrend at the moment, with important support and resistance levels defined. Indicator readings point to a bullish momentumBTCUSDT1H🔸 Key Support Levels : 95286.00 / 94539.00🔸 Key Resistance Levels : 96993.00 / 98221.00🔸RSI : Buyer🔸MACD : Buyer🔸Ulianov trends: The Ulianov Trends indicator also confirms a buyer bias, which reinforces the bullish outlook.
ferulianov

AAVE/USDT in the chart above shows a bearish trend movement in the short term, with bearish candles and the presence of indicators pointing to weakness.However, AAVE has significant traction and good trading volume, with potential for quick reversals in the market.Once the market reverses the trend in the short term, there is a strong probability of reaching the projected target due to the combination of volatility and liquidity as AAVE responds well to strong upward movements, especially during times of capital re-entry into the altcoin market.Support: 268.68 / 264.88Resistance: 280.22 / 284.94RSI: Selling forces exhaustedMACD: Buyer
ferulianov

The 279.01 level is acting as strong support, while 273.29 could also be relevant, providing an additional floor if the price continues to decline.Immediate resistance lies at 292.67, which was recently tested, with possible stronger resistance around 306.42 and 300.80, where the price could face increased selling pressure.The Stochastic RSI is pointing to a possible trend reversal, suggesting that there is good upside potential if the price sustains above the support and breaks the mentioned resistance.Based on the movement pattern and the moving average crossover setup, it is possible that AAVE could reach the 337.00 target by tomorrow evening or at the latest by Monday.This is a favorable scenario for purchase operations, but it is important to always maintain risk control and use stop-loss if the market does not behave as expected.
ferulianov

Analyzing the PENDLE USDT 12H chart, it has shown high volatility, with sharp variations in the Bollinger bands, which indicates a possible continuation of the recovery movement.Currently, the price is moving between the levels of $3,919 (support) and $7,250 (resistance), with a strengthening trend. This suggests that if the support at $3,919 is maintained and the price continues to approach the upper bands, we may see a new attempt to test the resistance at $7,250, which would open the doors to a possible much more significant appreciation, with $55 being a plausible target in the medium-term scenario. Support: $3,919Resistance: $7,250The RSI and Stochastic indicate that the asset is in an overbought zone but is not completely stretched, which means that there may be more room for appreciation, although caution should be exercised regarding possible short-term corrections.If PENDLE continues to be supported by these support levels, a breakout of the resistance and progress towards the $55 price becomes a possibility, especially considering the market recovery and the fundamentals that could drive the coin.Liquidity is increasing, and the volume is trending positively, which favors continued appreciation, as long as investors remain confident in the metrics and market sentiment.In summary, the analysis suggests that if the uptrend continues, PENDLE has the potential to reach $55 in the near future.
ferulianov
SOLUSDT 1H - Ascending Channel Under Selling Pressure

The chart shows a sideways movement with an upward slope, within an ascending channel visible on the 1-hour timeframe. At the moment, the price is close to the dynamic support of the channel, but the indicators show selling pressure. The EMA (Exponential Moving Average) suggests dynamic resistance, with the price finding it difficult to consistently break above it. Support: $229.69 $225.00: Considered a critical support, its loss could signal a broader reversal in the short term. Resistance: $241.72 $247.00: Upper resistance on the 1H chart, coinciding with the recent top. A break of this level could propel the price towards $256.69. RSI (Relative Strength Index): Indicates selling pressure. MACD: Also presents a bearish crossover, reinforcing the sell scenario at the moment. Although the price of SOL/USDT is inside an ascending channel, the selling pressure indicated by the indicators (RSI and MACD) suggests that the price may test the supports before resuming the uptrend.
Disclaimer
Any content and materials included in Sahmeto's website and official communication channels are a compilation of personal opinions and analyses and are not binding. They do not constitute any recommendation for buying, selling, entering or exiting the stock market and cryptocurrency market. Also, all news and analyses included in the website and channels are merely republished information from official and unofficial domestic and foreign sources, and it is obvious that users of the said content are responsible for following up and ensuring the authenticity and accuracy of the materials. Therefore, while disclaiming responsibility, it is declared that the responsibility for any decision-making, action, and potential profit and loss in the capital market and cryptocurrency market lies with the trader.