
fereydoon1199
@t_fereydoon1199

What symbols does the trader recommend buying?
Purchase History
پیام های تریدر
Filter
fereydoon1199
Gold Spot / U.S.Dollar . 1 H
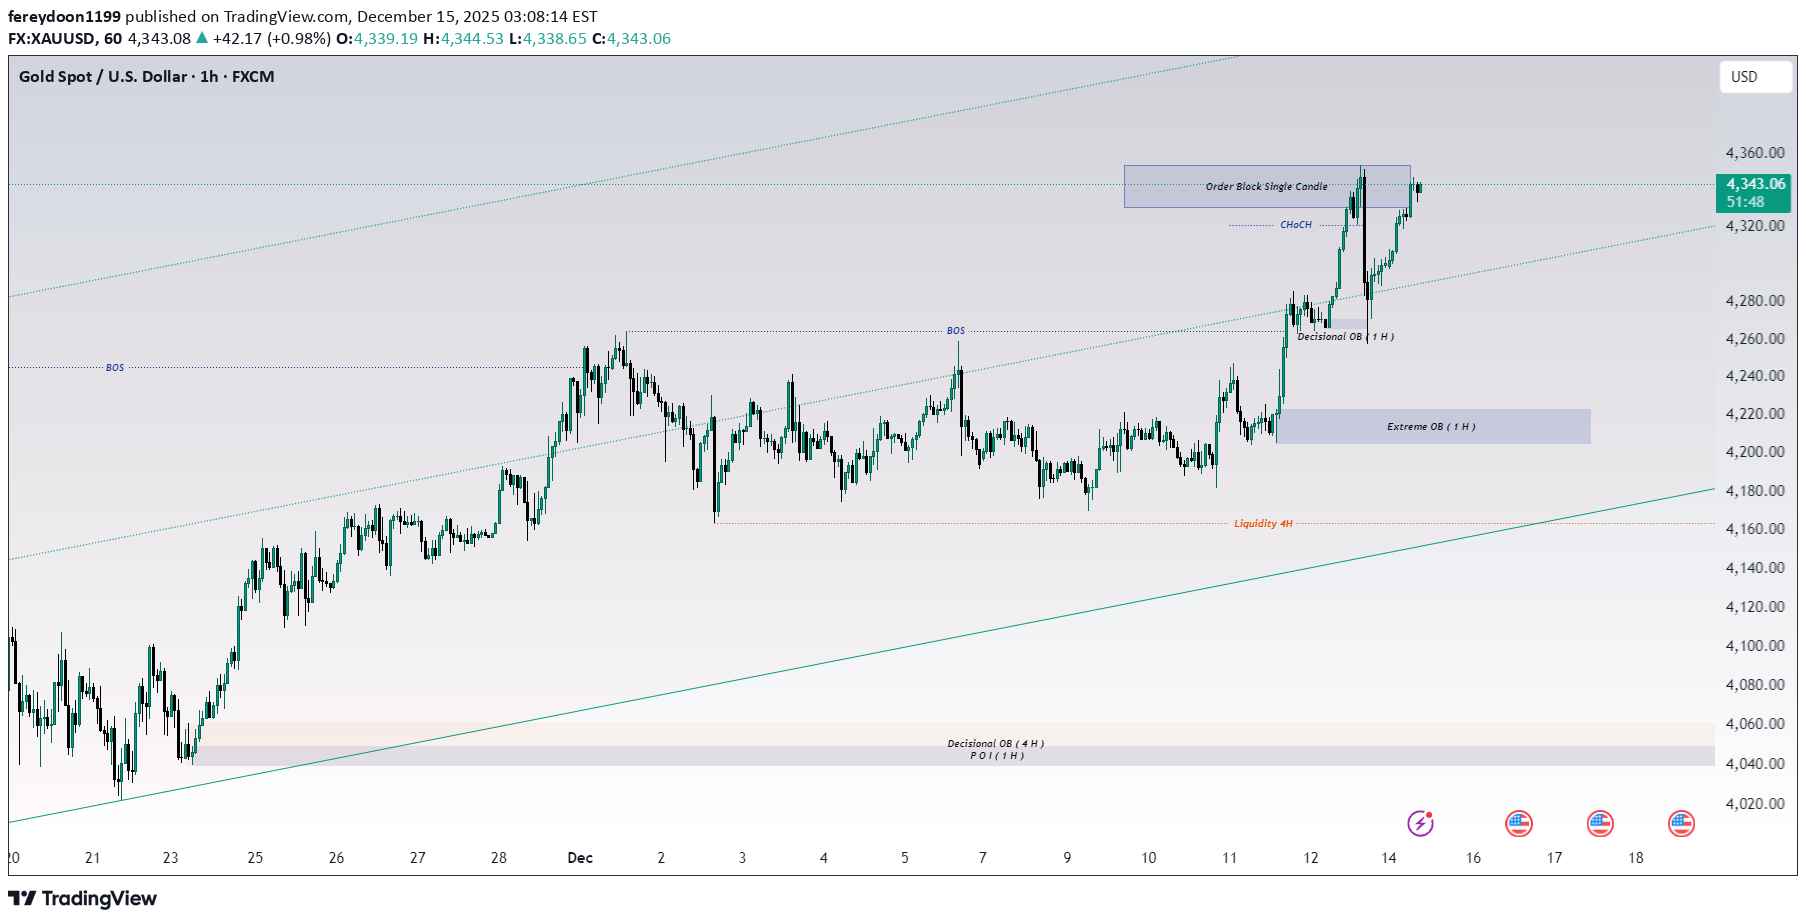
Bonjour and greetings to my dear followers, This is a brief analysis to catch the momentum on a 1-hour time frame, so please don’t overlook the shorter-term view. The 1-hour chart is the Gold Spot chart (XAUUSD), which clearly shows buying opportunities. Based on the DXY, this analysis is updated. Chart review: Monthly target based on the DXY’s downward step: the gold target is 4756.51 dollars, and the 1-hour buying area is 4223.26. A buy is appropriate with confirmations. The 4-hour liquidity is 4163.46, and the decision zone is 4061.18. At the moment I have received very strong sell confirmations, so this week should present excellent selling opportunities up to these levels, with confidence. The weekly buying zone is 3378.77 dollars, where the likelihood of price reaching these levels is very high. These price points have been observed for gold in the past several times; we will reassess the chart. After price reaches the 1-hour, 4-hour, and daily zones and receives a sign of renewed upward confirmation, we will proceed. When the price reaches these levels, we will enter buying positions upon receiving appropriate confirmations. Position updates: I regularly update both buy and sell positions on the 4-hour and daily time frames and will republish this analysis. Risk disclosure: This analysis is for informational purposes only and should not be considered financial or investment advice. Trading in financial markets carries risks and may result in the loss of your capital. Therefore, please conduct the necessary research and enter trades with full awareness before taking action. Thank you! Wishing everyone success! Fereydoon Bahrami “A retail trader in the Wall Street trading center (Forex).”The technical decline target was correct, but we had not taken into account Netanyahu's behavior. The channel drawn was unique!
fereydoon1199
تحلیل هیجانانگیز اتریوم (ETHUSDT): زمان خرید طلایی فرا رسید؟
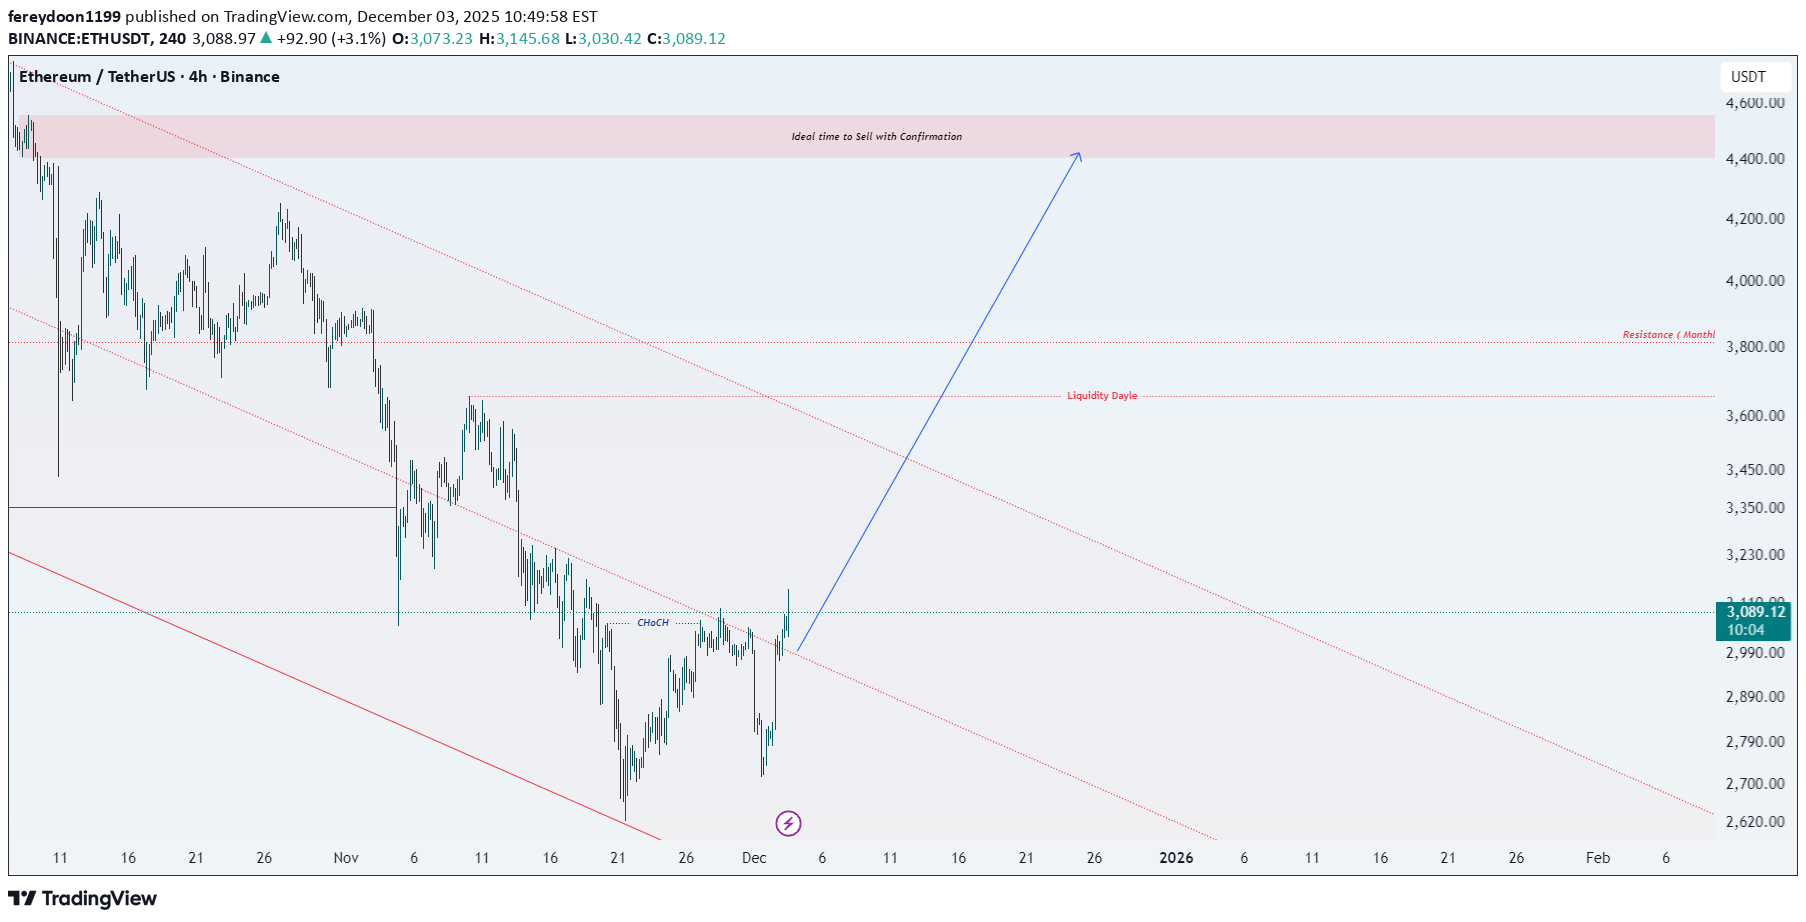
Ethereum Market Analysis Introduction Hello dear traders! In this analysis, I have updated the status of the famous Ethereum chart. In the previous analysis, for Ethereum on a long-term basis, we identified the CHoCH (Change of Character) trend change with precision and specified the best selling zone. { Ideal selling time with confirmation will be announced in the future and a great time. }. According to the plan, there is currently a nice buying swing; this analysis is now for the 4-hour timeframe and shows us small upward steps. My analysis is very simple and straightforward, and there is no need for further explanation. I wish you success and enjoy the analysis. Wishing you all success! Fereydoon Bahrami A retail trader in the Wal Street Trading Center (Forex) Risk Disclosure (Risk Disclosure): In the cryptocurrency market, trading is risky due to high price volatility. This analysis is solely my personal opinion and should not be considered financial advice. Please do your own research. You are responsible for any profits or losses resulting from this analysis.
fereydoon1199
تحلیل بیت کوین: فرصت فروش کمین کرده و مسیر حرکت بعدی قیمت!
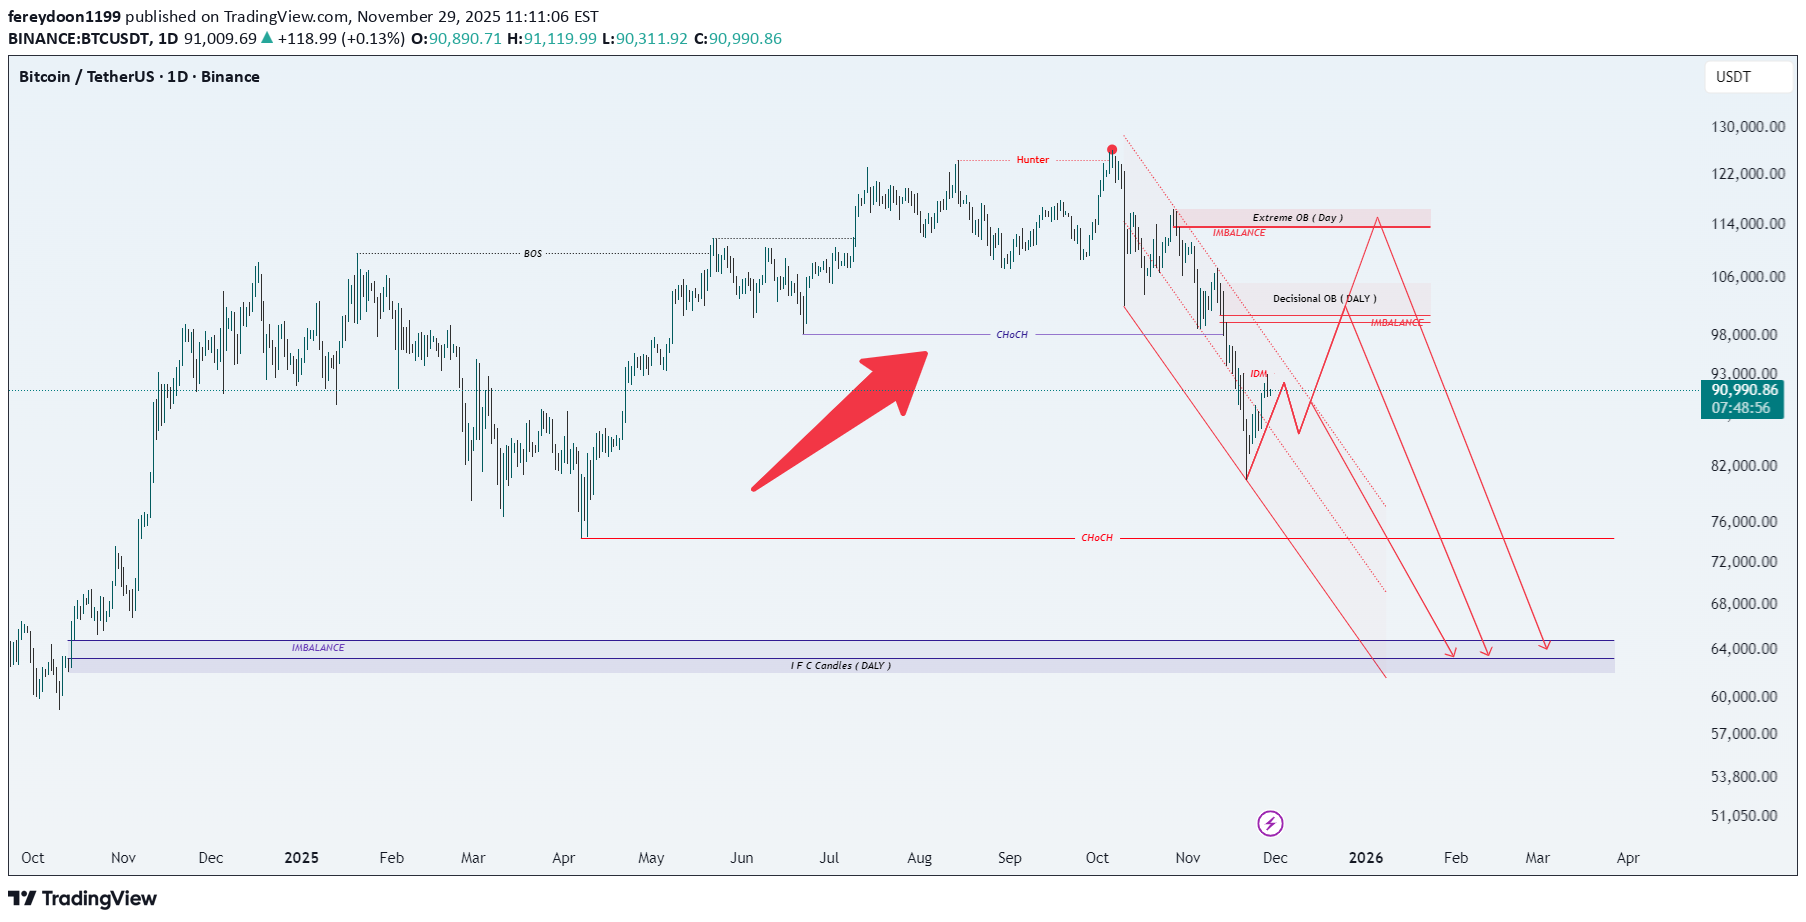
Hello friends, this is only a daily-timeframe analysis that has been decided based on reviewing the 4-hour timeframe. Please pay attention. Bitcoin has formed two major blocks in its downtrend, and there is a possibility of returning to those blocks. However, the major correction has been definitively confirmed, and I am only looking for a suitable short-position opportunity so that I can enter another unique long position in the future. In my daily analysis, there are two suitable blocks for selling; clear signs of a decline must be observed, after which you should enter the position. The analysis is very clear and does not require further explanation. Thank you for your support, dear friends! Wishing you all the success! Fereydoon Bahrami A retail trader in the Wall Street trading Center (Forex) Risk Disclosure: Trading in the crypto market is risky due to high price changes. This analysis is just one person's opinion and shouldn't be taken as financial advice. Before investing, it's best to talk to a financial advisor and do your own research. You are responsible for any profits or losses from this analysis
fereydoon1199
Ethereum Market Analysis
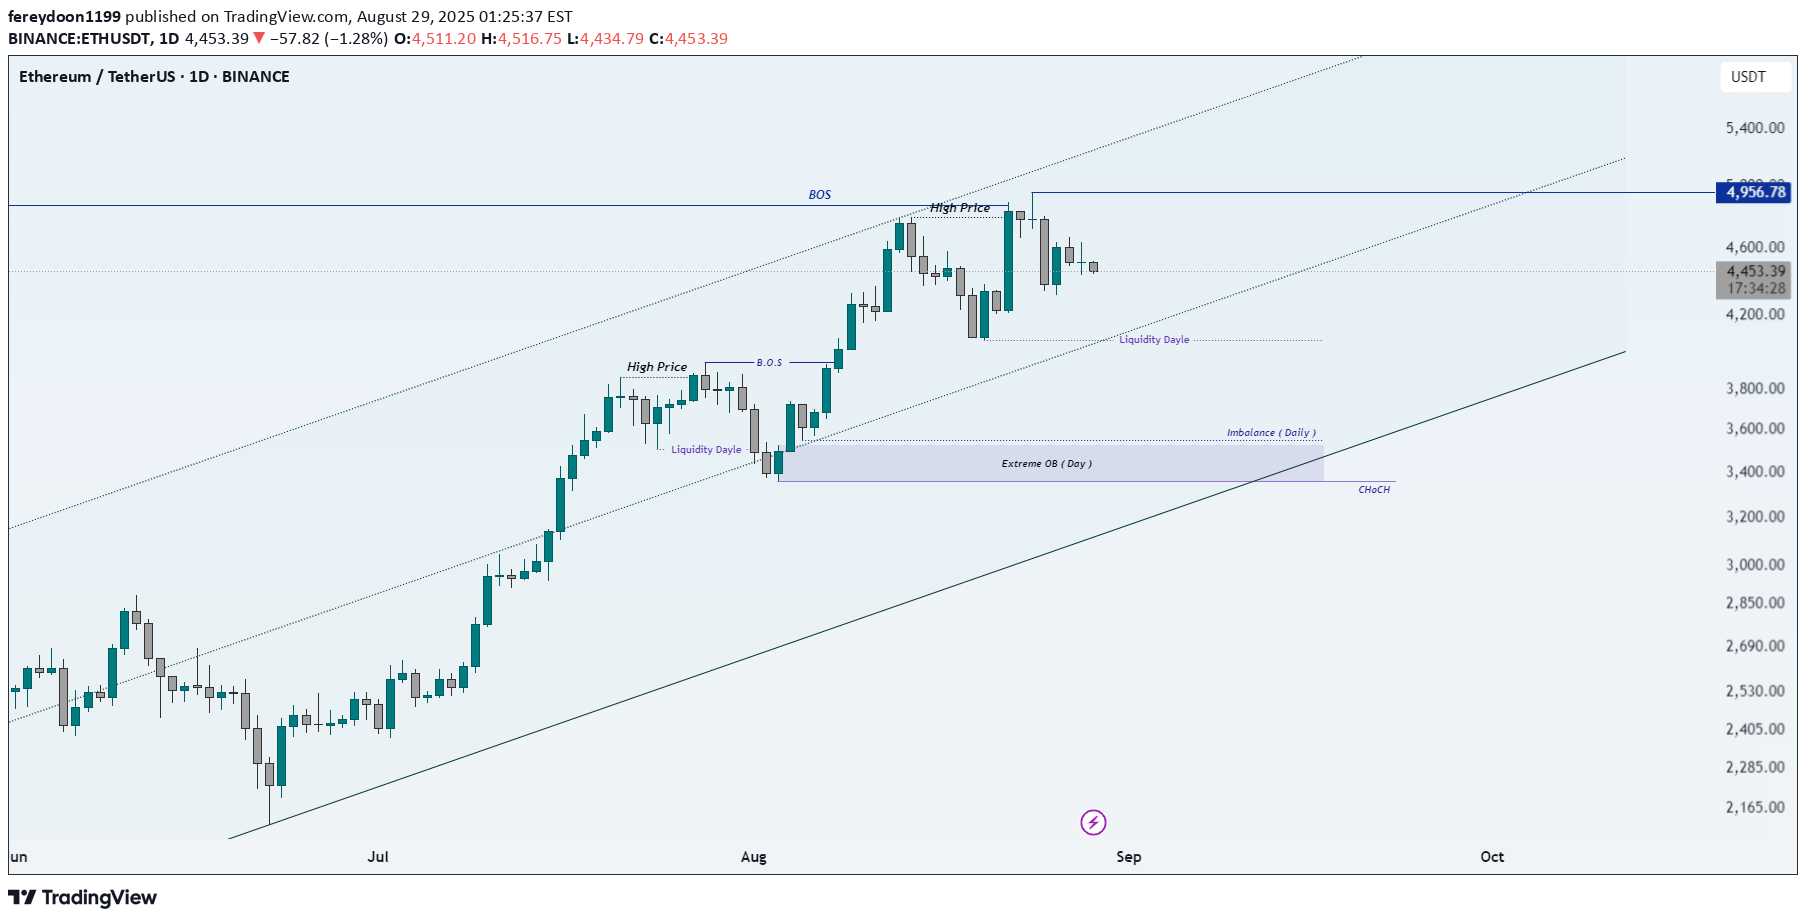
Ethereum Market Analysis Introduction Hello dear traders! In this analysis, I have updated the status of the popular Ethereum chart In the previous analysis, for Ethereum on a long-term basis, we identified the CHoCH (Change of Character) trend change with precision and specified the best buy zone. { Ideal time to buy with Confirmation }. According to our forecast, after the price enters the buy zone, the market moved up to the main target, which was the old high. Now this is a daily analysis and it shows us the small upward steps. My analysis is very simple and straightforward, and there is no need for further explanation. If the CHoCH trend changes in the daily analysis, I will present a new analysis to you. Wishing you success and enjoy. Wishing you all success! Fereydoon Bahrami A retail trader in the Wall Street Trading Center (Forex) Risk Disclosure: Trading in the cryptocurrency market is risky due to high price volatility. This analysis is solely my personal opinion and should not be considered financial advice. Please do your own research. You are responsible for any profits or losses resulting from this analysis.Hello, the Ethereum sell analysis ended with the price reaching the extreme zone and now we are looking for a logical buy. I expect confirmation. Thank you for your support.
fereydoon1199
Gold Spot / U.S. Dollar

Here is a quick analysis from the 15-minute time frame. Therefore, we kindly ask you to ensure that you receive the necessary confirmations before entering a position. We have identified a potential selling zone by examining multiple confirmations of a bearish trend in this time frame. This information will be updated in the future when we assess higher time frames. Key Areas: FVG: 2994.680 and 2996.410 CHoCH: 2977.996 H.H: 3005.040 Thank you for your support. A very simple and clear chart has been drawn for your use. Wishing you all success! Fereydoon Bahrami A retail trader in the Wall Street Trading Center (Forex) Risk Disclosure: Trading in the Forex market is risky due to high price volatility. This analysis is solely my personal opinion and should not be considered financial advice. Please do your own research. You are responsible for any profits or losses resulting from this analysis.
fereydoon1199
Bitcoin / TetherUS

Hello dear traders, Here’s the latest update on the Bitcoin chart along with potential reversal points and zones. If there are any changes this week, I will update the chart again and present it to you. Market Status Currently, we are in a daily descending channel, and the low point is below our expectations. Key Points for Analysis Exit Points for Trades or Short Positions (4-Hour): Resistance: 86,897.25 Daily Liquidity: 102,500.01 Ideal Time to Sell with Confirmation: 105,250 These resistance points provide us with the best selling opportunities, but it's essential to pay attention to the necessary confirmations. A candlestick pattern is one of the best confirmations to consider. Order Flow (4-Hour): 71,632.95 and 66,835 This temporary buying zone can offer a good profit opportunity during this downturn and is suitable for short-term buying. Daily Support: 69,388.62 If we receive confirmation, this level will serve as a strong support. This analysis has been drawn up simply and clearly for your convenience, dear followers. Wishing you all success! Fereydoon Bahrami A retail trader in the Wall Street Trading Center (Forex) Risk Disclosure: Trading in the cryptocurrency market is risky due to high price volatility. This analysis is solely my personal opinion and should not be considered financial advice. Please do your own research. You are responsible for any profits or losses resulting from this analysis.
fereydoon1199
Bitcoin / TetherUS

Hello and greetings to dear companions! This is an updated analysis of Bitcoin. Based on the discussions we've had and the previous analysis we conducted for the entire crypto market, we have observed that Bitcoin has reached the bottom of its daily channel after a severe decline! Now, we expect Bitcoin to reach the $105,000 range, similar to our previous analysis, and then either retrace or rise, which we can support with confirmation. Our previous scenario remains intact, and our target range is still valid, as we have excellent daily liquidity. In terms of price analysis, $102,500 is the level that convinces buyers that Bitcoin is bullish, leading them to enter buy positions. Sellers, upon seeing this decline, are looking to exit, and we will likely see market consolidation around this level until we determine the winner of this confrontation. I will elaborate on the analysis. Our current scenario is primarily based on ideal selling conditions. In the specified range, we will exit the market and wait for the market to make its decision. Based on this analysis, if our trend line breaks, we will swiftly take action to sell, as this serves as a very strong confirmation of the fake rally, and we will likely see further declines! We are preparing to observe the market reaction at the price of $73,000 with confirmation and act to capture an excellent swing. Key Points Resistance (Daily): 102500 Support (Daily): 69388 Ideal Time to Sell with Confirmation: 105250 & 109588 Wishing you all success! Fereydoon Bahrami A retail trader in the Wall Street Trading Center (Forex) Risk Disclosure: Trading in the cryptocurrency market is risky due to high price volatility. This analysis is solely my personal opinion and should not be considered financial advice. Please do your own research. You are responsible for any profits or losses resulting from this analysis.
fereydoon1199
Ethereum / TetherUS

Ethereum Market Analysis Introduction Hello dear traders! In this analysis, I have updated the status of the popular Ethereum chart. In the previous analysis, I mentioned the presence of a structural change (CHoCH) in the weekly timeframe. Technical Analysis Currently, Ethereum is in the process of correcting to gather liquidity in the specified areas on the chart. It seems that a new upward trend has formed, and we can profit from this movement with short-term buying and proper risk management. Price Targets First Target: I expect the price to reach the Extreme OB (Day) level at 3555.18. Second Target: After reaching this level, we may witness a price decline again while hunting for the Liquidity Dayle at the rate of 3525.72. Possible Path With the continuation of this trend, there is a possibility that the price may not reach the Secret Order Block (Day) level at 1985.78. If this scenario does not materialize, I will update the chart again and specify the ideal entry areas for you. Wishing you all success! Fereydoon Bahrami A retail trader in the Wall Street Trading Center (Forex) Risk Disclosure: Trading in the cryptocurrency market is risky due to high price volatility. This analysis is solely my personal opinion and should not be considered financial advice. Please do your own research. You are responsible for any profits or losses resulting from this analysis.New analysis will be uploaded soon.
fereydoon1199
Bitcoin / TetherUS

Bitcoin Chart Analysis in the 4-Hour Time Frame 1. Market Overview Currently, based on the analysis of weekly and monthly time frames, the Bitcoin market is in an upward trend, and we are waiting for a market correction. The drawn channel currently shows a soft price decline. Therefore, I have identified suitable sell positions: Resistance Line: 102724.38 IFC Daily Candle: 103278.54 2. Technical Analysis of the 4-Hour Time Frame In the 4-hour time frame, we have observed a Change of Character (CHoCH), indicating a temporary correction in the price trend. Our expectation is that after the correction ends, the price will reach the level of 86561.35 dollars. I will update the price chart again in the future. Thank you for your support, dear friends! Wishing you all the success! Fereydoon Bahrami A retail trader in the Wall Street trading Center (Forex) Risk Disclosure: Trading in the crypto market is risky due to high price changes. This analysis is just one person's opinion and shouldn't be taken as financial advice. Before investing, it's best to talk to a financial advisor and do your own research. You are responsible for any profits or losses from this analysis
fereydoon1199
Litecoin / TetherUS

Hello dear traders, I hope you have taken full advantage of the incredible opportunities in the market! This is an analysis of the cryptocurrency Litecoin that you see here. Litecoin is a currency with a strong background and exceptional profitability, and I see incredible opportunities specifically for this currency. In the weekly chart, we had a bullish CHoCH, which is why we are looking for ideal buying opportunities, and we will enter temporary selling positions with technical confirmation at important levels, aiming for logical targets. According to the TOTAL crypto analysis, we observed that cryptocurrencies are seeking correction, and Litecoin is no exception. This currency has shown us a downward channel for trading, which I have drawn. Of course, this channel needs to be regularly updated, and the buy and sell targets in the chart should also be clearly defined. This is a long-term analysis aimed at achieving maximum profit from the market. I have analyzed the chart in a simple and clear manner for you and identified the buying and selling zones so that you can easily trade with this information and receive technical confirmation. Ideal time to Sell with Confirmation: 122.48 Secret Order Block (Day): 66.79 Liquidity M: 61.92 Thank you for your support, dear friends! Wishing you all the success! Fereydoon Bahrami A retail trader in the Wall Street trading Center (Forex) Risk Disclosure: Trading in the crypto market is risky due to high price changes. This analysis is just one person's opinion and shouldn't be taken as financial advice. Before investing, it's best to talk to a financial advisor and do your own research. You are responsible for any profits or losses from this analysis
Disclaimer
Any content and materials included in Sahmeto's website and official communication channels are a compilation of personal opinions and analyses and are not binding. They do not constitute any recommendation for buying, selling, entering or exiting the stock market and cryptocurrency market. Also, all news and analyses included in the website and channels are merely republished information from official and unofficial domestic and foreign sources, and it is obvious that users of the said content are responsible for following up and ensuring the authenticity and accuracy of the materials. Therefore, while disclaiming responsibility, it is declared that the responsibility for any decision-making, action, and potential profit and loss in the capital market and cryptocurrency market lies with the trader.