felixfenix
@t_felixfenix
What symbols does the trader recommend buying?
Purchase History
پیام های تریدر
Filter
Signal Type
felixfenix

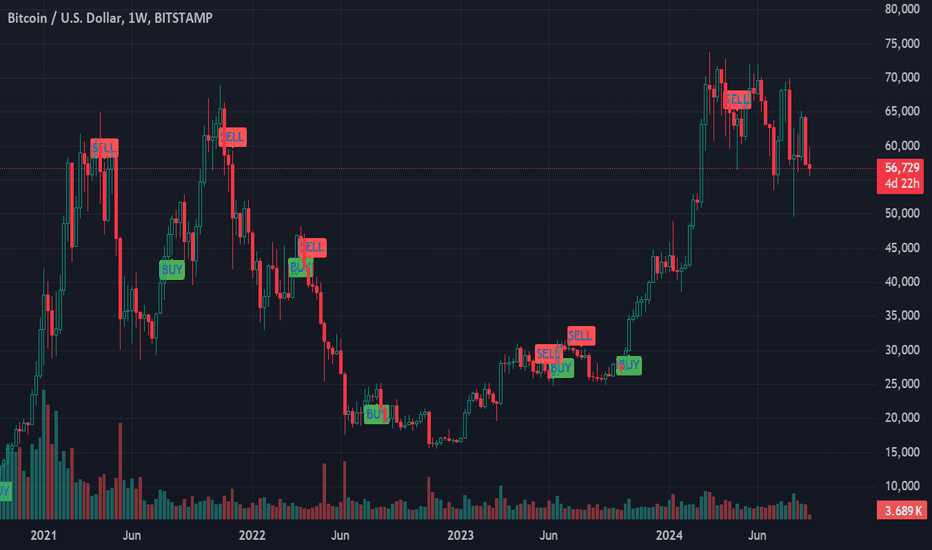
Weekly Price Action Analysis: Bitcoin’s Downward TrajectoryThe weekly price action has confirmed that Bitcoin is currently in a downward trajectory. After failing to hold above the key psychological level of $60,000 for over six months, it appears that Bitcoin has entered a phase of price discovery to explore lower support levels.In the chart provided, a combination of several moving averages, alongside stochastic indicators such as the MACD, RSI, and Stochastic Oscillator, highlights the points of trend reversals, where key buy and sell signals have been triggered. As seen, the recent failure to regain strength above $60,000 is further supported by multiple sell signals, suggesting increased downward momentum.These indicators suggest that the bearish sentiment is still strong, with further consolidation or potential downward price movement ahead.
felixfenix

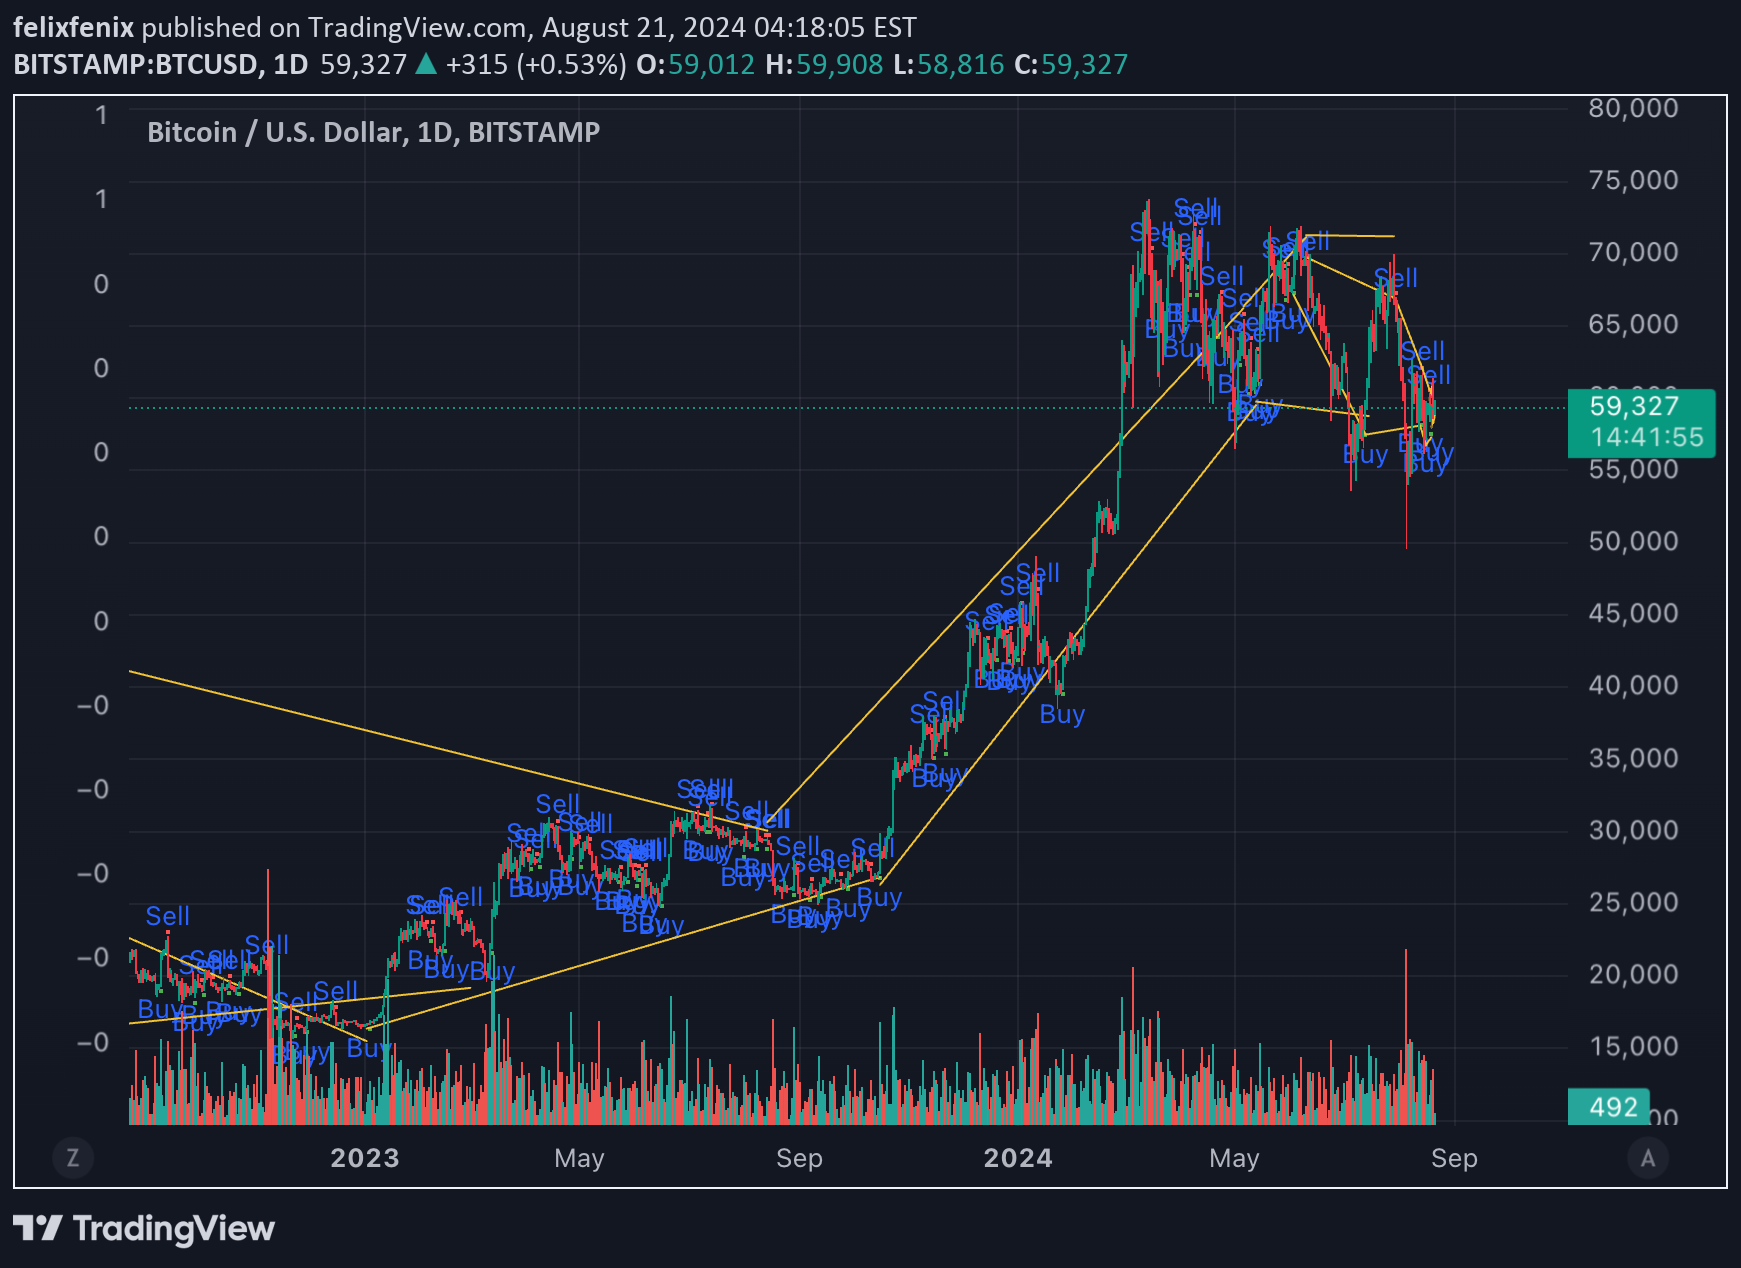
In a rare and whimsical turn of events, Bitcoin's price action has gracefully morphed into what can only be described as the "Giraffe Pattern." This tall and lanky formation has BTC traders everywhere scratching their heads, wondering if the crypto market is reaching new heights or just taking a long, leisurely stretch before a big crash.🔍 Key Observations:Neck-Breaking Highs: Much like a giraffe reaching for the highest leaves, BTC seems determined to stretch as far as possible. But beware, the longer the neck, the harder the fall!Wobbly Legs: Those support levels look more like wobbly giraffe legs—one wrong step and down she goes! Will BTC stumble, or is it simply preparing for a graceful stride to new heights?Tiny Tail: That final flicker at the top could be the last hurrah before BTC decides it’s time to come back down to earth.💡 Trade Idea: Watch out for when the giraffe gets tired! The long neck might signal that it's time for a correction, or maybe this giraffe is about to grow wings—who knows in the wild jungle of crypto?Disclaimer: NOT FINANCIAL ADVICE FROM THE GIRAFFE
felixfenix

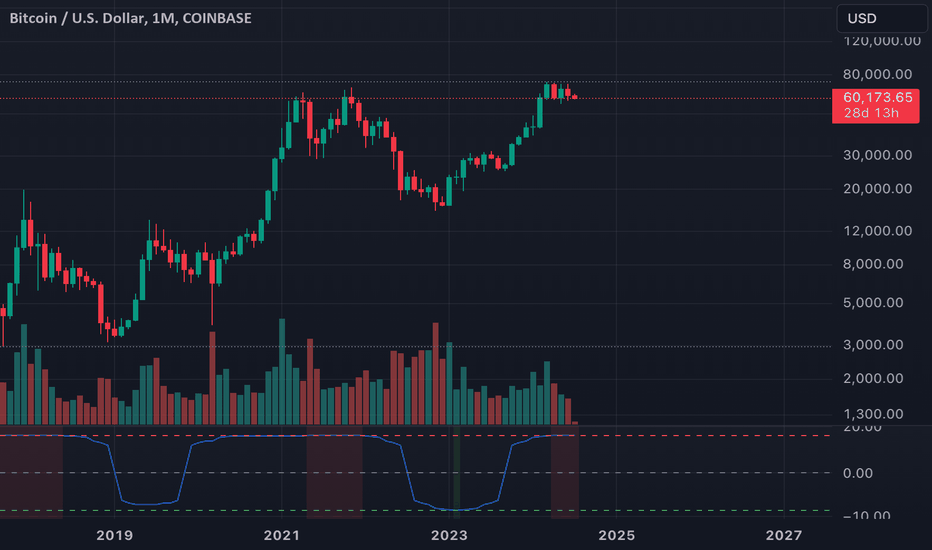
Description:Bitcoin appears to be in a bear market, and several key indicators support this observation. Here’s an analysis of these indicators to explain the current bearish trend.1. Price Action:In a bear market, Bitcoin shows a pattern of declining highs and lows. This means that each peak and trough in the price is lower than the previous ones, indicating a downtrend. In the attached chart, you can see this pattern clearly, confirming that Bitcoin is trending downwards.2. Volume Analysis:Volume analysis helps us understand the strength behind price movements. In a bear market, significant price drops without a corresponding increase in trading volume suggest weak support from traders. The attached chart shows that during price declines, the volume does not significantly increase, indicating a lack of strong buying interest to support higher prices.3. Momentum Analysis:Momentum indicators are useful for assessing the strength and direction of a trend. In a bear market, these indicators typically remain below a central reference line and often show a negative slope, reflecting continued downward pressure. Our analysis of the chart indicates that the momentum remains negative, reinforcing the bearish trend.Conclusion:Based on price action, volume analysis, and momentum indicators, it is evident that Bitcoin is currently in a bear market. The observed patterns of lower highs and lower lows, coupled with weak volume support and negative momentum, all suggest that the bearish trend is likely to continue. Traders should exercise caution and consider these indicators when making investment decisions.As predicted, BTC has started its descend touching 58k. Next leg down should be $40,000BTC has closed critical 56,600 support and should head towards 48k where it may consolidate for a while
Disclaimer
Any content and materials included in Sahmeto's website and official communication channels are a compilation of personal opinions and analyses and are not binding. They do not constitute any recommendation for buying, selling, entering or exiting the stock market and cryptocurrency market. Also, all news and analyses included in the website and channels are merely republished information from official and unofficial domestic and foreign sources, and it is obvious that users of the said content are responsible for following up and ensuring the authenticity and accuracy of the materials. Therefore, while disclaiming responsibility, it is declared that the responsibility for any decision-making, action, and potential profit and loss in the capital market and cryptocurrency market lies with the trader.