
faruk40
@t_faruk40

What symbols does the trader recommend buying?
Purchase History
پیام های تریدر
Filter
Signal Type
faruk40
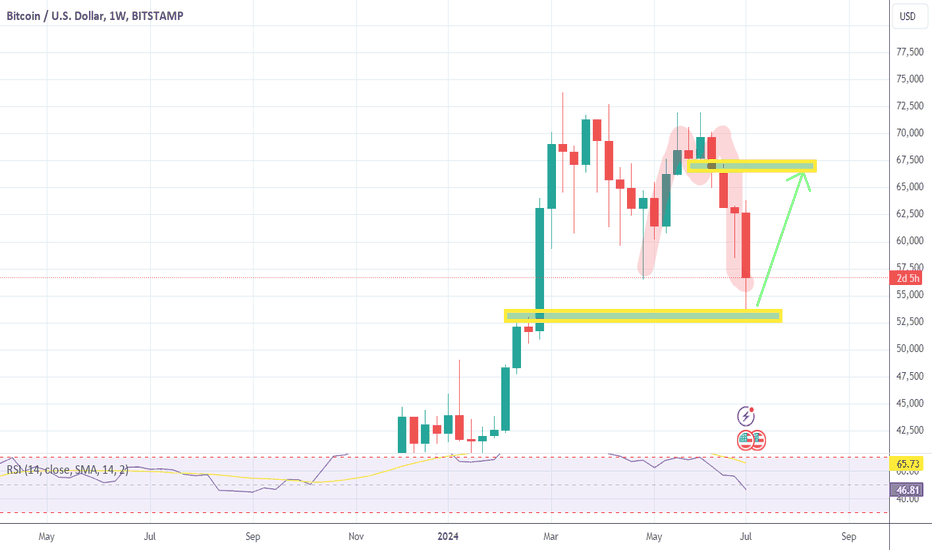
BTCUSD Weekly Chart Forms 'M' Pattern: Price Target Set at $67,000 The BTCUSD price movement on the weekly chart has formed a distinctive "M" pattern, indicating potential bullish momentum. Based on this pattern, we can expect the price to rise from the current level of $56,000 to a target of $67,000. This pattern suggests a strong possibility of upward movement, providing traders with a clear target for potential gains. As the market aligns with this technical setup, many will be watching closely for further confirmation and potential entry points to capitalize on the expected price increase.
faruk40
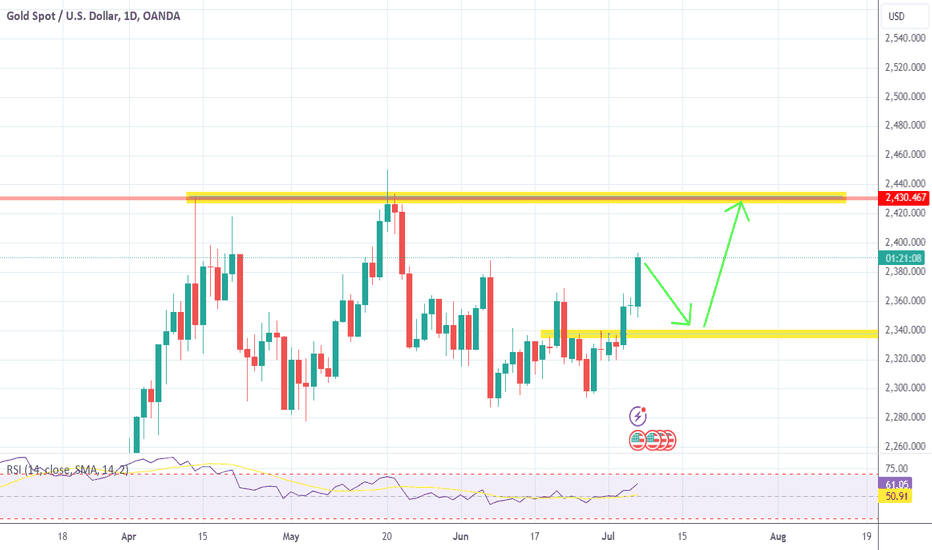
Gold prices have recently seen a successful breakout above the critical level of $2340, setting a new target at $2430. Traders are now closely monitoring the market, anticipating a potential retest of the previous support level at $2340. This retest is seen as an opportunity to take a long position with lower risk, leveraging the support level as a buffer against downside movement. By entering at this retested support, traders aim to maximize their profit potential while minimizing risk exposure.
faruk40
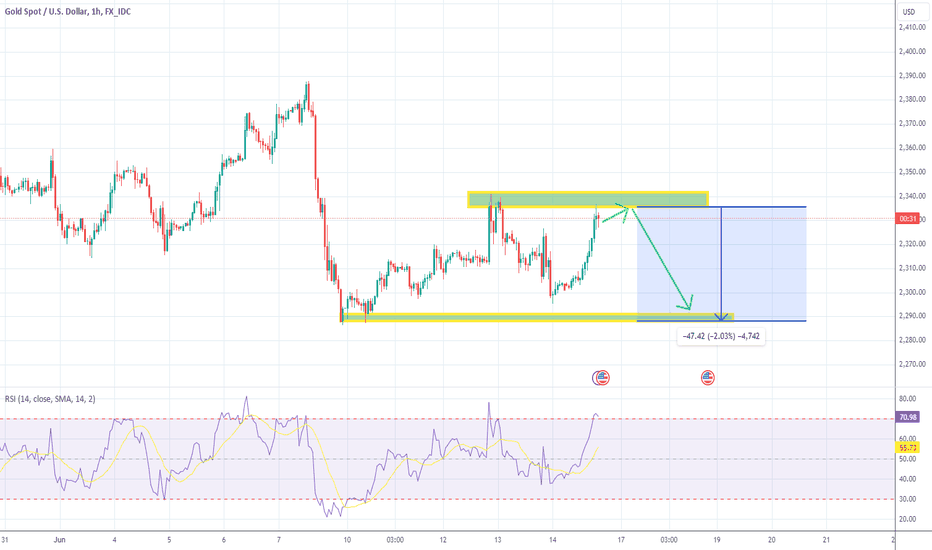
Gold has found short-term support near 2300 and has rebounded, currently trading around 2330. Major indicators suggest that the bullish momentum has not been fully exhausted. There is a high likelihood of another upward movement in the US market today or early next week, with strong resistance expected around 2352. At that point, the bullish momentum may wane, entering a consolidation phase. If the indicators fail to signal a renewed bullish trend, gold prices could drop below 2300, with the next short-term target around 2268.
faruk40
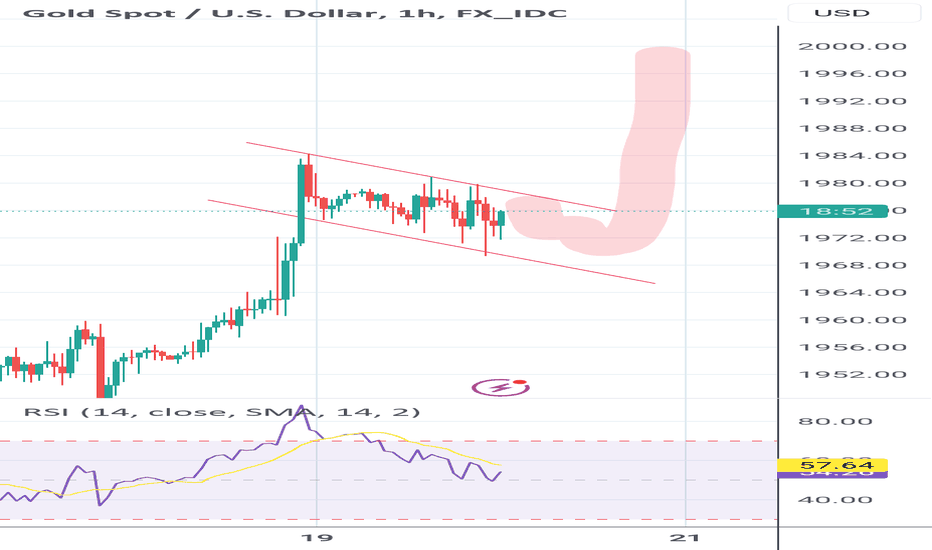
The XAUUSD chart represents the price movement of gold (XAU) against the US dollar (USD) in the financial markets. Analyzing the XAUUSD chart provides insights into the performance and trends of gold prices in relation to the US dollar. In the given analysis, it is predicted that the price of gold will likely reach $2000 USD over the upcoming weekend. This prediction suggests a potential bullish sentiment in the market for gold. To conduct a thorough analysis of the XAUUSD chart, traders and analysts often employ various technical indicators and tools. These may include trend lines, moving averages, support and resistance levels, and oscillators such as the Relative Strength Index (RSI) or Moving Average Convergence Divergence (MACD). These tools aid in identifying price patterns, potential entry or exit points, and gauging market sentiment. Additionally, fundamental factors such as economic data, geopolitical events, and monetary policy decisions can also influence gold prices and should be considered when analyzing the XAUUSD chart. Factors like inflation, interest rates, global economic stability, and market demand for safe-haven assets can have a significant impact on the price of gold. It is essential to regularly monitor and analyze the XAUUSD chart to gain a comprehensive understanding of the market dynamics and make informed trading decisions. Traders and investors often combine technical analysis with fundamental analysis to form a well-rounded view of the gold market, allowing them to navigate potential risks and capitalize on opportunities.
faruk40
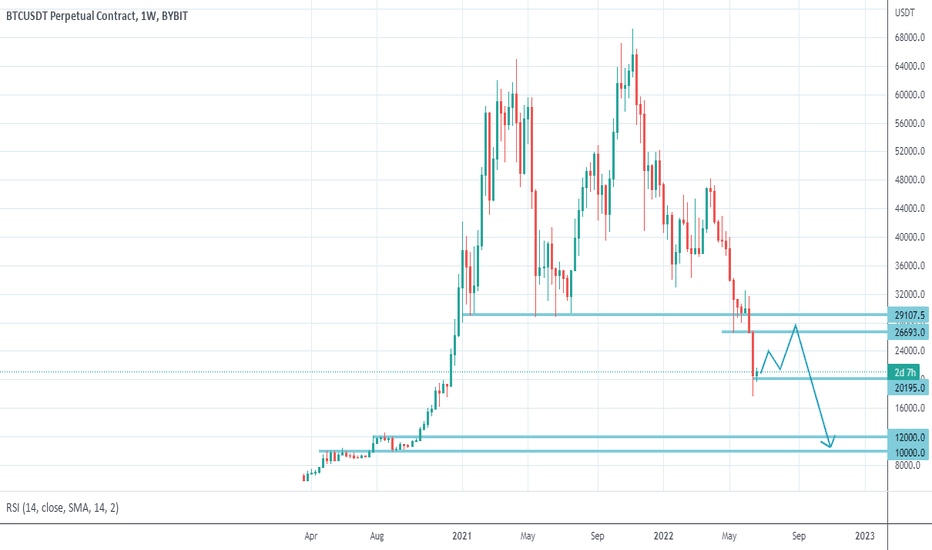
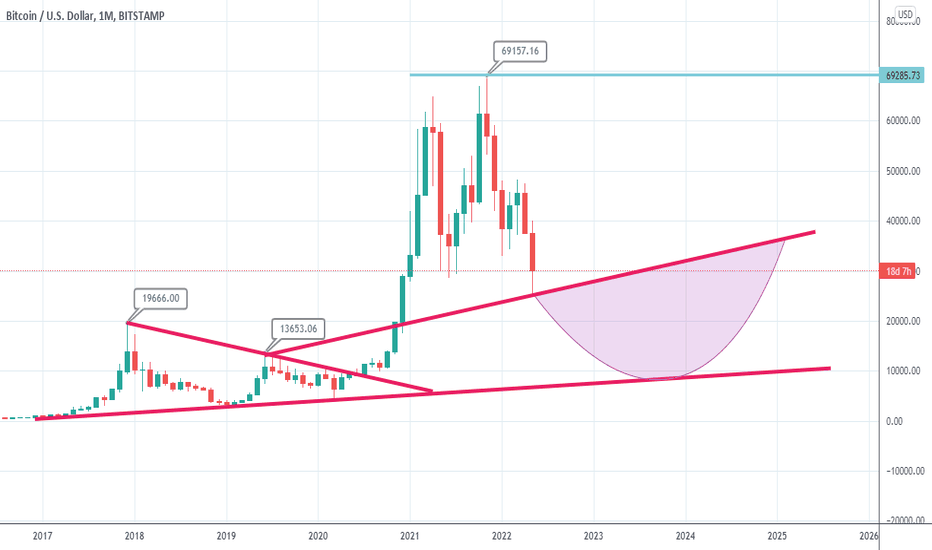
Overall after some positive movements (26000-29000) #BTC will prepare to go to 12000-10000. Large investors will not enter this market before 12000-10000.
faruk40
Disclaimer
Any content and materials included in Sahmeto's website and official communication channels are a compilation of personal opinions and analyses and are not binding. They do not constitute any recommendation for buying, selling, entering or exiting the stock market and cryptocurrency market. Also, all news and analyses included in the website and channels are merely republished information from official and unofficial domestic and foreign sources, and it is obvious that users of the said content are responsible for following up and ensuring the authenticity and accuracy of the materials. Therefore, while disclaiming responsibility, it is declared that the responsibility for any decision-making, action, and potential profit and loss in the capital market and cryptocurrency market lies with the trader.