
ew_17i
@t_ew_17i

What symbols does the trader recommend buying?
Purchase History
پیام های تریدر
Filter
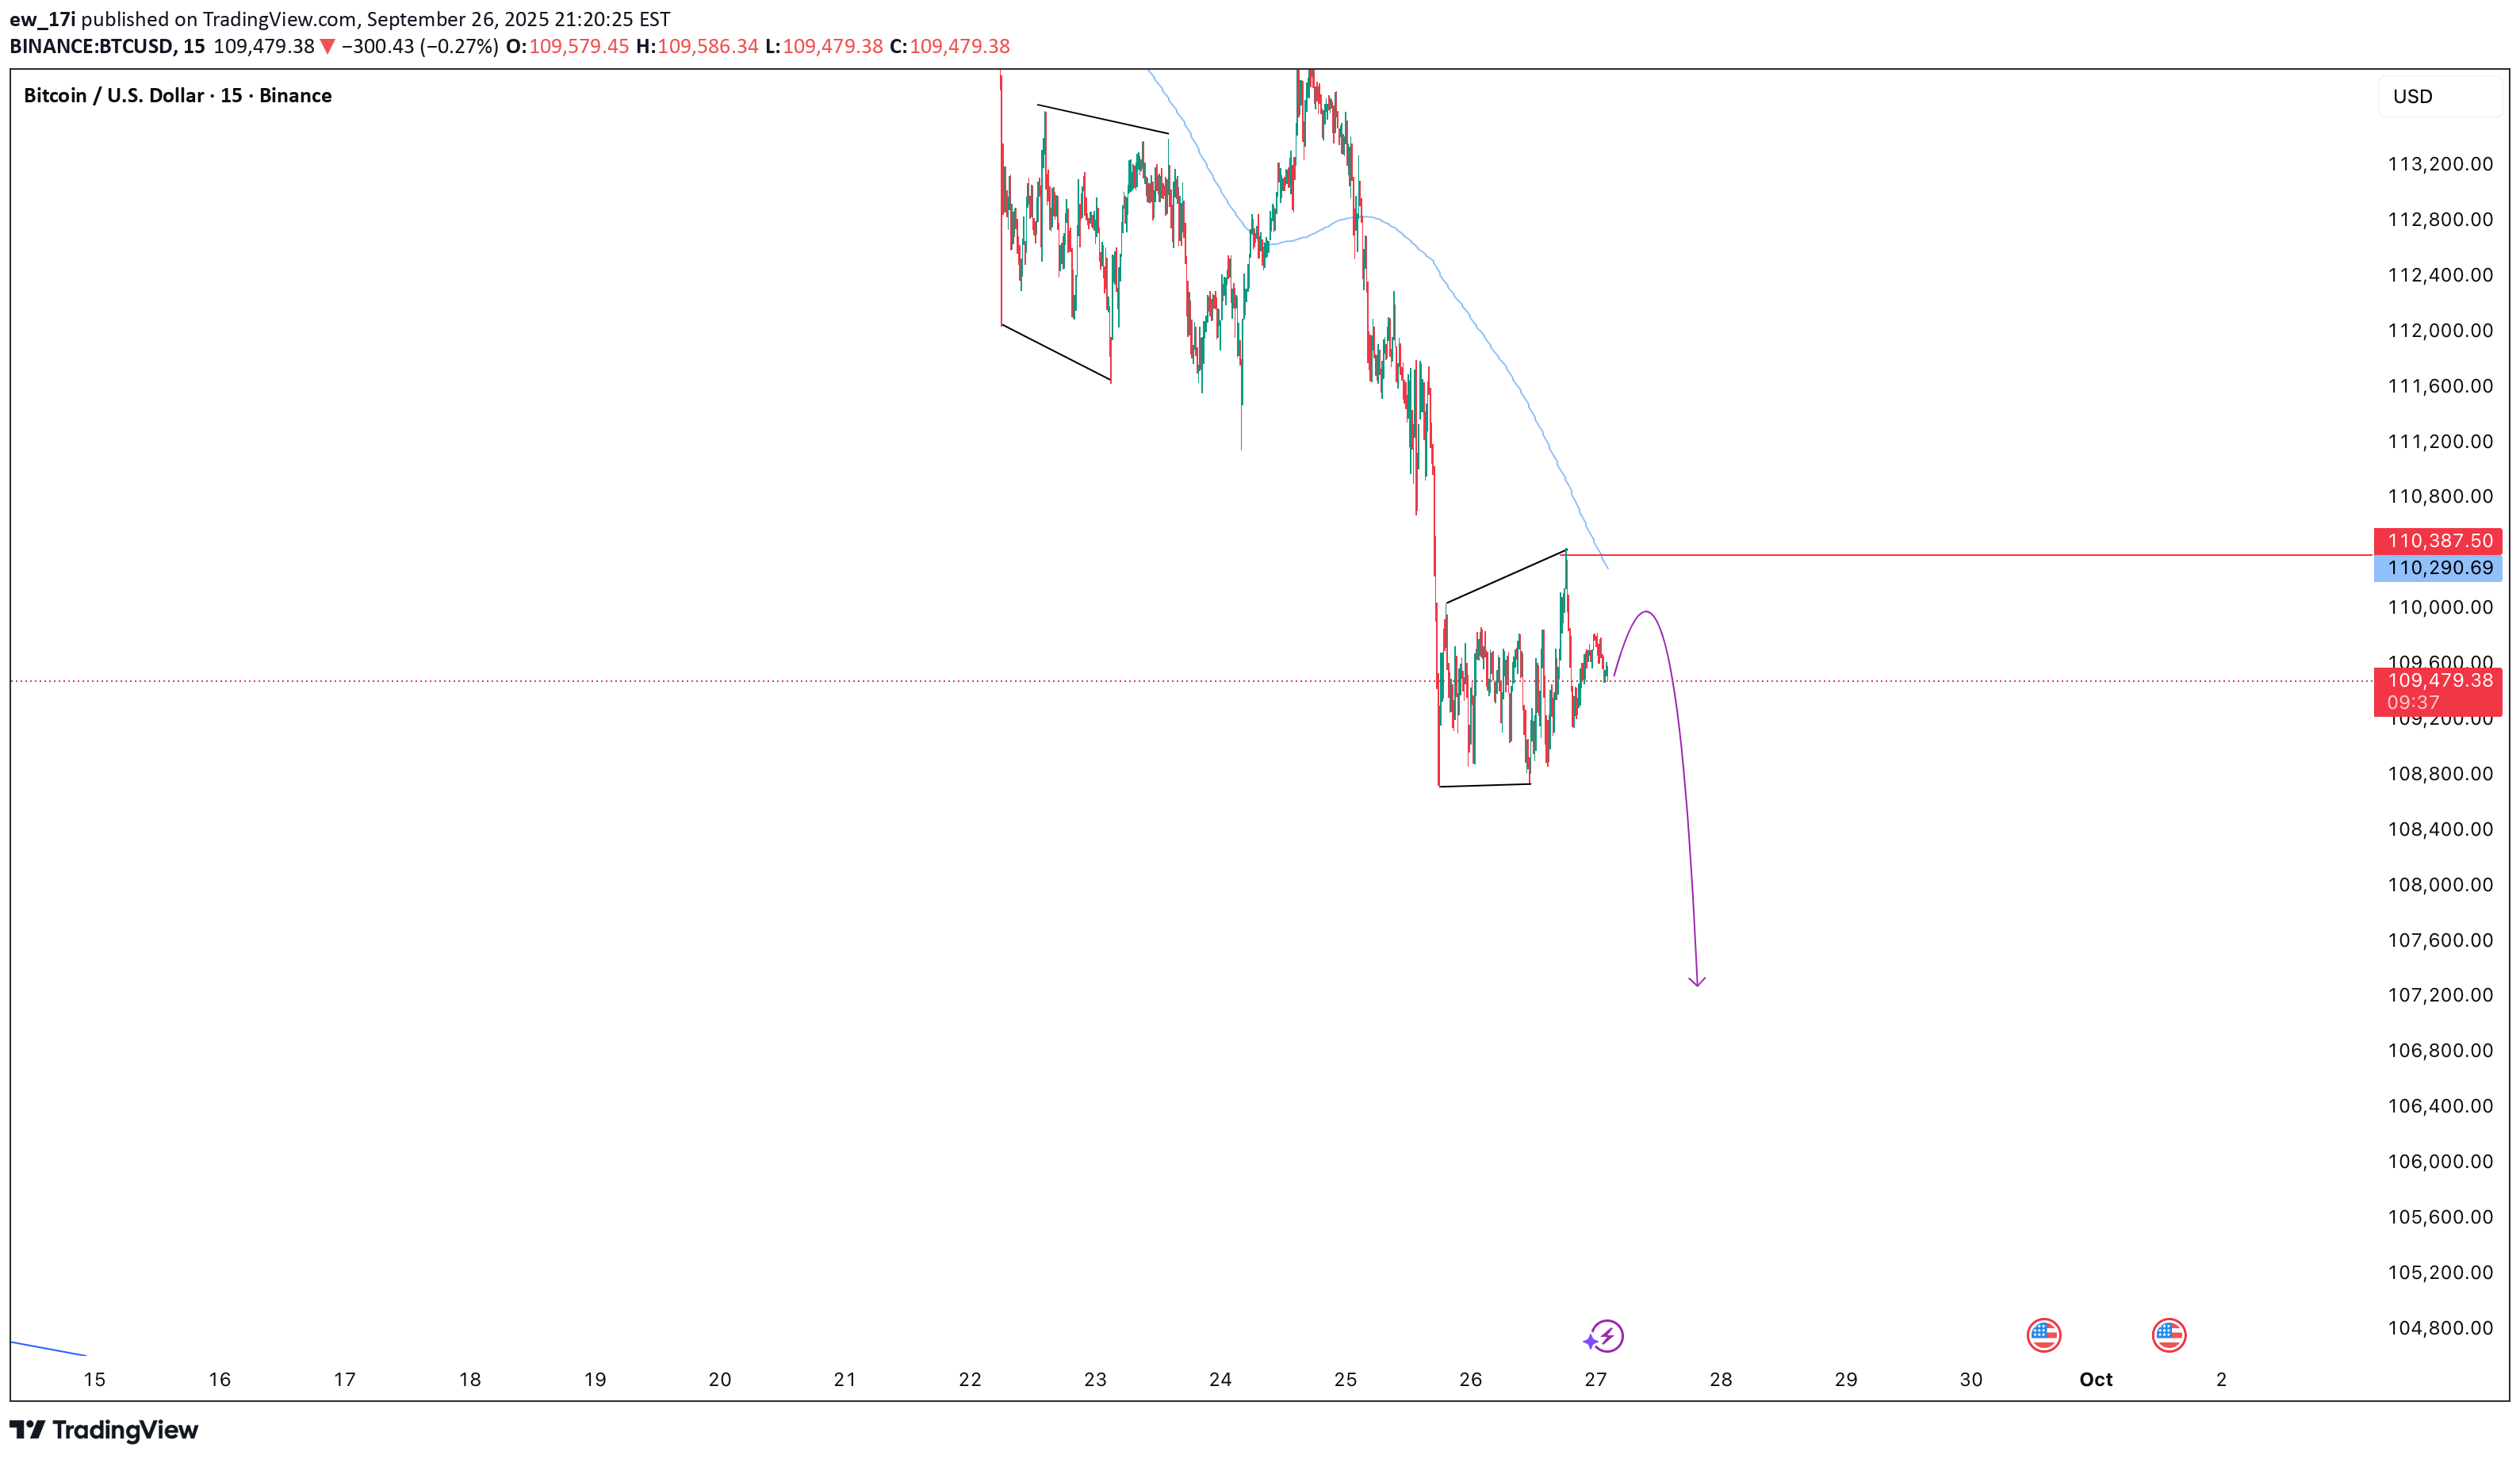
ew_17i
BTC
Bitcoin is continuing its bearish structure, suggesting further downside pressure in the current wave development. The market remains weak, and unless strong reversal signals appear, the decline could extend toward lower support zones. Traders should maintain a cautious bearish bias and wait for confirmation before entering short positions.
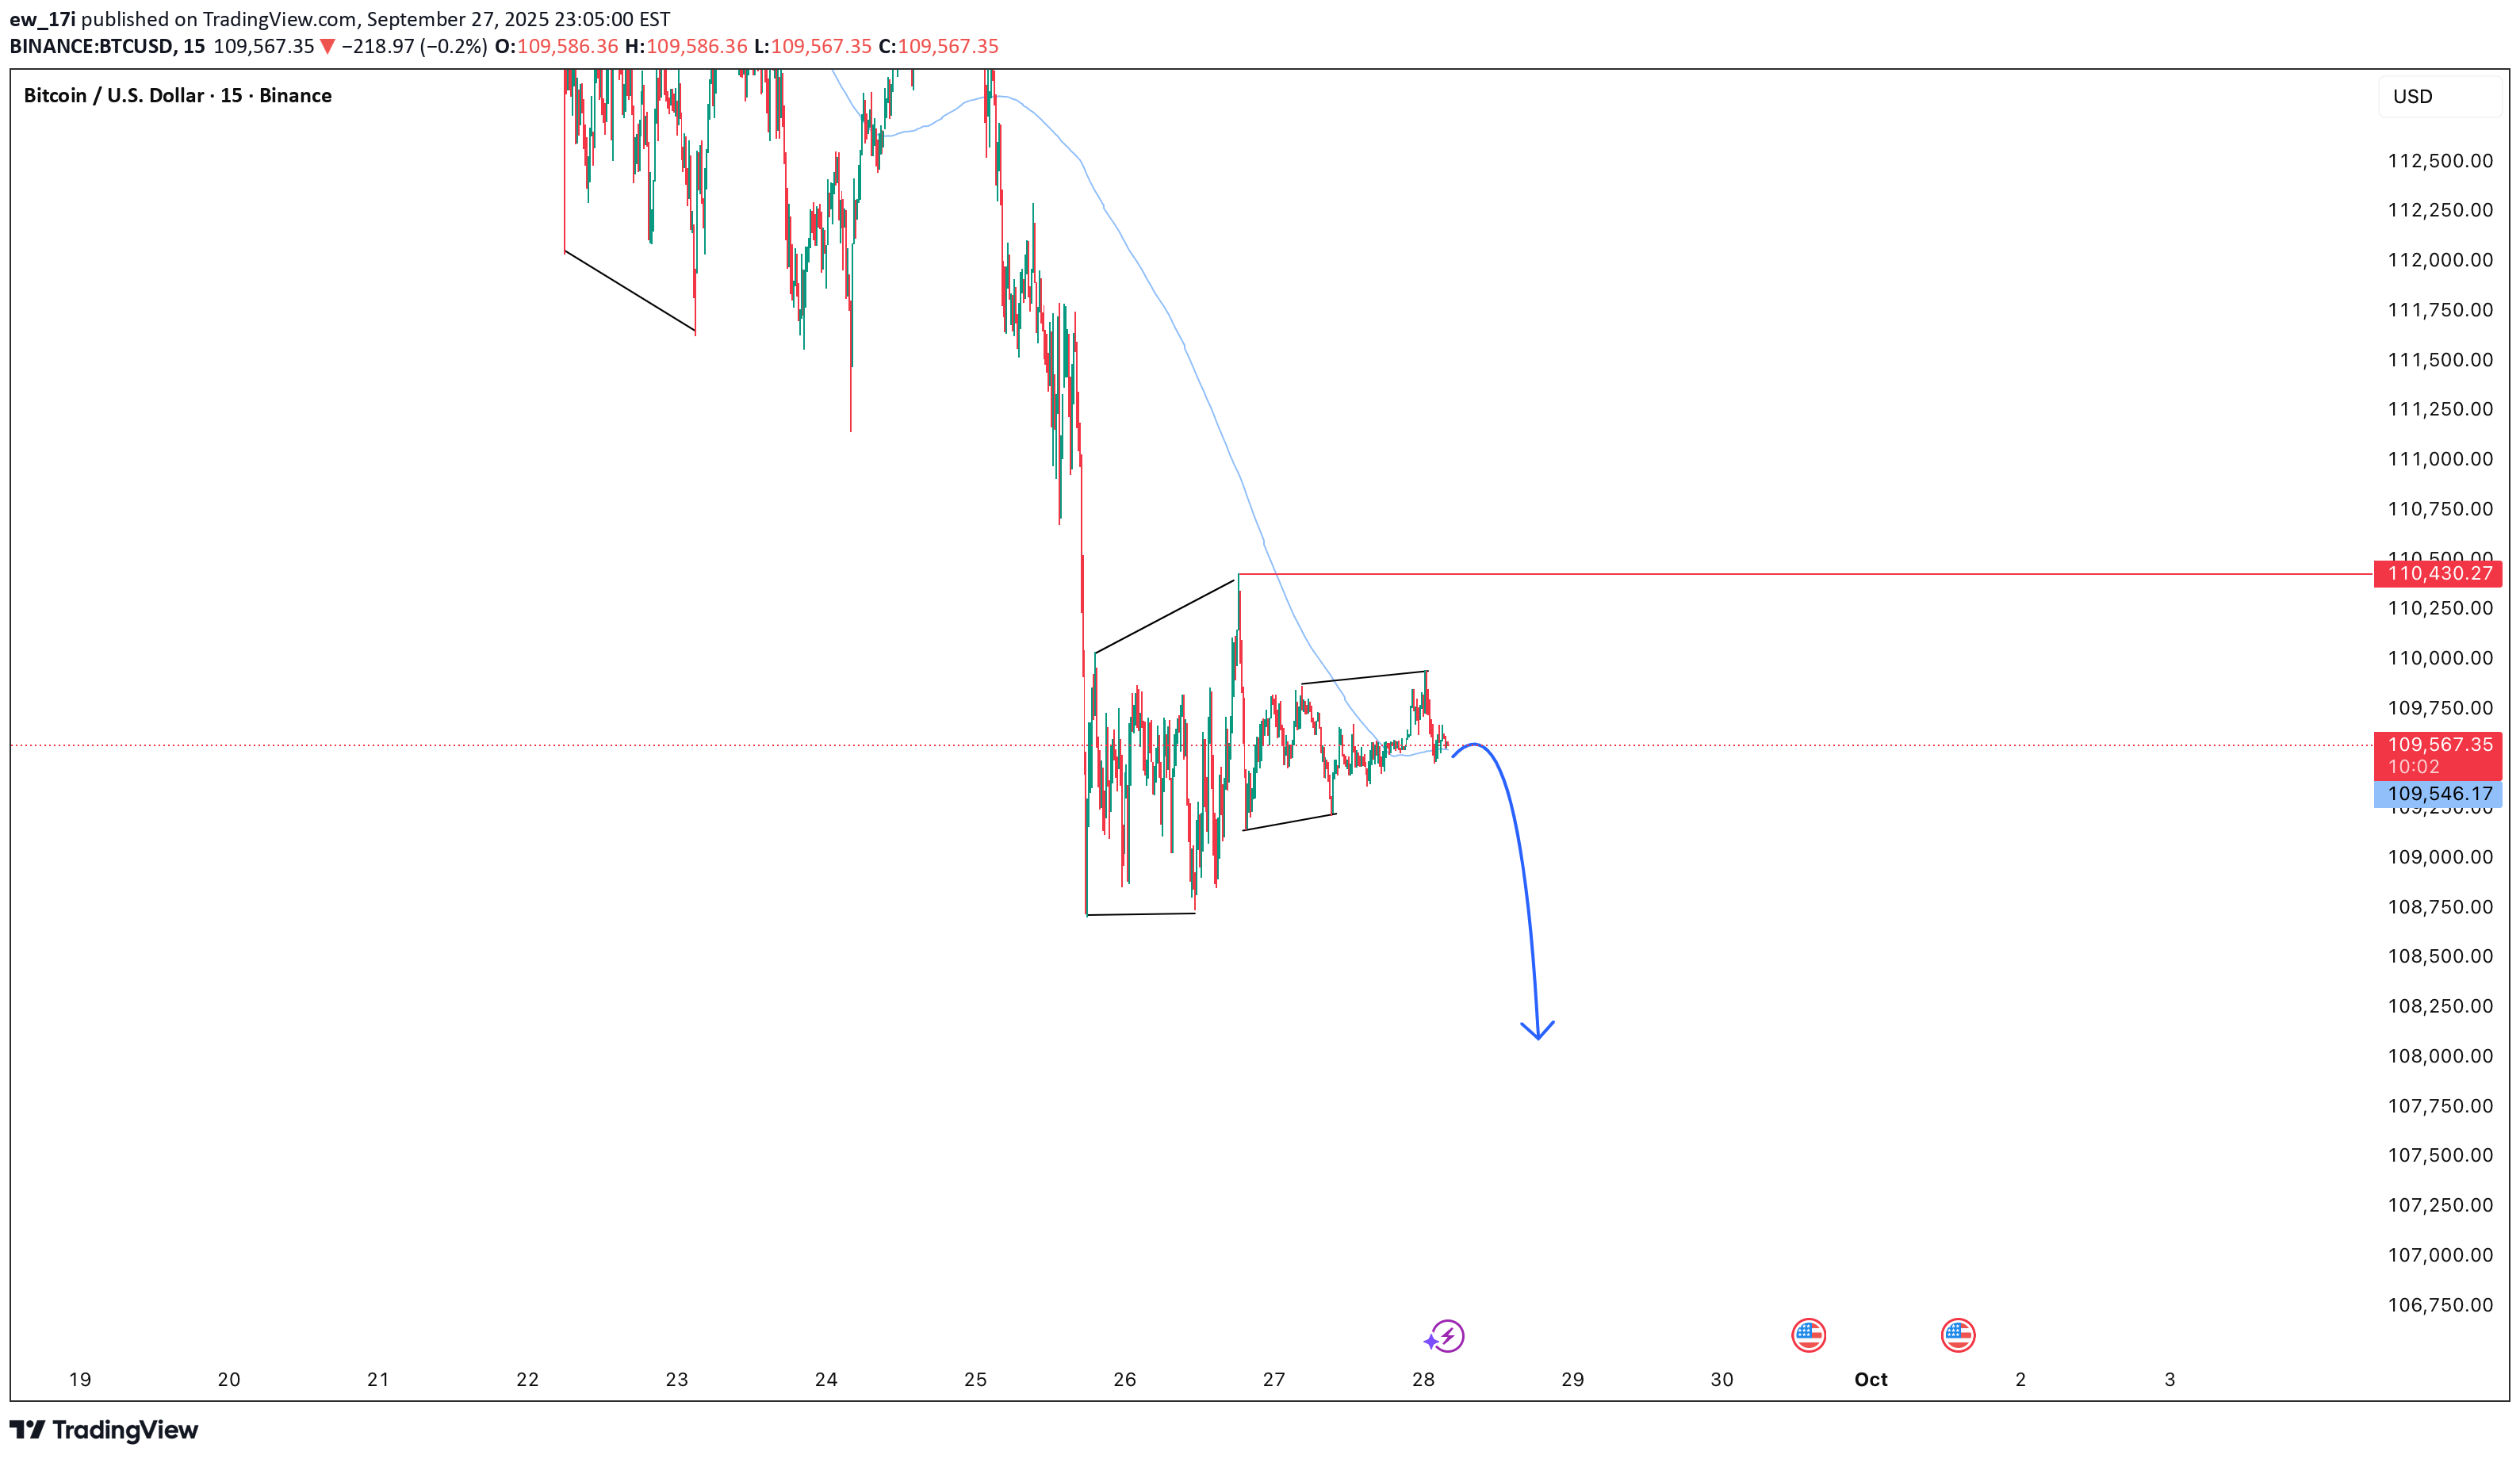
ew_17i
BTC
Bitcoin is expected to extend its bearish move with a potential target around 101,000. This level stands as a significant downside zone in the current Elliott Wave structure. Traders should maintain a cautious bearish bias, watching for short opportunities while monitoring key support areas for possible reversals.
ew_17i
Gold Elliott Wave Update: Waiting for a Perfect BUY at 361x
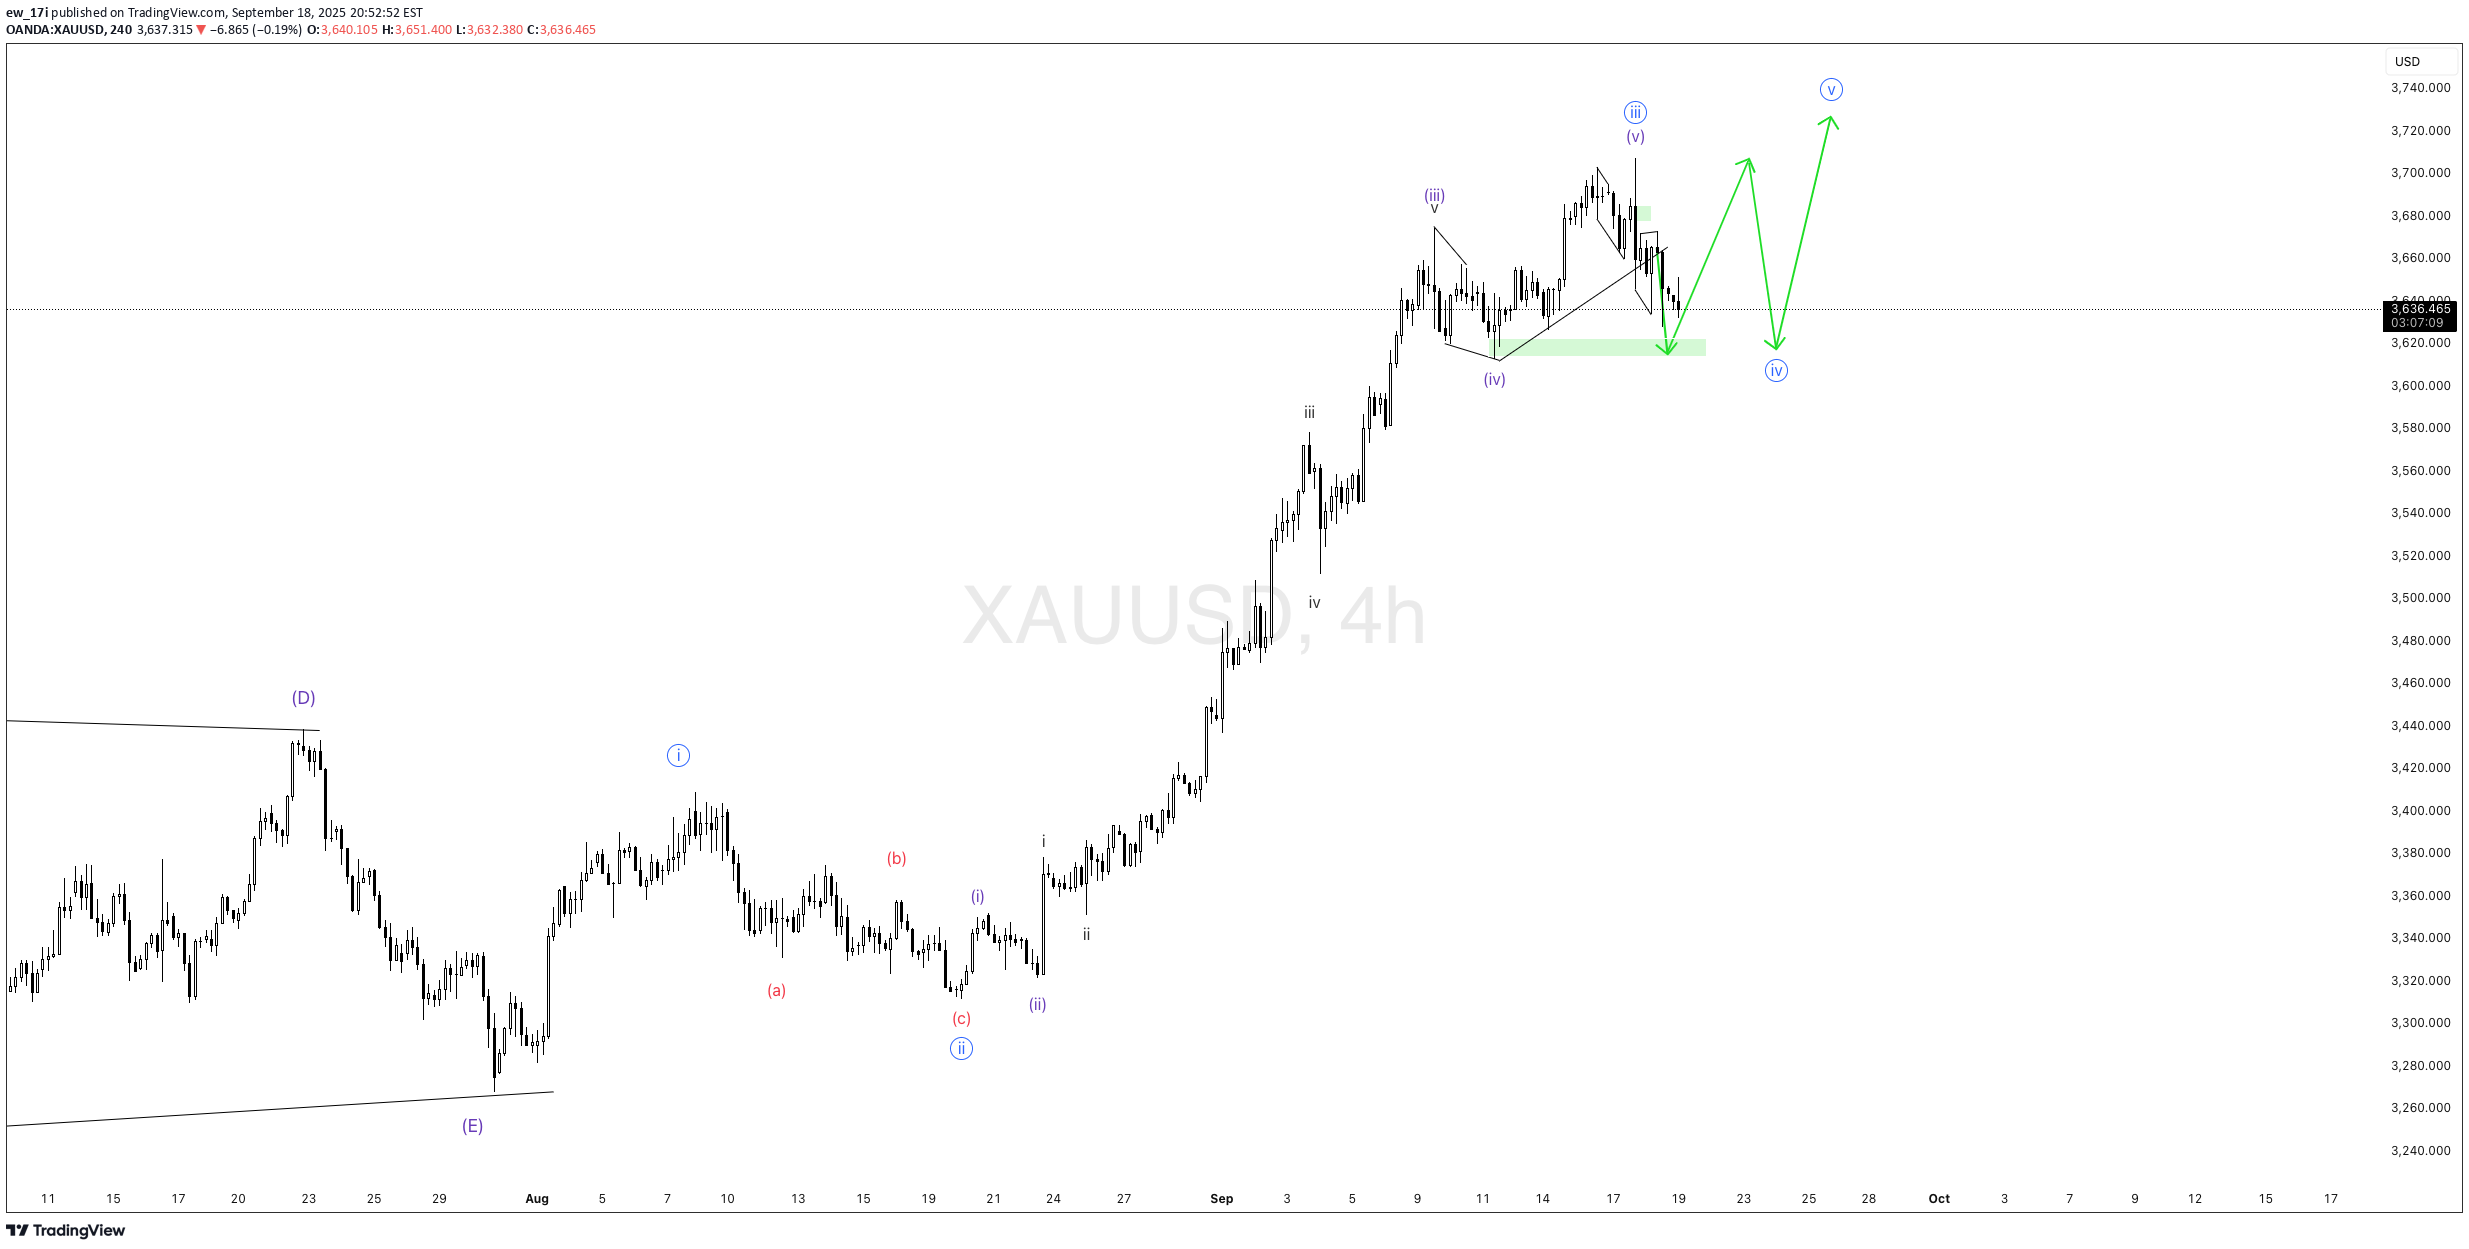
Continuing with yesterday’s gold plan, the market is still in a corrective phase and is likely to move down toward the 361x area. This level acts as an important support zone and also aligns with the Elliott Wave corrective structure, making it a potential area to watch for buying opportunities. At this stage, traders should remain patient and avoid rushing into early entries before clear signals are confirmed. Once the price approaches the 361x zone, it will be crucial to monitor reversal patterns, candlestick confirmations, or strong technical signals such as RSI divergence, a bullish MACD crossover, or smaller wave structures indicating the beginning of a new uptrend. If these signals appear, this will present an excellent opportunity to enter BUY positions in line with the larger bullish outlook. The main objective of this plan is to capture the next upward wave of gold once the correction has been completed. However, it is important to emphasize that this is only a personal viewpoint. Proper risk management and position sizing should always be the top priority to protect capital and ensure sustainable trading results.
ew_17i
Gold in Wave 4: Correction to 361x Before a Breakout?
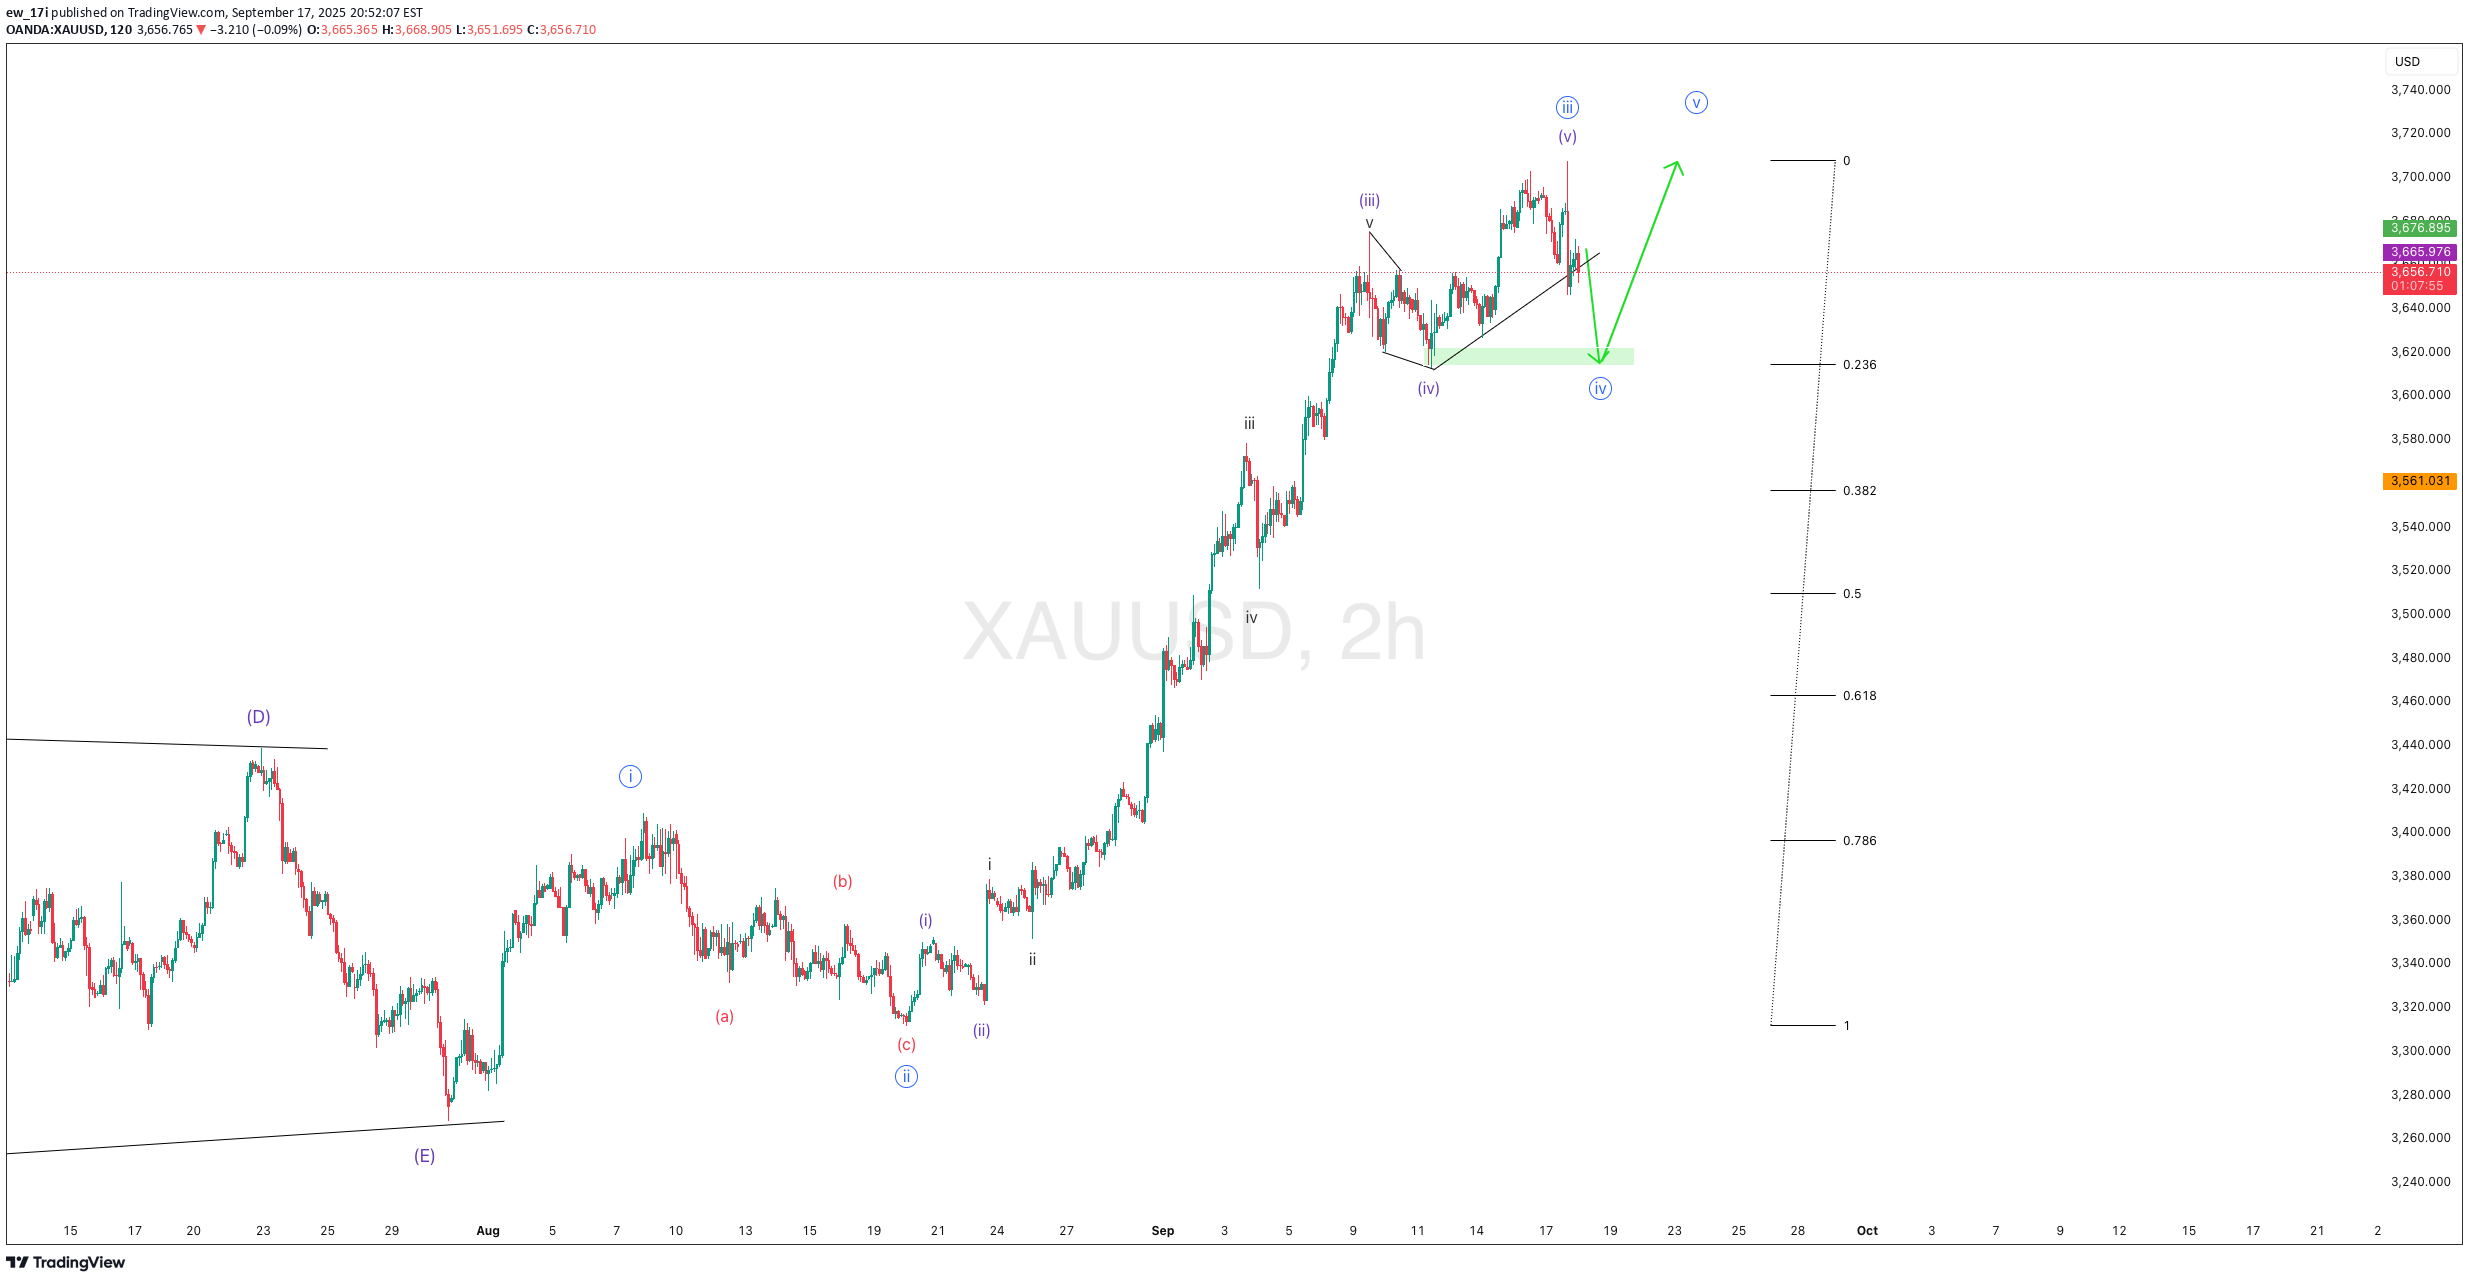
At the moment, Gold is unfolding within Wave 4 of the Elliott Wave structure. This phase is typically corrective in nature, and the current market behavior suggests a retracement toward the 361x zone. This area may serve as a key support level where the correction could complete. For short-term traders, the correction provides opportunities to take advantage of short positions while the market is still moving downward. However, it is important to manage risk carefully since corrective moves can often be choppy and unpredictable. Once the corrective structure of Wave 4 is complete, the larger Elliott Wave count points to the possibility of a strong bullish reversal. This would align with the expectation of entering Wave 5, where Gold could resume its upward momentum and continue the overall bullish trend. The recommended strategy is twofold: consider short-term sell trades while Gold is in the correction phase, but also prepare for potential buy setups once price action shows clear bullish confirmation near the 361x zone. Patience and discipline will be key in timing the transition from short-term selling to positioning for the next major upward move.
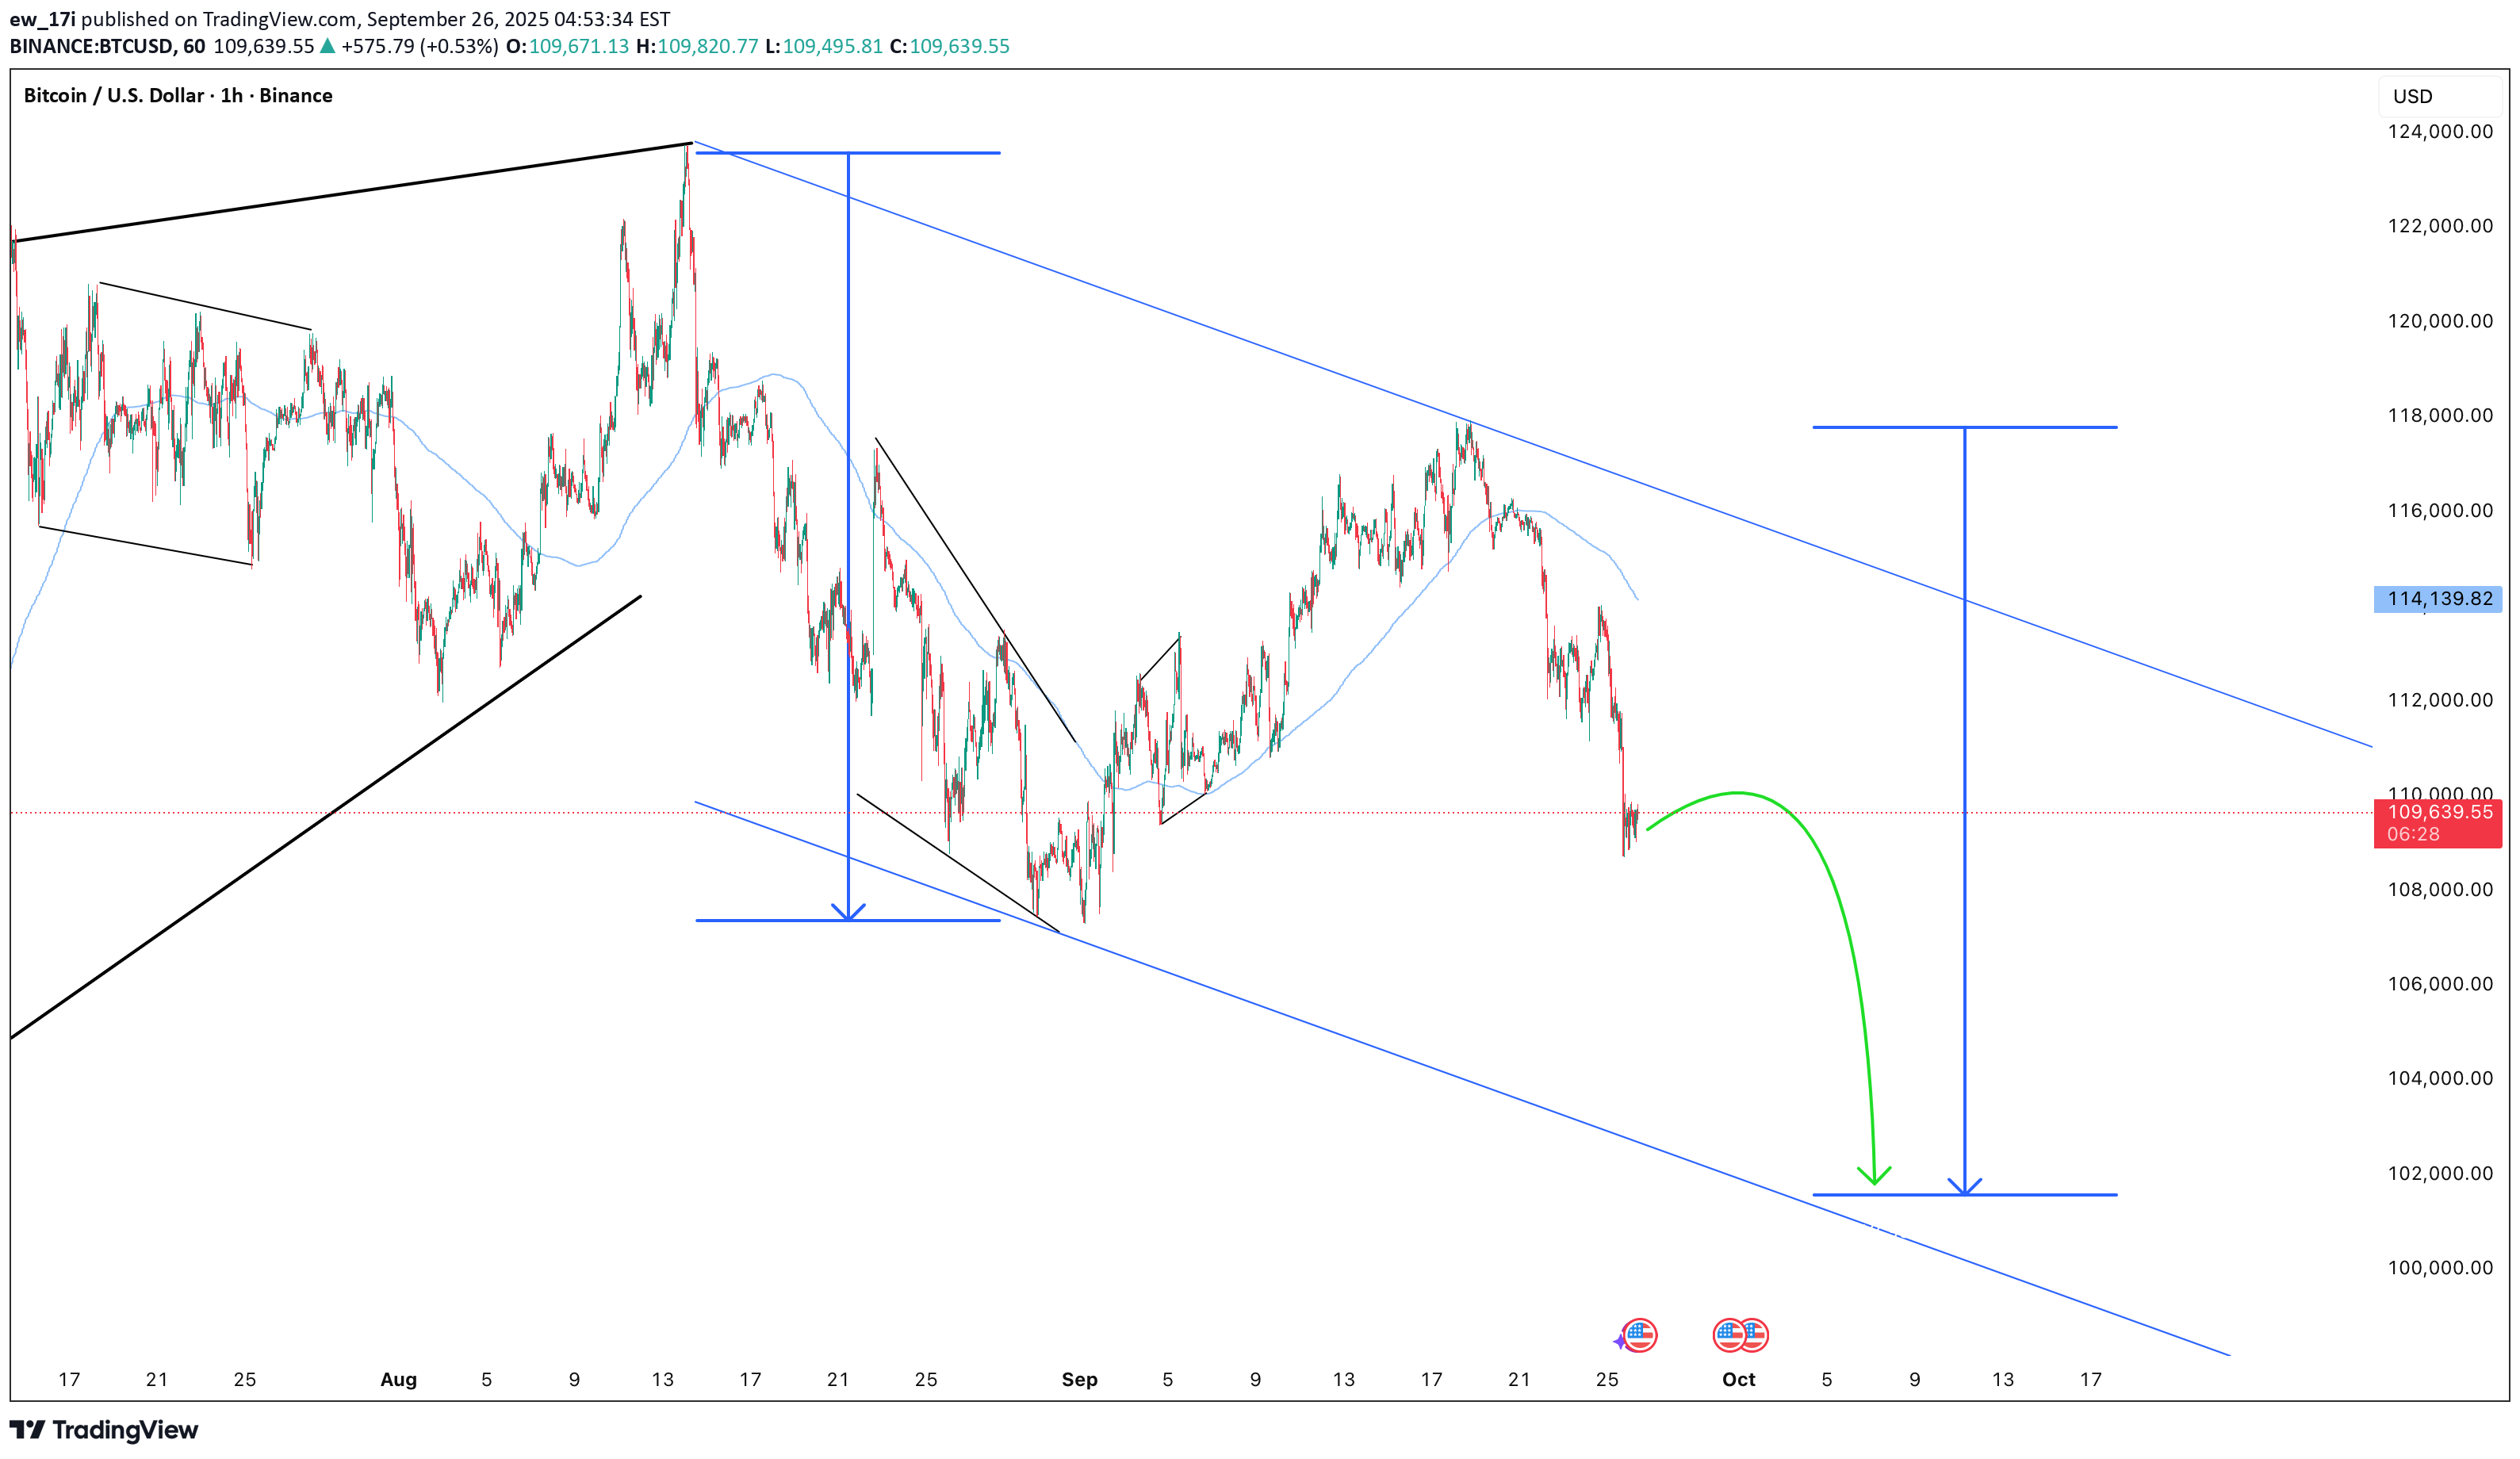
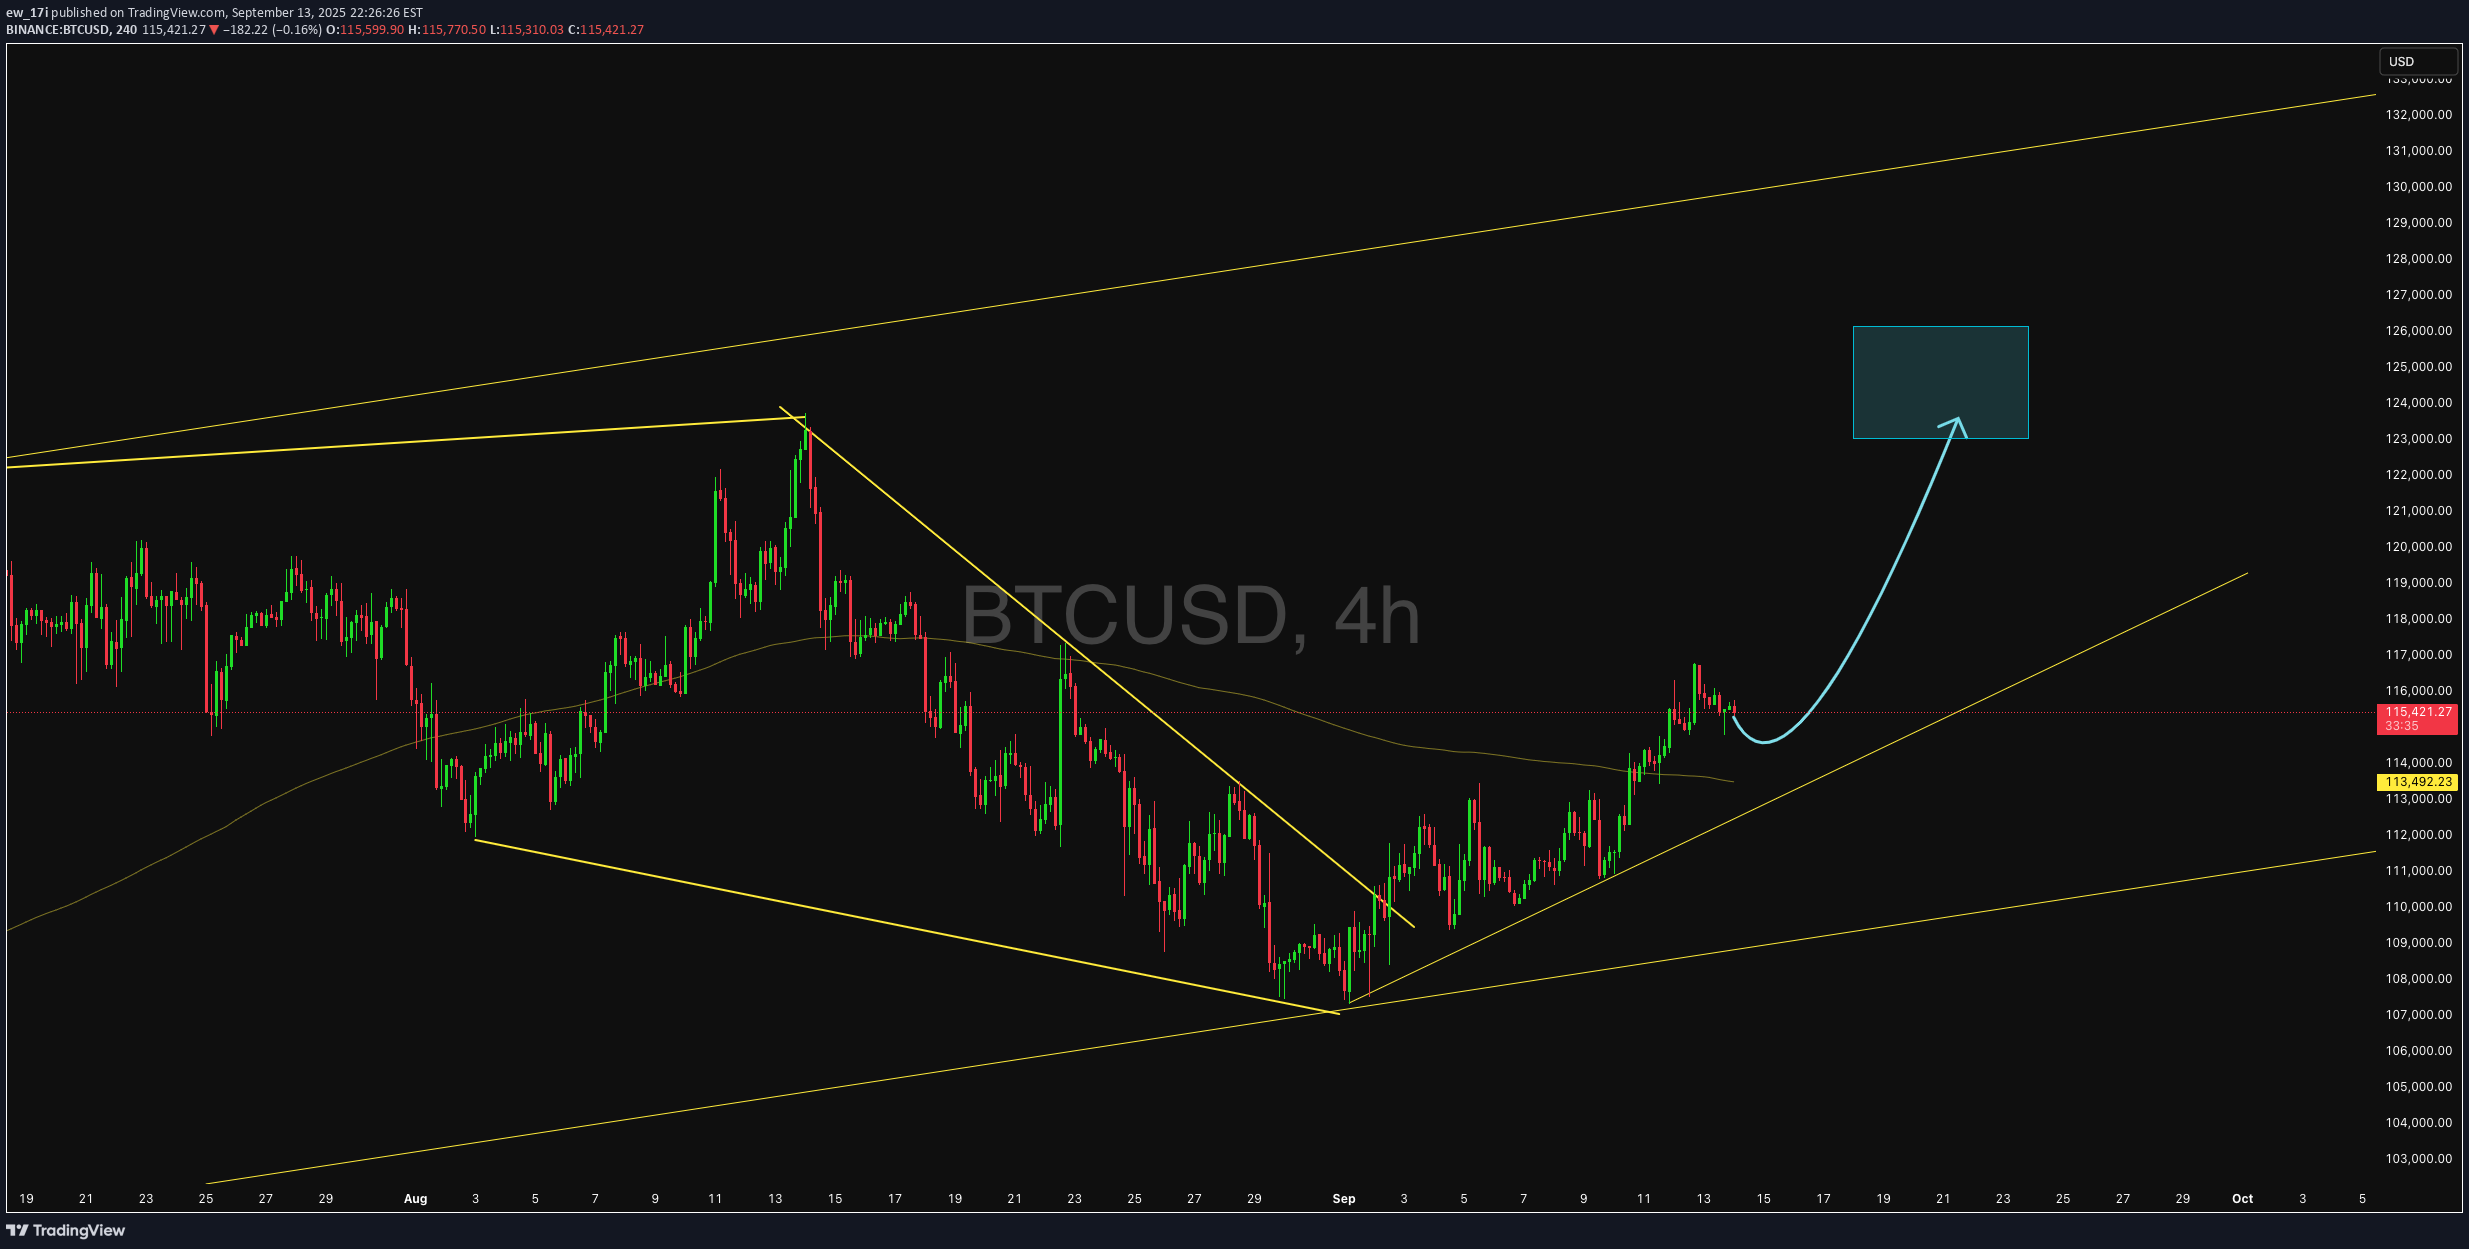
ew_17i
BTC
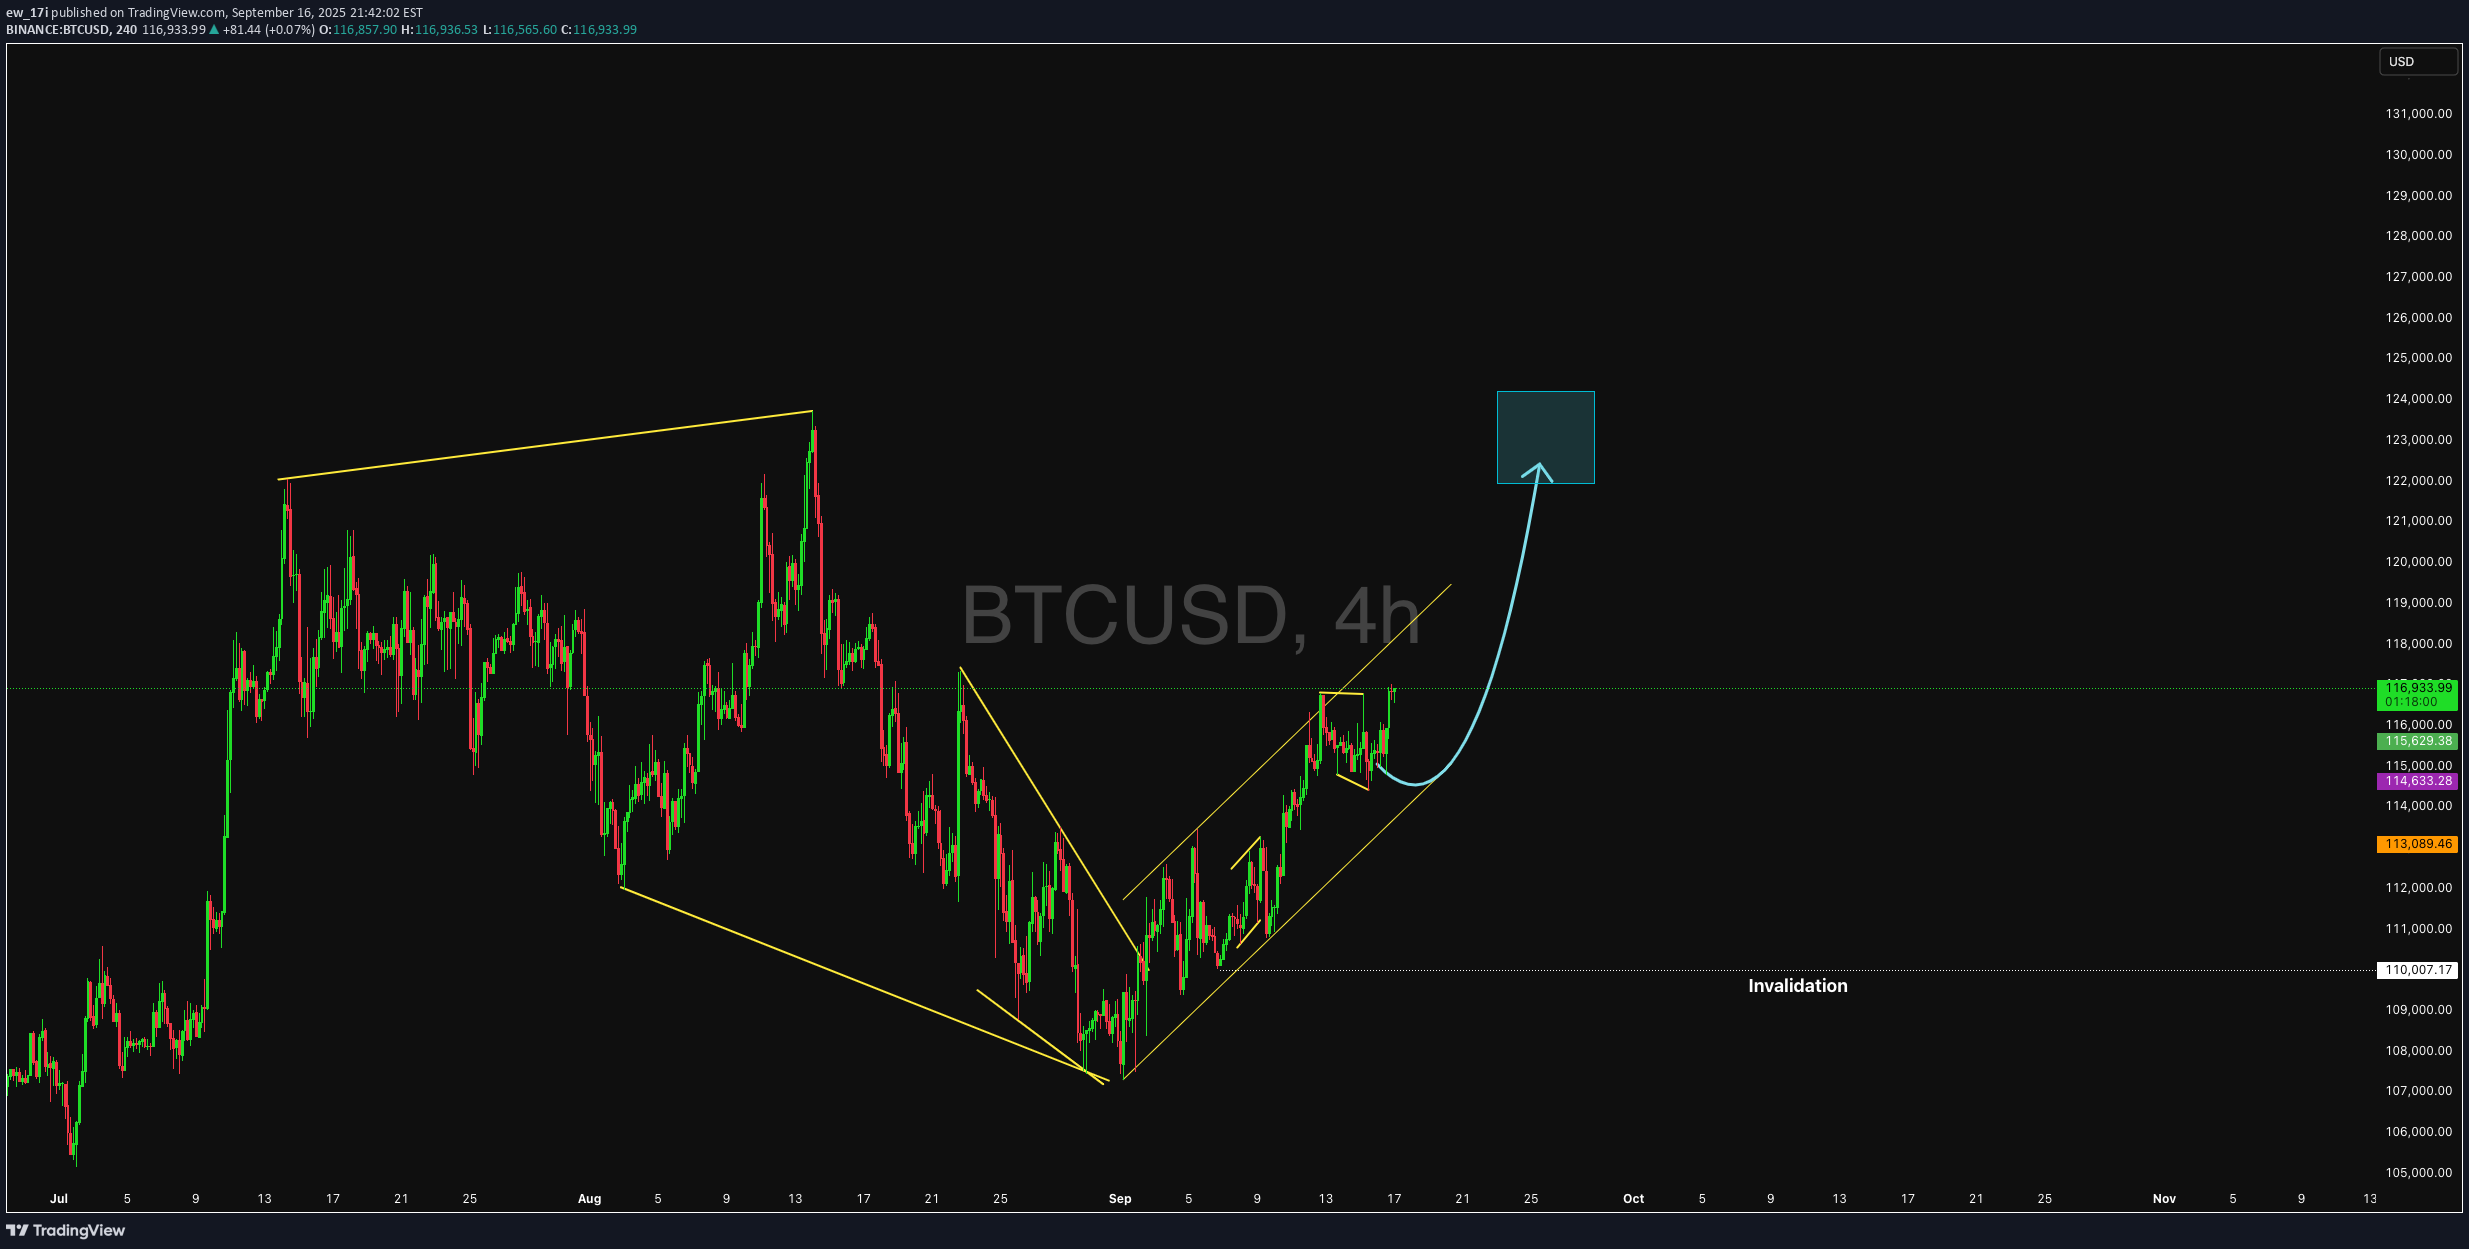
Today’s Elliott Wave analysis for BTCUSD suggests the pair is following its current wave count, with potential for continued bullish momentum if key support levels remain intact. Traders should watch for confirmation before entering positions.
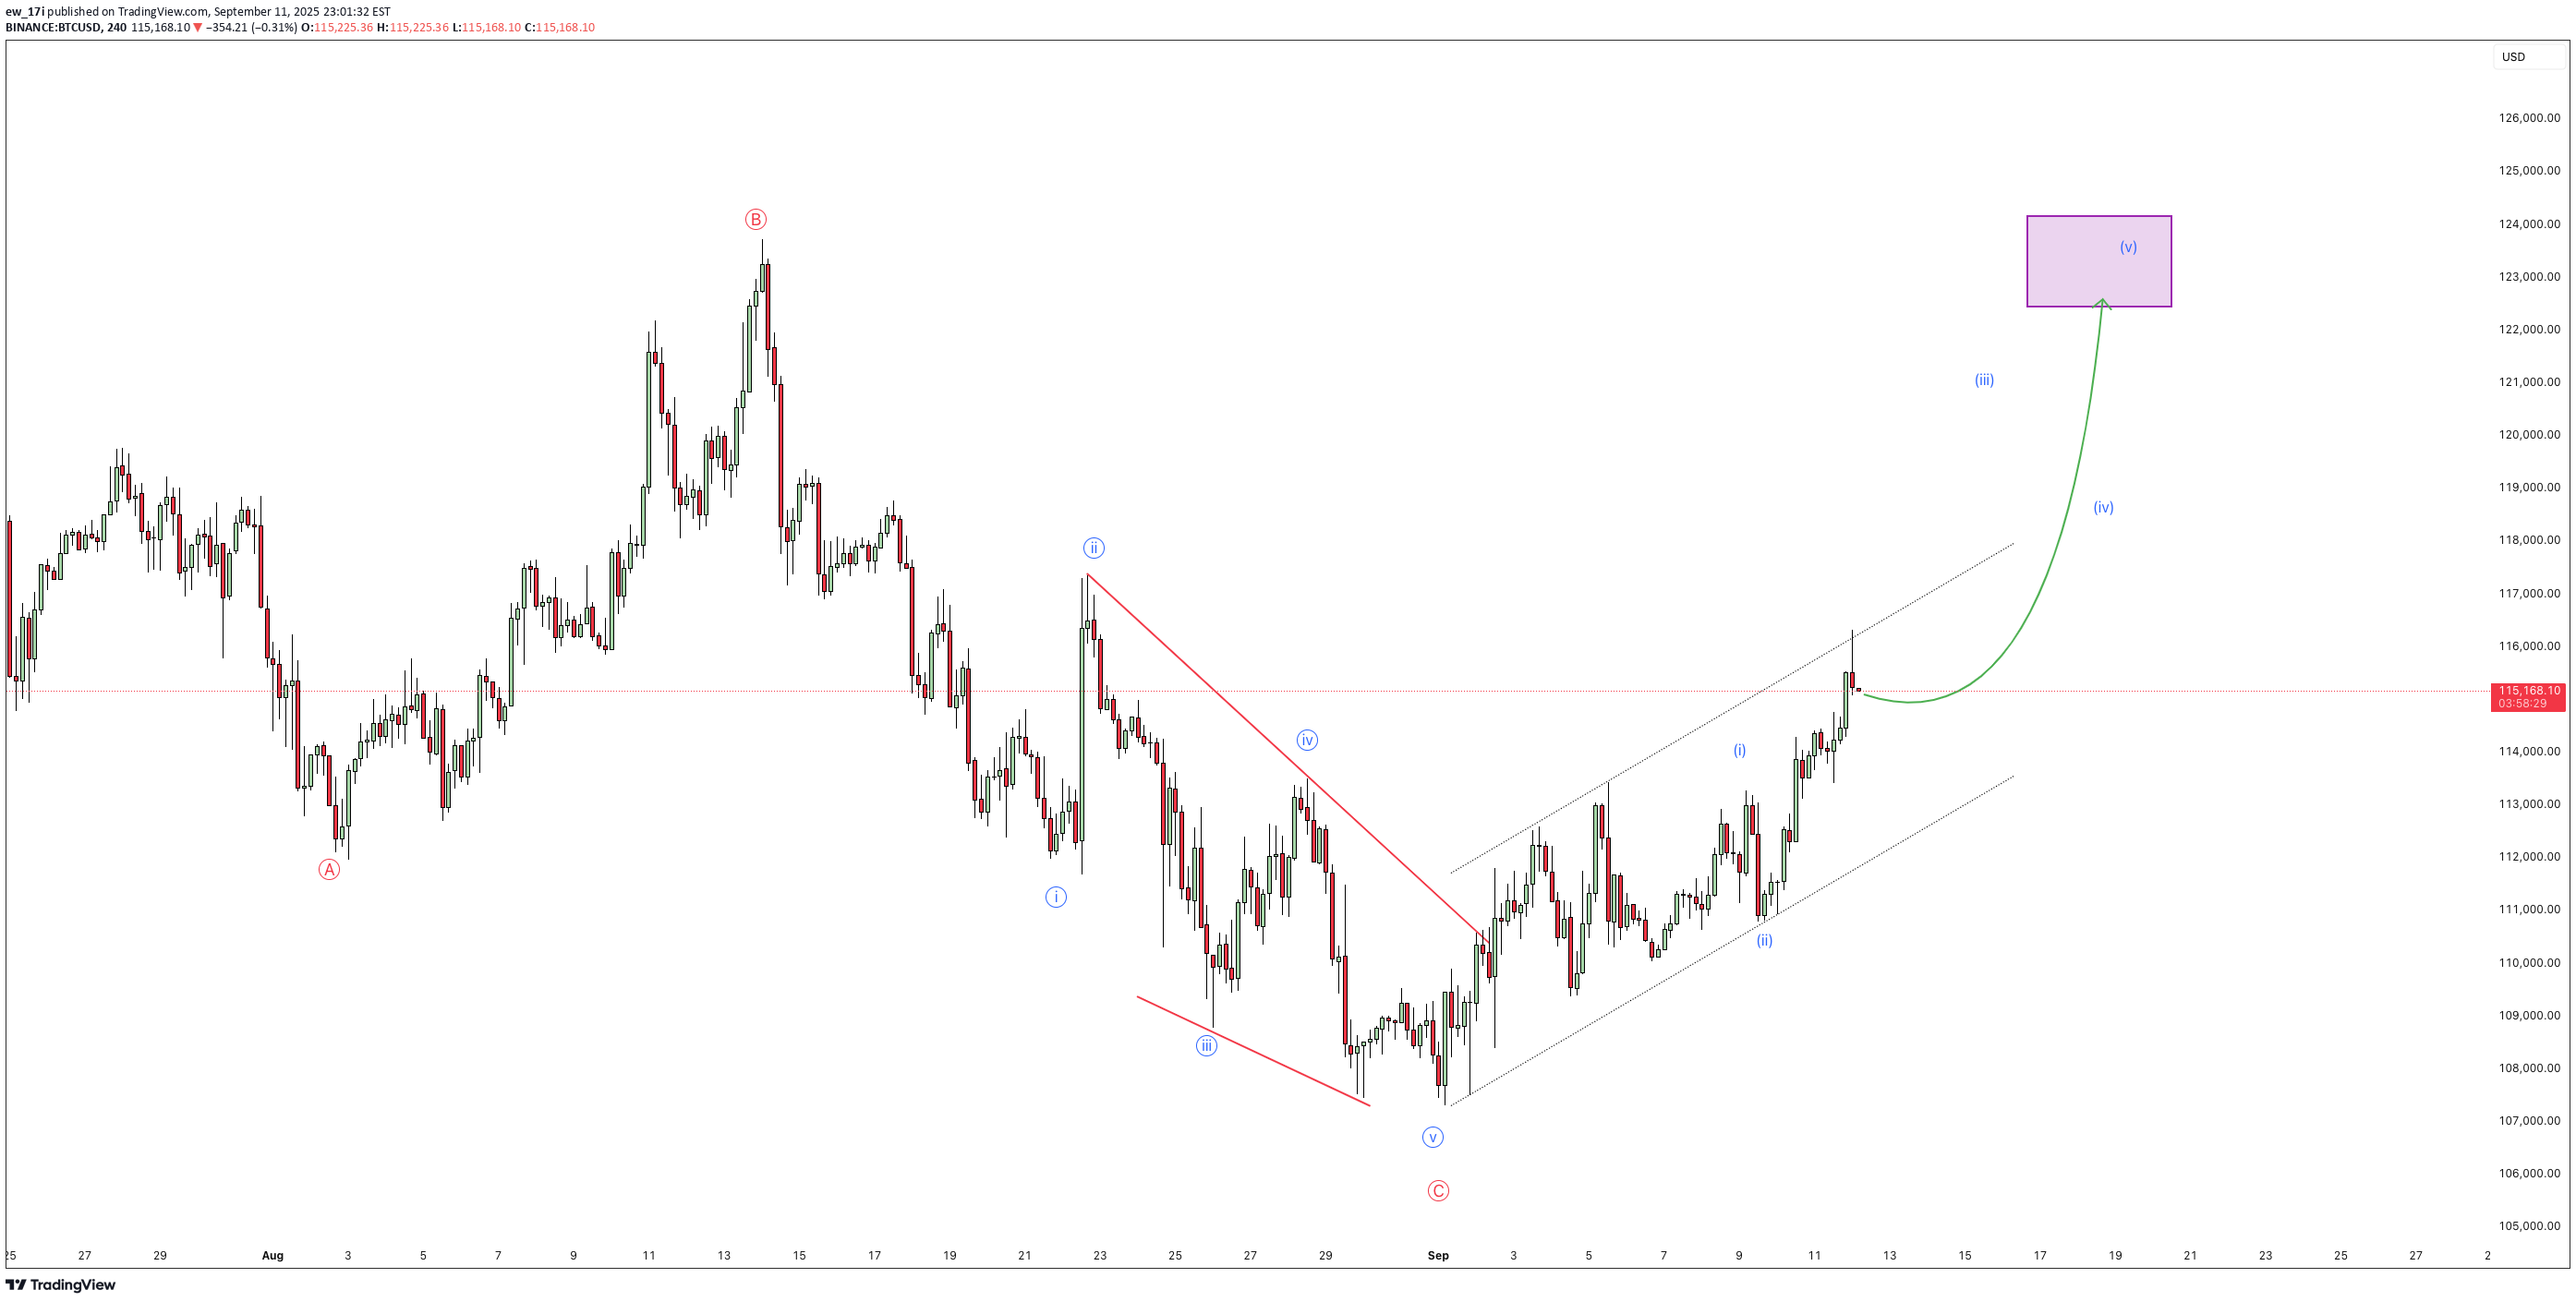
ew_17i
BTC
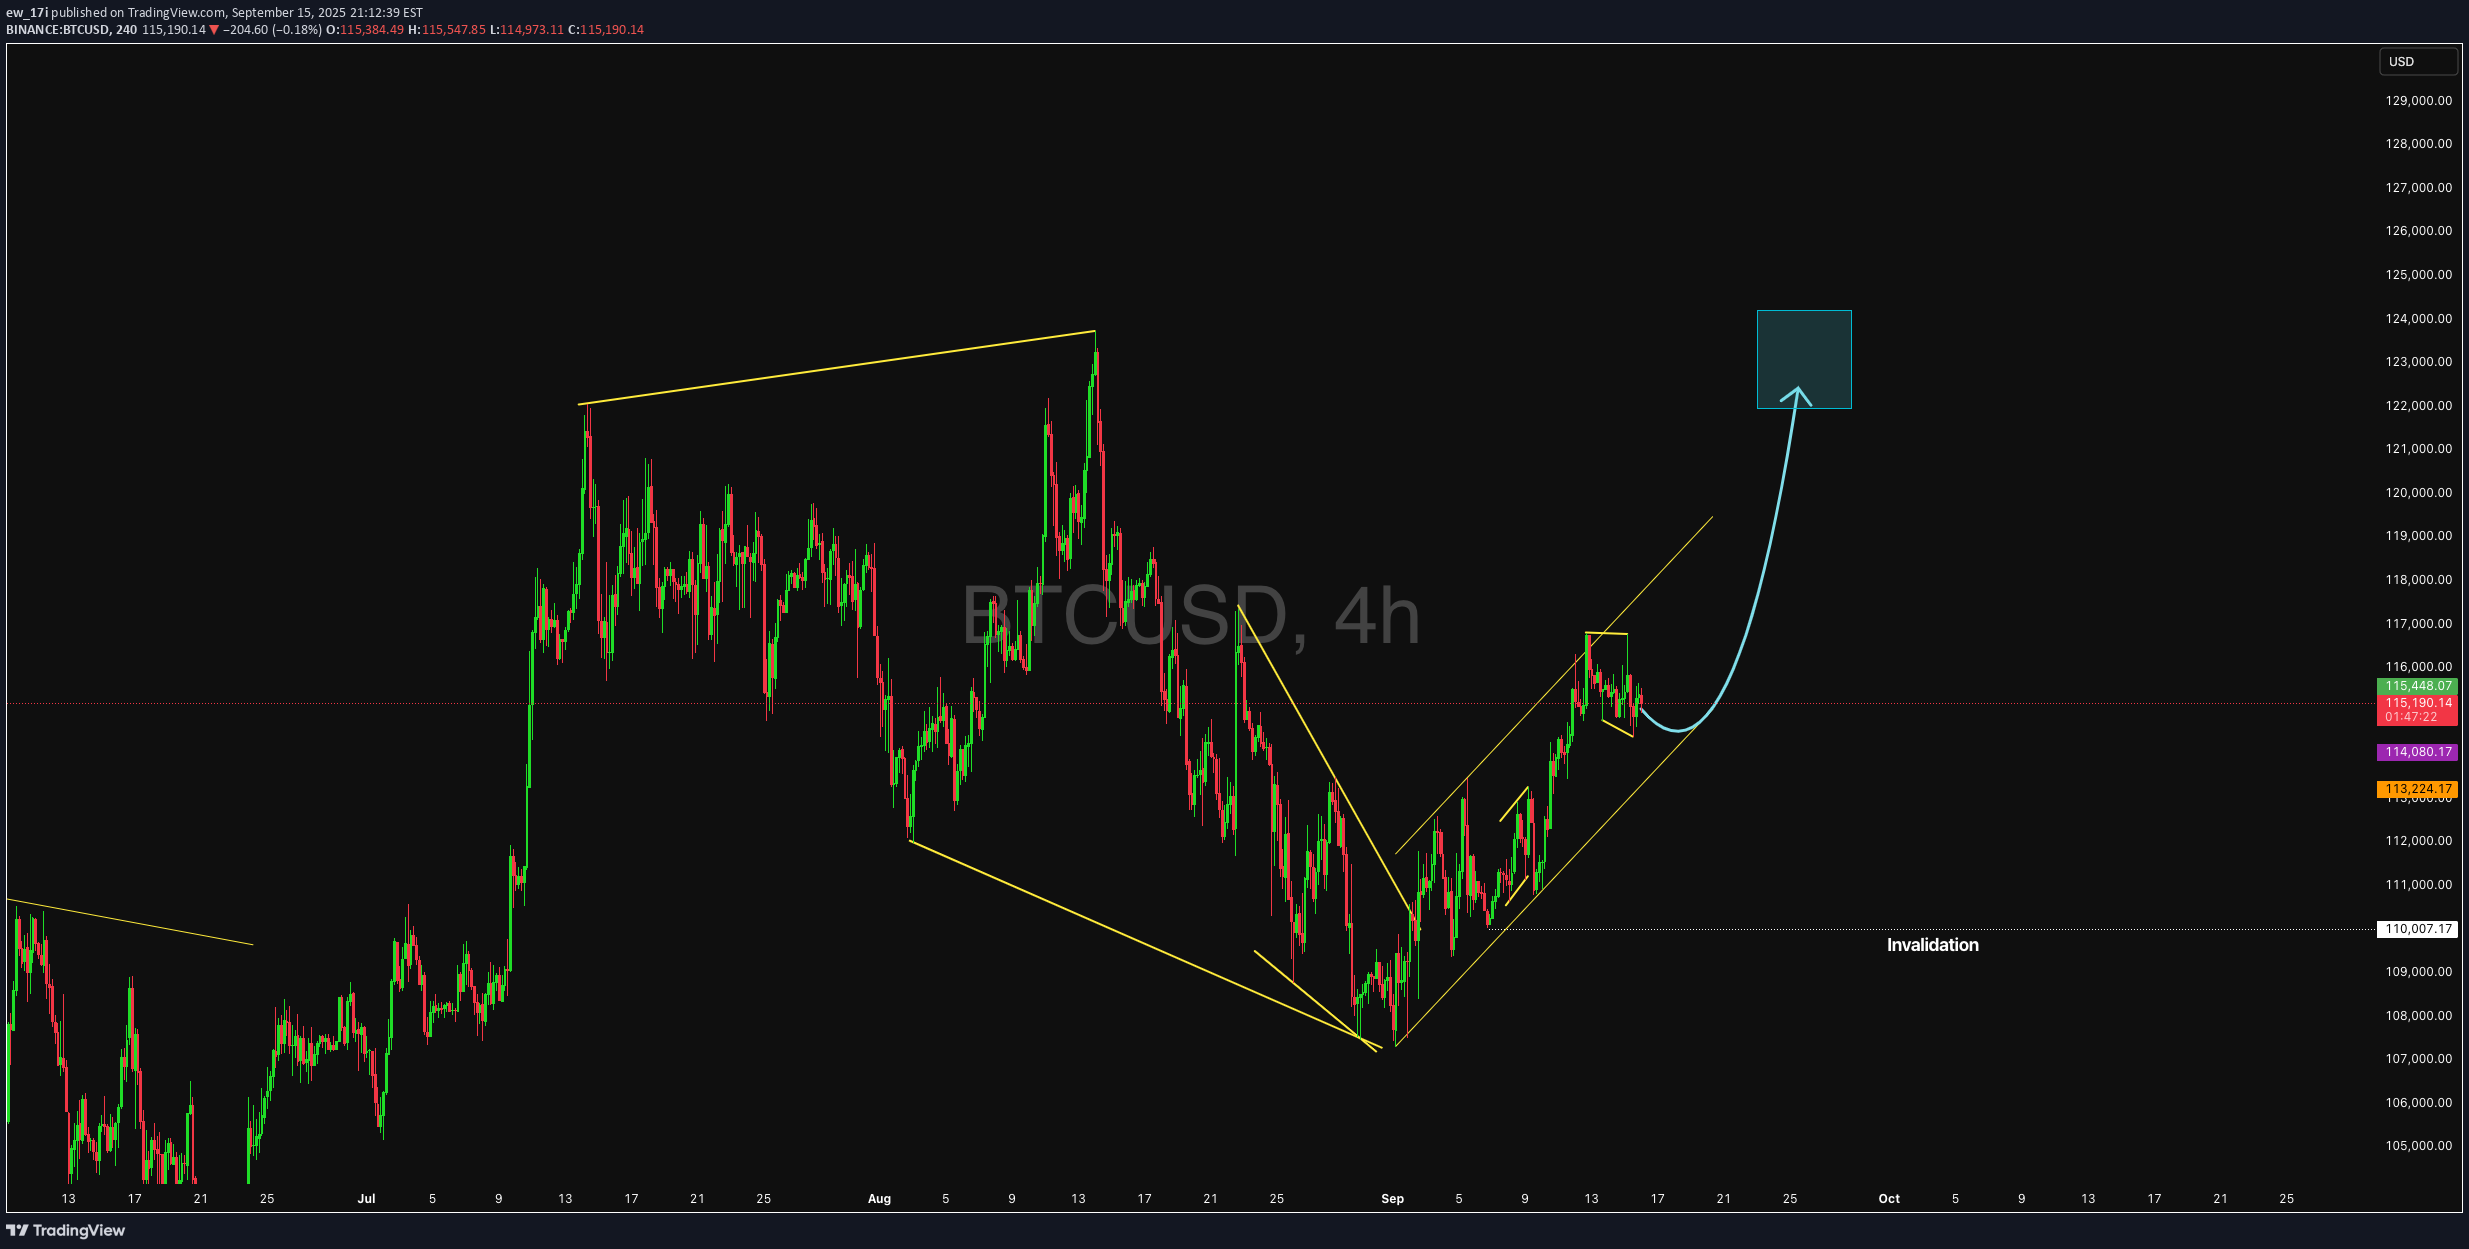
Today’s Elliott Wave outlook for BTCUSD suggests the market is respecting its current wave structure, with potential for further bullish continuation if key levels hold. Traders should monitor closely for confirmation.
ew_17i
BTC
Today’s Elliott Wave outlook for BTCUSD indicates that the pair is respecting its wave structure, with potential for further bullish continuation if key levels hold. Traders should follow the wave count for confirmation.
ew_17i
BTC
Today’s Elliott Wave outlook for Bitcoin points to the continuation of its current wave structure. Traders should track the wave count carefully and wait for confirmation before taking positions
Disclaimer
Any content and materials included in Sahmeto's website and official communication channels are a compilation of personal opinions and analyses and are not binding. They do not constitute any recommendation for buying, selling, entering or exiting the stock market and cryptocurrency market. Also, all news and analyses included in the website and channels are merely republished information from official and unofficial domestic and foreign sources, and it is obvious that users of the said content are responsible for following up and ensuring the authenticity and accuracy of the materials. Therefore, while disclaiming responsibility, it is declared that the responsibility for any decision-making, action, and potential profit and loss in the capital market and cryptocurrency market lies with the trader.