
eemani123
@t_eemani123

What symbols does the trader recommend buying?
Purchase History
پیام های تریدر
Filter
Signal Type
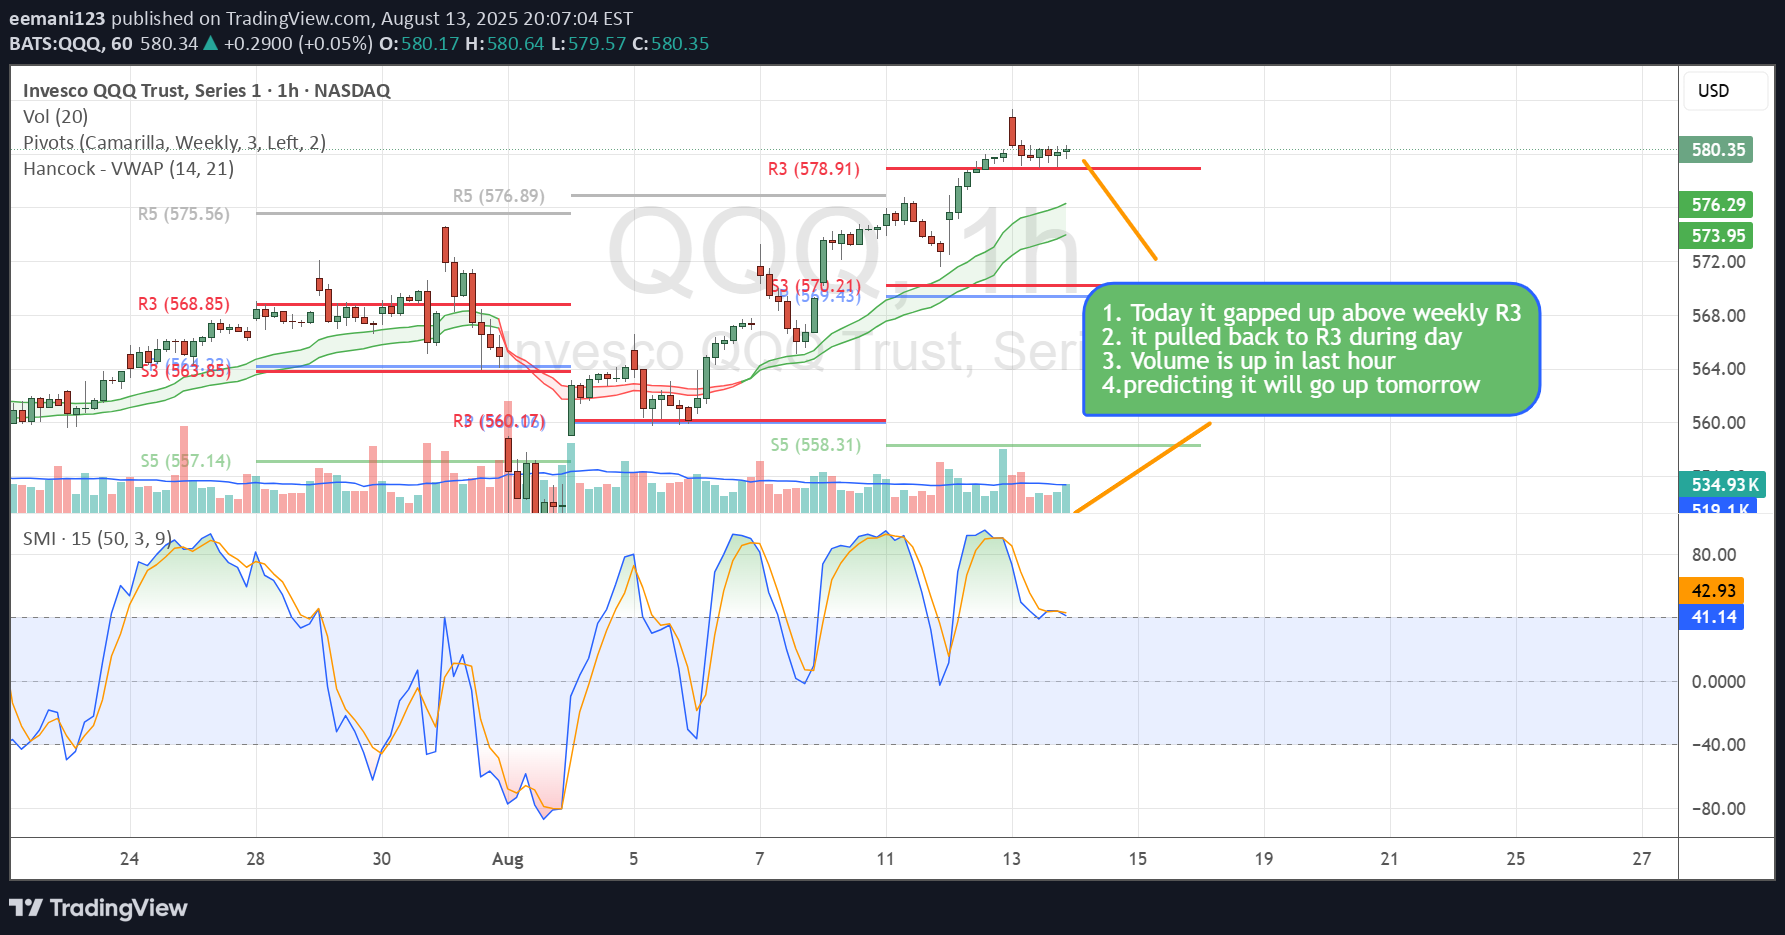
📈 QQQ Price Action Recap & Tomorrow’s Outlook 1. **QQQ opened with a gap above the weekly R3 pivot level**, signaling strong bullish momentum at the start of the day. 2. **It retraced intraday, testing R3 as support**, which held firmly through the session. 3. **R3 is now acting as a key support zone**, reinforcing the bullish bias. 4. **Volume picked up significantly in the final hour**, suggesting renewed buying interest. 5. **Based on current price action and momentum, I anticipate further upside tomorrow.** 📝 **Chart Notes:** - I'm using **Camarilla weekly pivot levels** for reference. - At the bottom of my chart, you'll find the **Stochastic Momentum Index**, which adds context to the trend strength and potential reversals. Warning: This idea is published for educational purposes only. Please do your research before taking any position.
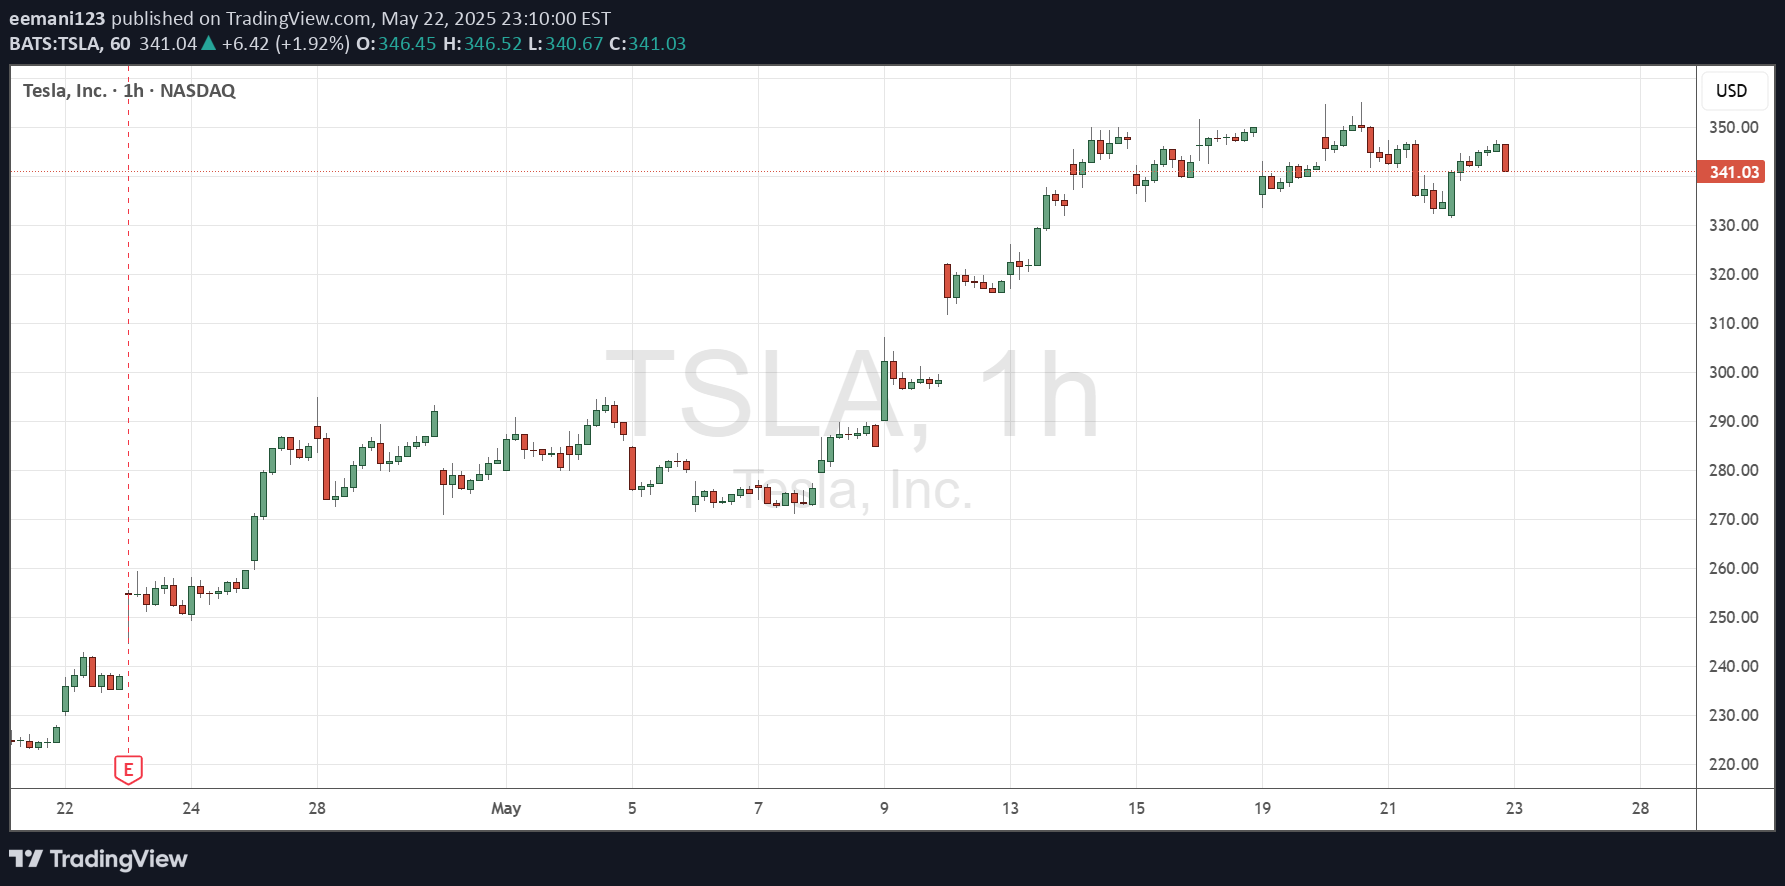
This strategy was generated with the help of ChatGPT. I used VWAP + Bollinger Bands for entry signals, then implemented a 10% trailing stop using Pine Script v5. It performed well on TSLA and SPY in 4HR charts, and I’ve shared all code + visuals in this full write-up: 👉 eemanispace.com/profitable-trading-strategy-chatgpt-tradingview
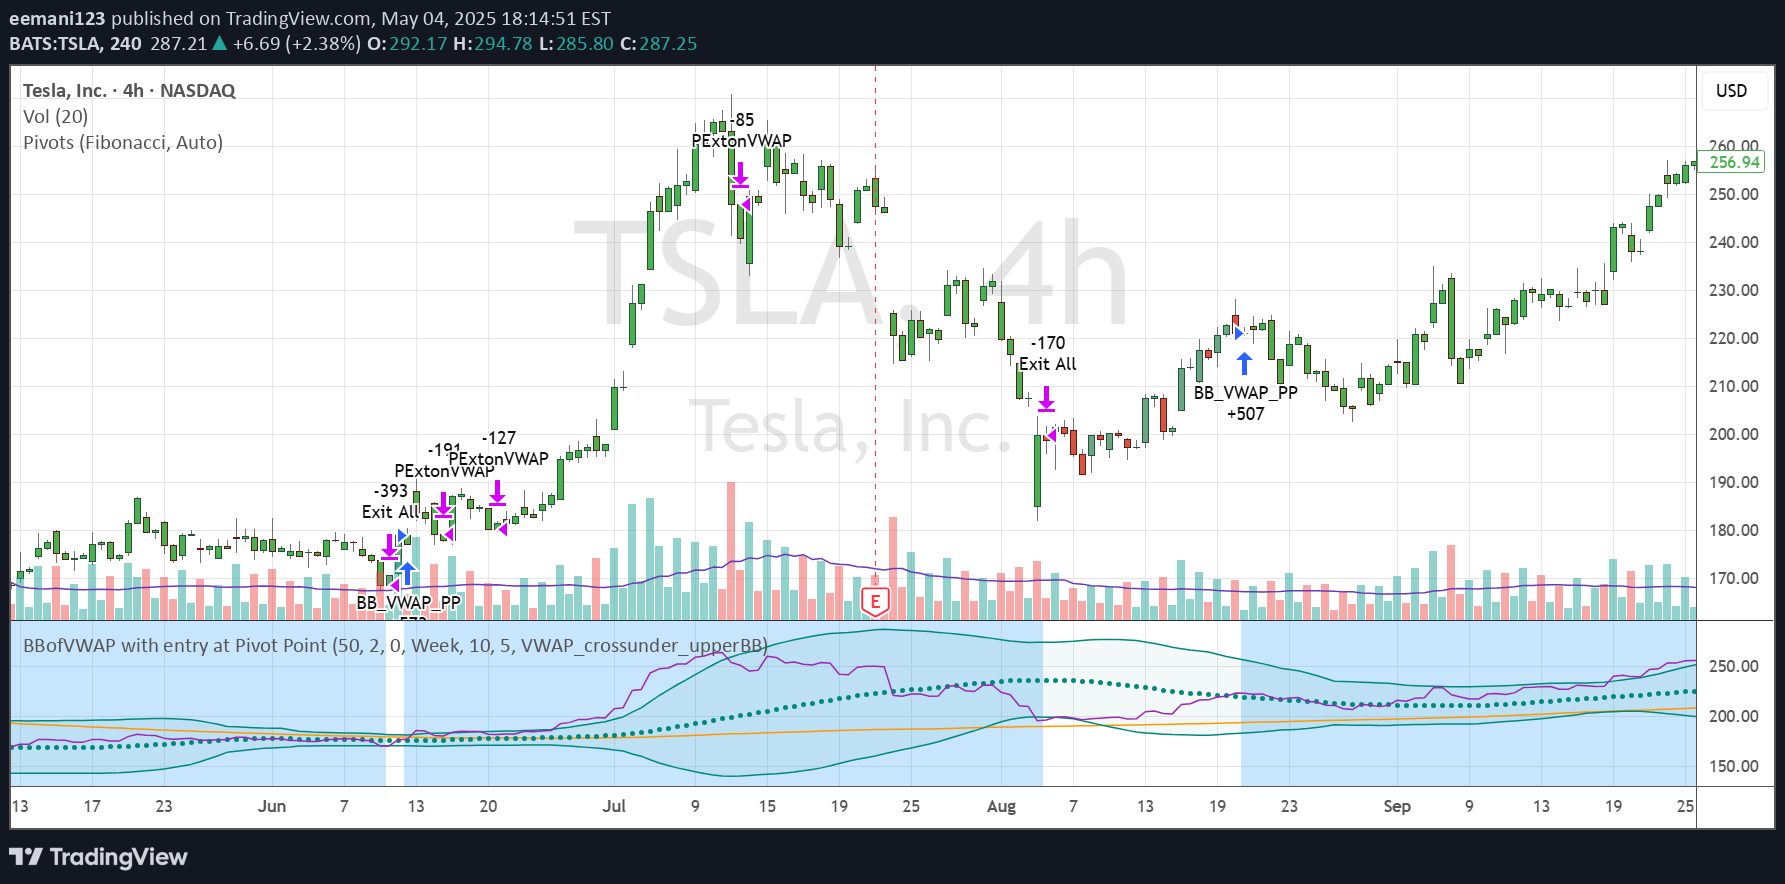
Tesla Inc. (TSLA) has been gaining strong momentum lately, and on the 4-hour chart, my BBofVWAP strategy has shown a notable signal. In this post, I’ll walk through how this custom strategy works and what the latest price action could mean for traders. 🔍 What is the BBofVWAP Strategy? The BBofVWAP (Bollinger Bands of VWAP) strategy I use combines two powerful tools: VWAP (Volume-Weighted Average Price) – to anchor the trade bias Bollinger Bands – to track volatility and determine key exit points Here’s how it works: ✅ Entry Point: When VWAP crosses above the Pivot Point and stays within the Bollinger Bands. 💡 Exit Condition: VWAP crossing below the lower Bollinger Band signals an exit. 💰 Profit Booking: Partial profits are taken near R3 resistance level Or when the price drops below the upper Bollinger Band This method filters out noise and rides trends effectively while maintaining solid risk management. 📊 Current TSLA Chart Insight (4h) In the current 4-hour setup: We entered the trade at a pivot breakout (highlighted with a blue arrow on the chart). VWAP continued to trade within the Bollinger Bands, keeping the position alive. Price has climbed toward $287.25 and is hovering near key resistance levels. R3 (328.92) acts as a potential profit-taking zone. If VWAP crosses under the lower band, we’ll be out – clean and disciplined. 📌 Why This Strategy Works 🎯 Clear rules-based system for entries and exits 📉 Eliminates emotional decision-making ⚖️ Balances trend-following with mean-reversion logic 🔁 Works well across large-cap, high-volume stocks like TSLA 🧠 Final Thoughts on TSLA Setup Tesla’s recent strength, combined with this BBofVWAP setup, gives a bullish but cautiously managed outlook. As always, managing risk with technical levels like VWAP, Pivot Points, and Bollinger Bands provides a more structured approach to volatile tickers.
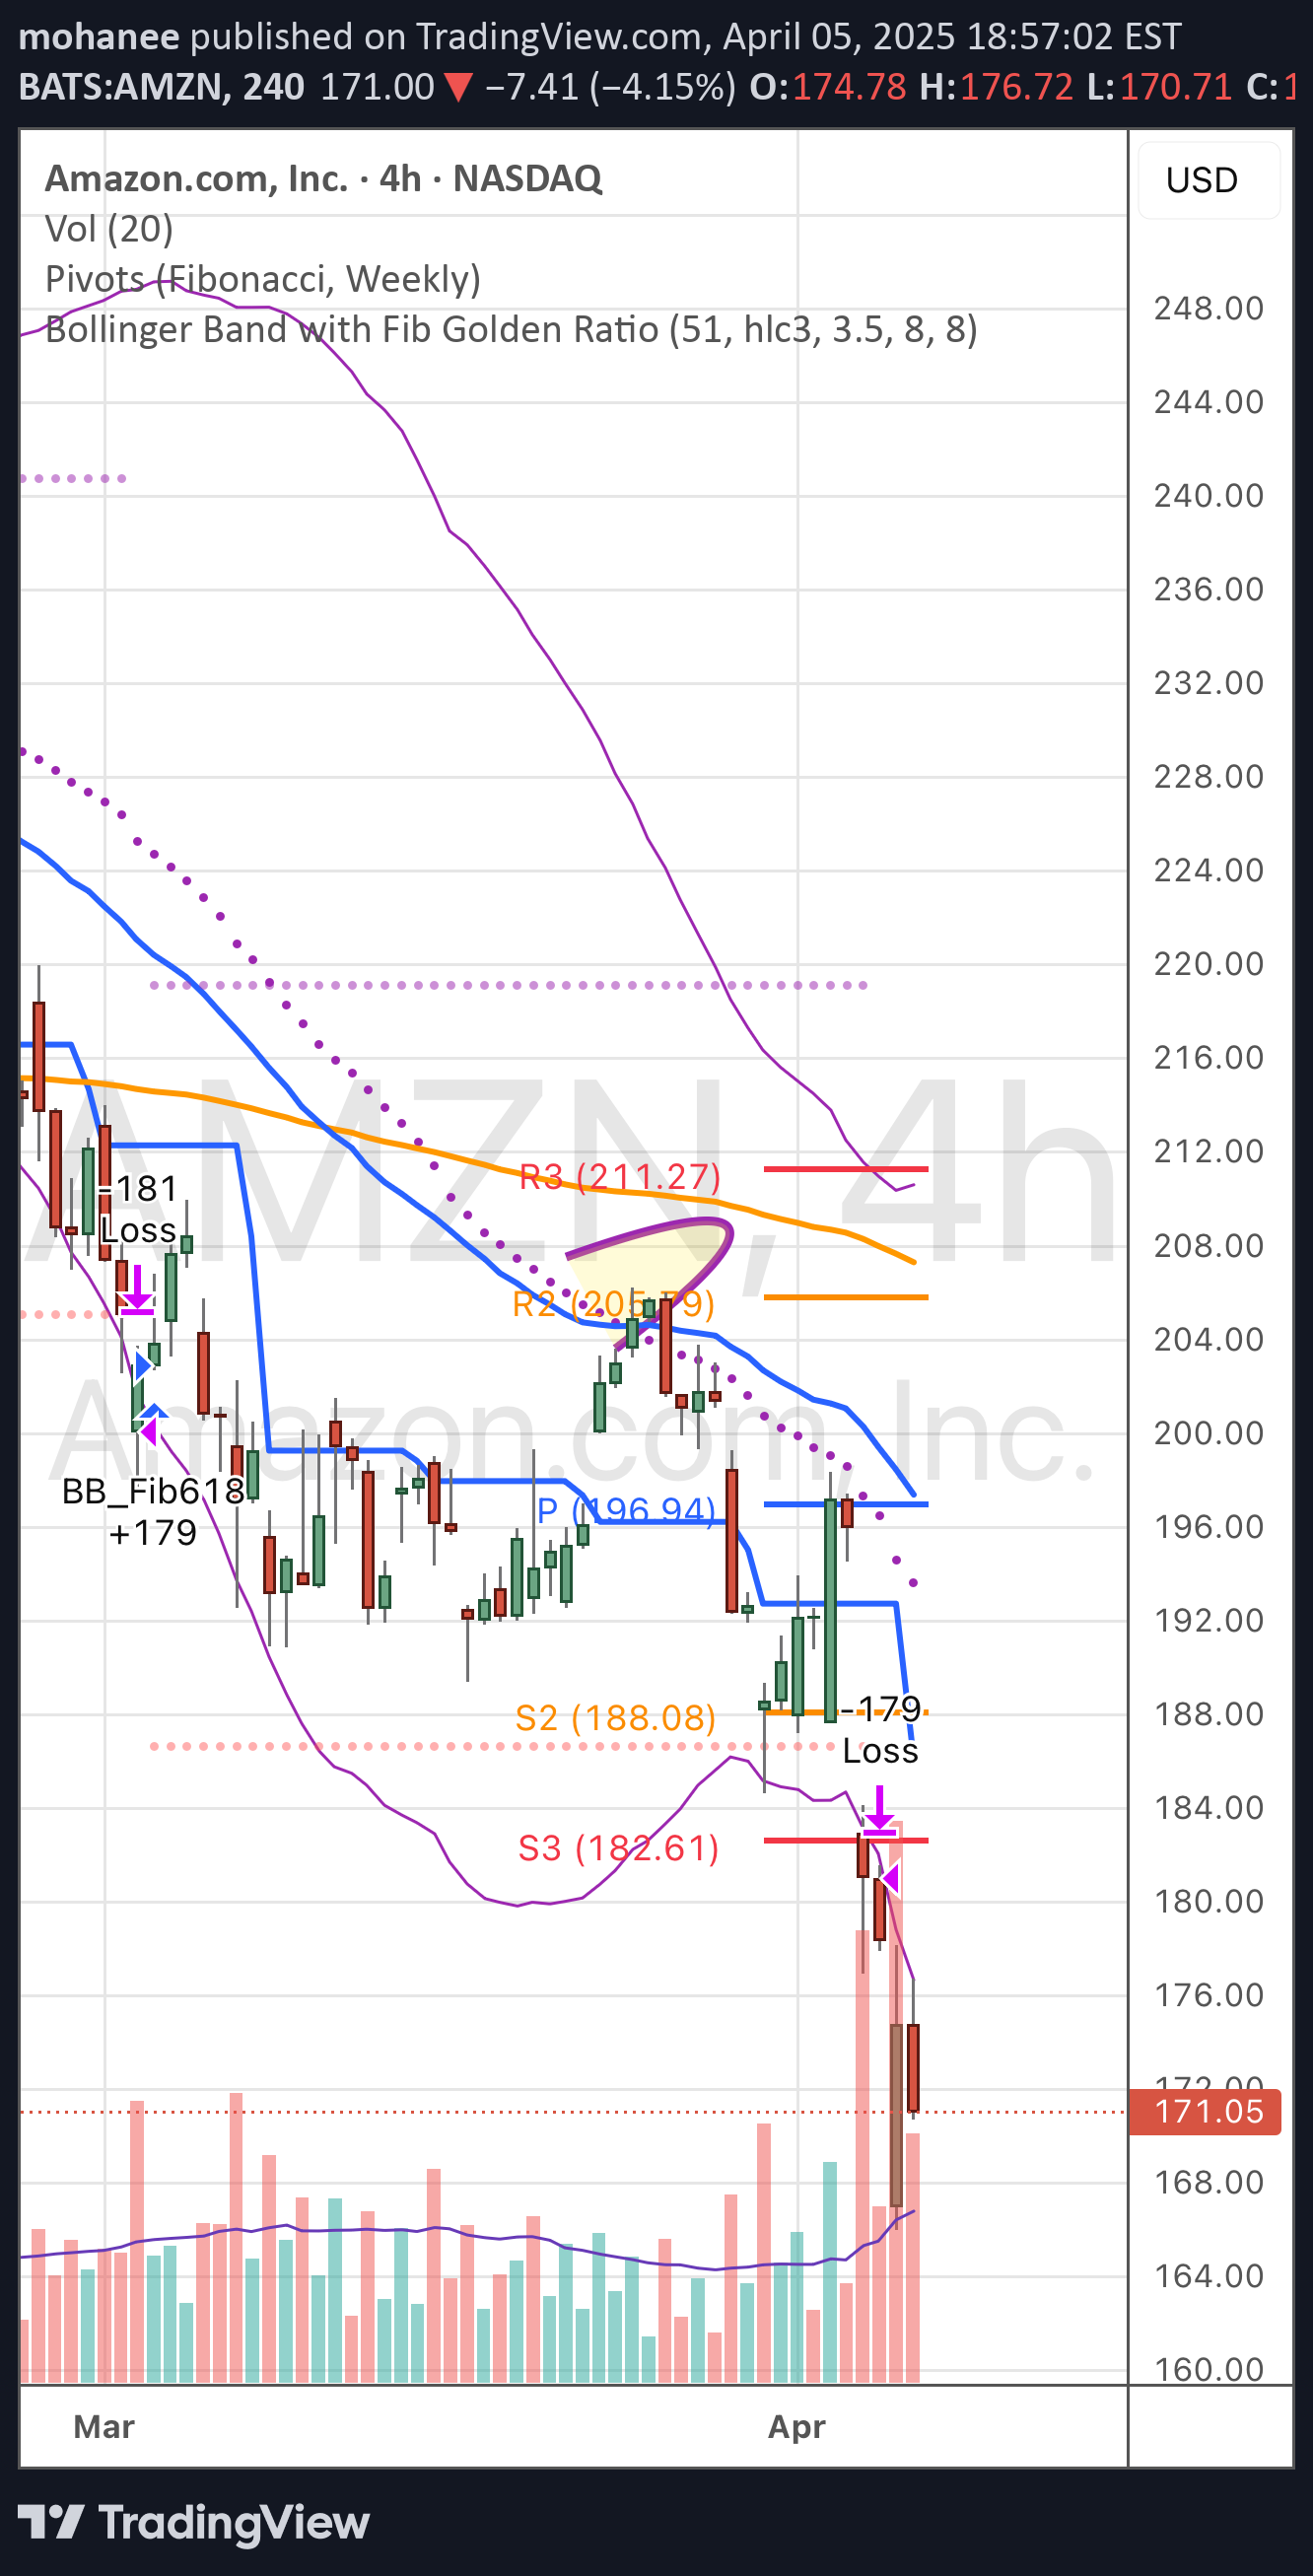
Analysis on 4H Chart (April 2025) Amazon (AMZN) experienced a sharp sell-off, currently trading at $171.05, down -7.41% on the session. This 4H chart shows a significant bearish movement, and there are clear signs of trend continuation if key support zones don’t hold. •Current Price: $171.05 •Weekly Pivot S3: $182.61 (Broken convincingly) •Next Major Support: Psychological level around $165, and volume profile shows thinning in that region — potential for rapid drop if $170 fails. •Resistance Levels: •R1: $196.94 (Pivot) •R2: $205.79 •R3: $211.27 (Aligns with previous highs) Volume Profile: •Sharp increase in bearish volume on the breakdown – confirms strong selling pressure. •Price has breached the lower Bollinger Band decisively — could mean oversold in the short term. Trade Ideas Short-Term Bearish Continuation •Entry: Below $170 on a retest and rejection. •Target: $165 (1st target), $160 (2nd target). •Stop: Above $175 Happy trading
Disclaimer
Any content and materials included in Sahmeto's website and official communication channels are a compilation of personal opinions and analyses and are not binding. They do not constitute any recommendation for buying, selling, entering or exiting the stock market and cryptocurrency market. Also, all news and analyses included in the website and channels are merely republished information from official and unofficial domestic and foreign sources, and it is obvious that users of the said content are responsible for following up and ensuring the authenticity and accuracy of the materials. Therefore, while disclaiming responsibility, it is declared that the responsibility for any decision-making, action, and potential profit and loss in the capital market and cryptocurrency market lies with the trader.