Technical analysis by eemani123 about Symbol AMZNX: Sell recommendation (4/5/2025)

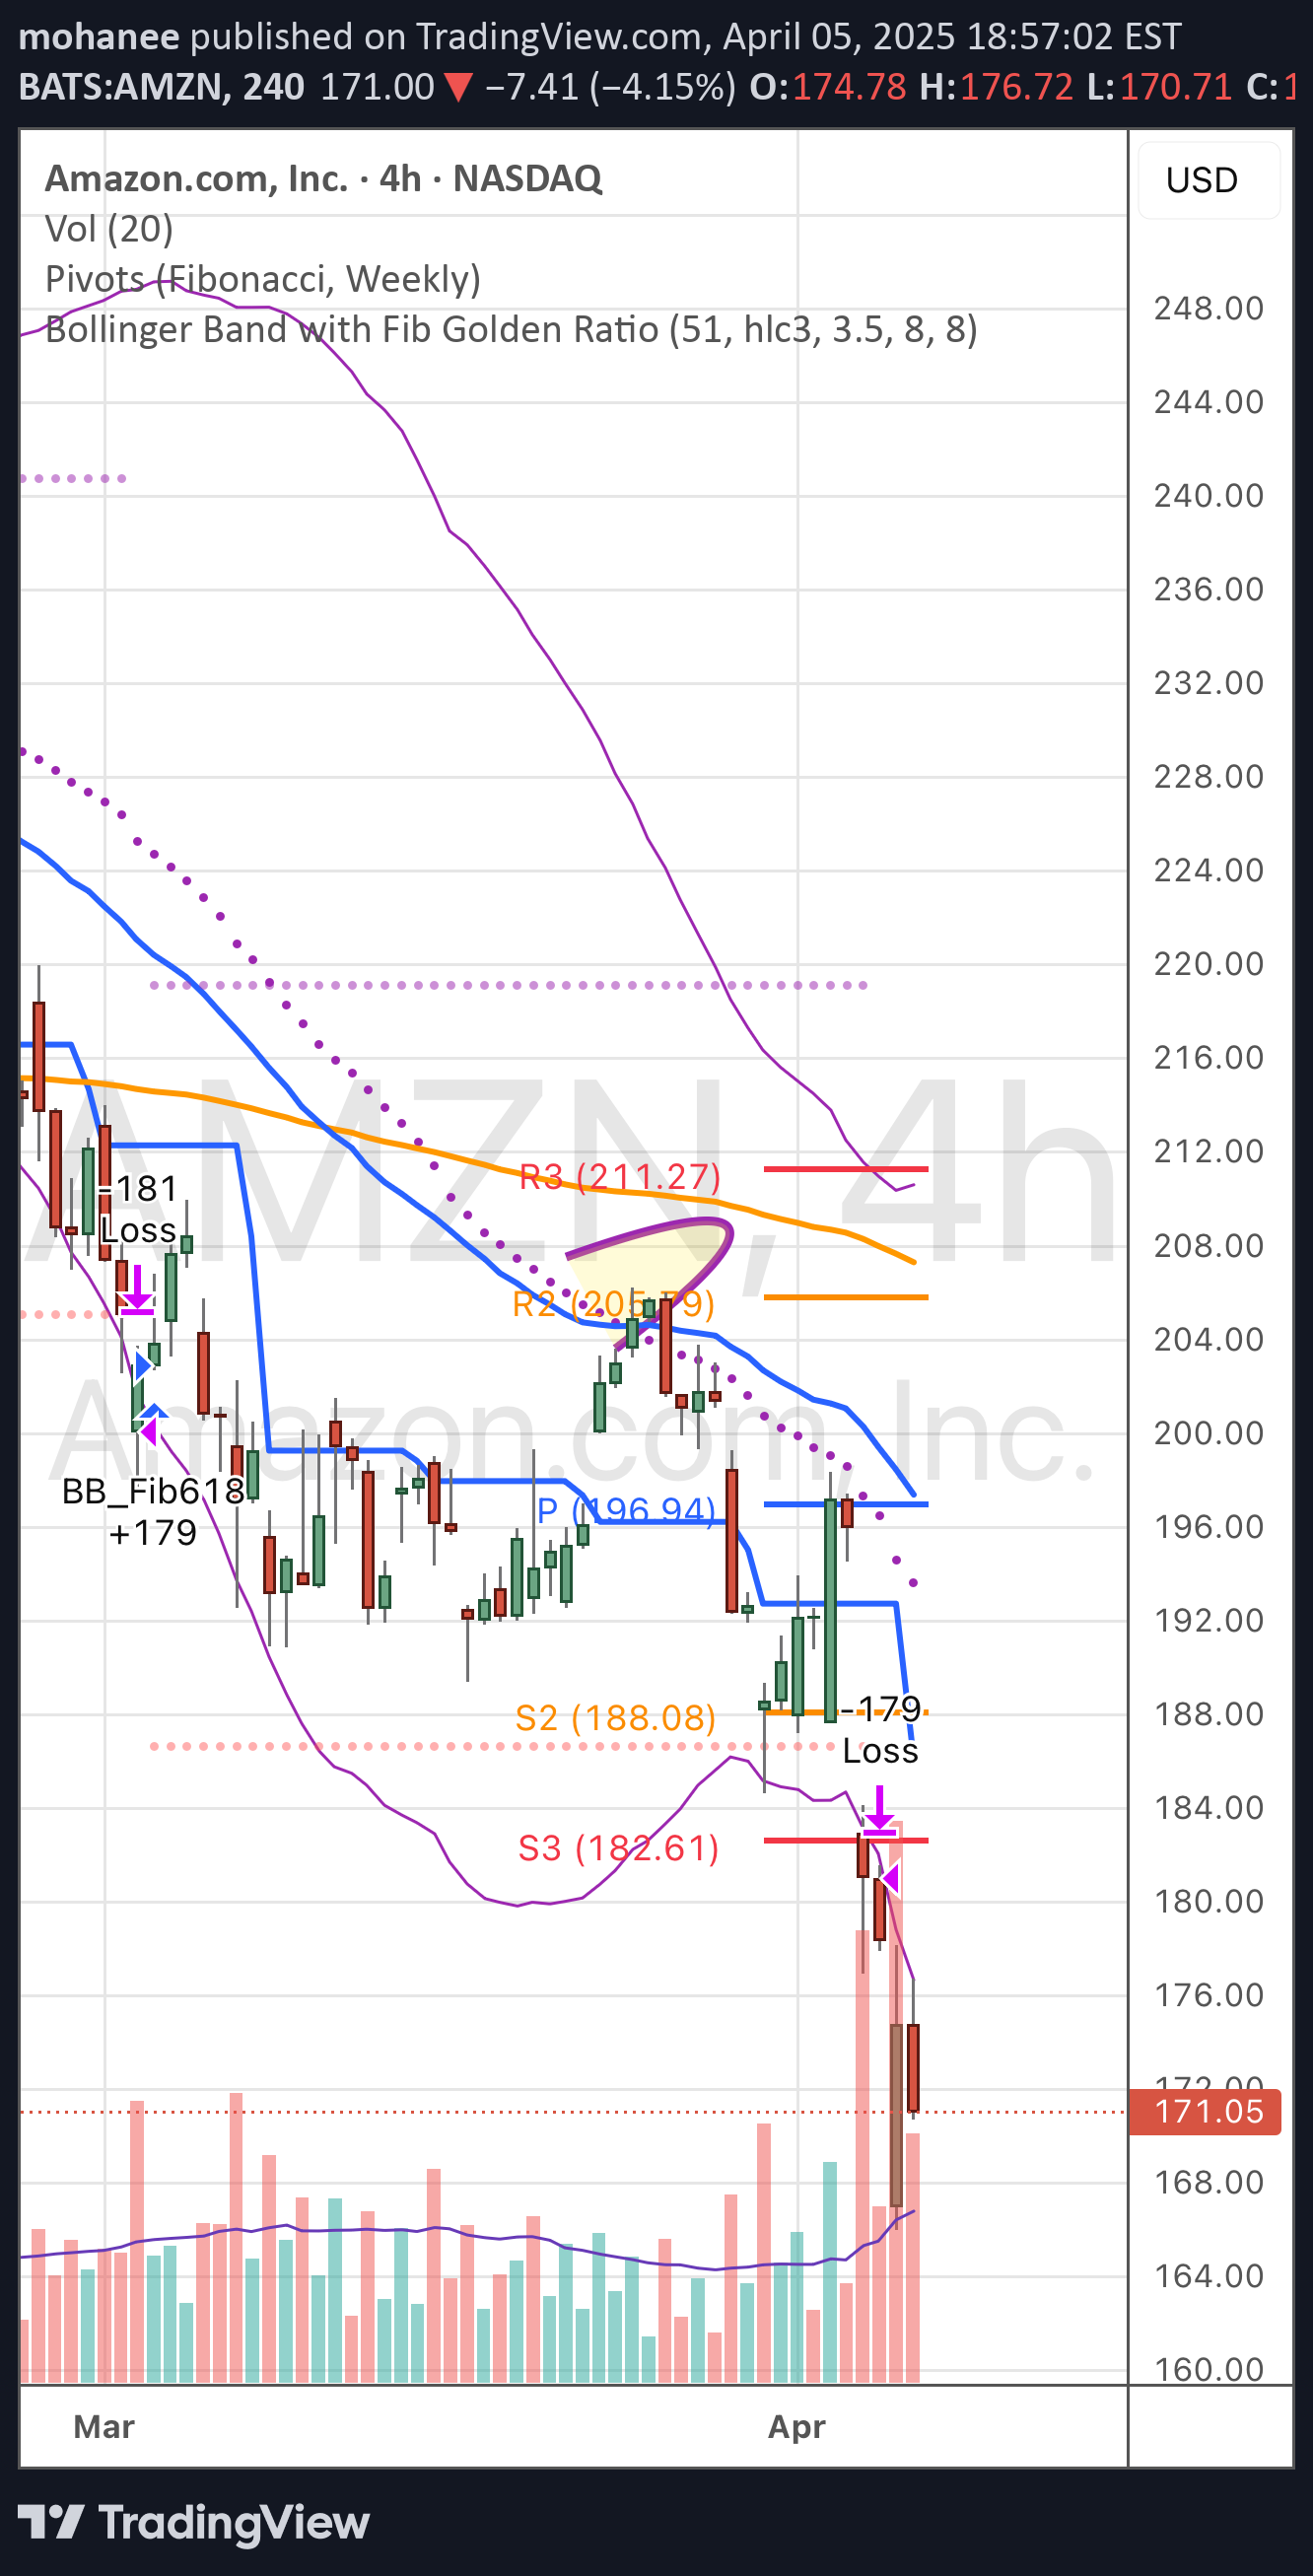
Analysis on 4H Chart (April 2025) Amazon (AMZN) experienced a sharp sell-off, currently trading at $171.05, down -7.41% on the session. This 4H chart shows a significant bearish movement, and there are clear signs of trend continuation if key support zones don’t hold. •Current Price: $171.05 •Weekly Pivot S3: $182.61 (Broken convincingly) •Next Major Support: Psychological level around $165, and volume profile shows thinning in that region — potential for rapid drop if $170 fails. •Resistance Levels: •R1: $196.94 (Pivot) •R2: $205.79 •R3: $211.27 (Aligns with previous highs) Volume Profile: •Sharp increase in bearish volume on the breakdown – confirms strong selling pressure. •Price has breached the lower Bollinger Band decisively — could mean oversold in the short term. Trade Ideas Short-Term Bearish Continuation •Entry: Below $170 on a retest and rejection. •Target: $165 (1st target), $160 (2nd target). •Stop: Above $175 Happy trading
