
ecobyg1
@t_ecobyg1

What symbols does the trader recommend buying?
Purchase History
پیام های تریدر
Filter
تحلیل روزانه بیت کوین: آیا بیت کوین در آستانه صعود است یا اصلاح؟ (سطوح کلیدی 93K و 91K)
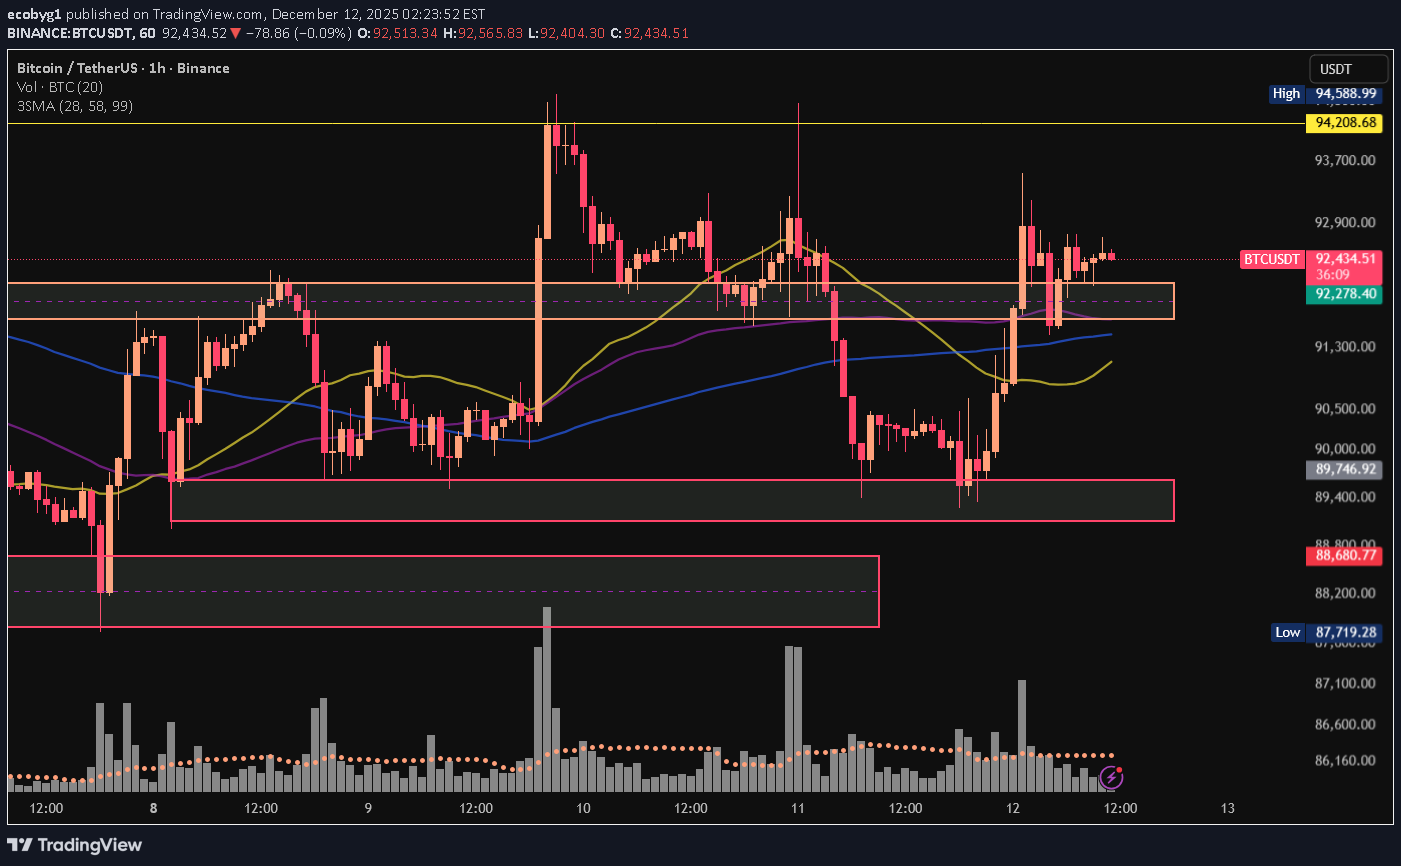
Welcome to My Analysis. Now, let’s break down today’s Bitcoin structure. Bitcoin is ranging with a weak bullish tilt a higher low has formed, but the highs still haven’t broken. The market is breathing before its next decision. Let’s break it down. Market Structure: Range-Bound with a Weak Bullish Bias Why? A new Higher Low has formed compared to the 89.7K bottom. But the highs are still unbroken, meaning a strong trend hasn’t emerged yet. The market is mostly in a breathing phase before making its next decision. Current Price Position Price is trading exactly inside a key zone: 92,100 – 92,300 This zone has recently flipped into support (S/R Flip). Multiple bounces from this region confirm its importance. Price is currently above SMA 28 and SMA 58, → indicating a short-term positive momentum. But it remains below SMA 99, → meaning the medium-term trend is still neutral to weak. Volume Conditions Strong buy volume at the bottom of the range shows solid demand. But during upward moves, volume decreases → the bullish momentum is still weak. To break through 92.9K, a volume spike is required. Overall View The market is moving inside a short-term range, with a weak but existing bullish bias, though not confirmed yet. Key Levels Break above 93K → bullish continuation Break below 91K → deeper correction Main supports remain: 89.7K The strong lower zone 88.8K – 88.3K ⚠️ Risk Alert ⚠️ Futures are not beginner-friendly. These triggers require solid experience. Before using them, study risk management and practice with the learning content here.
تحلیل بیت کوین امروز: فشار فروش ادامه دارد! آیا کف قیمتی جدید در راه است؟
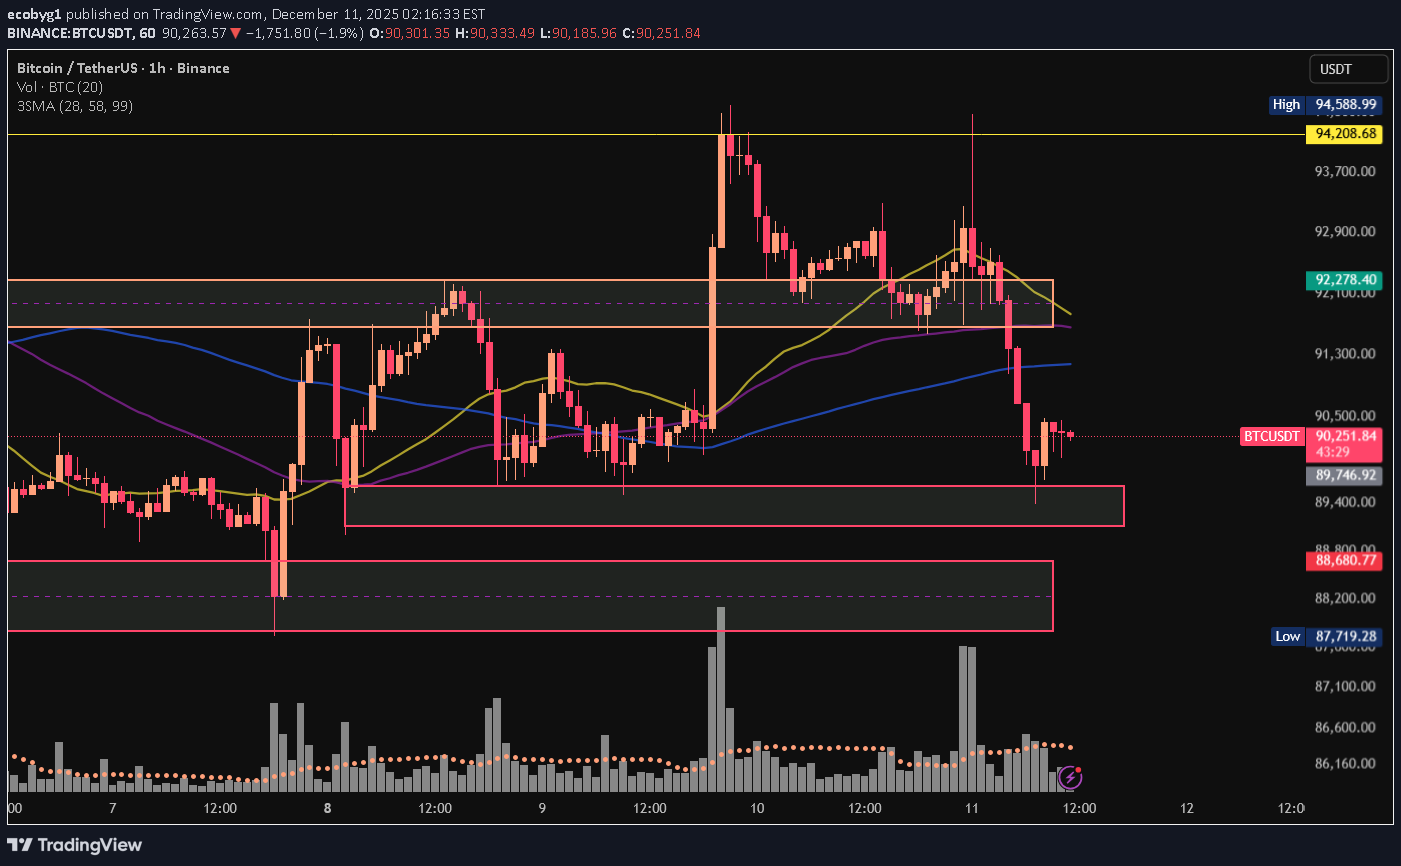
Welcome to My Analysis. Bitcoin just printed another lower high and slipped under key moving averages — the short-term structure is still bearish. Let’s break down what the charts are actually saying. Market Structure Overview Overall Market Structure The short-term market structure remains bearish. Why? Lower Highs formed at 92,800 → 92,300, along with moving-average breakdowns. Lower Lows formed around 90,000, with a lower shadow reaching ~89,400. After a strong sell-off, price has entered a small consolidation range, meaning the market is pausing after the drop. Current Price Position Price is sitting between two key support zones: Support Zone 1: 89,750 – 90,000 Major Support Zone 2: 88,700 – 88,200 Price bounced from the top of the first support zone, but there is no sign of a sustained reversal yet. A key point: After the strong decline, price fell below the 50 and 100 MAs and has failed to reclaim them. This confirms sellers still have more control. ➤ Sellers The drop from 92,200 came with large bearish candles and strong volume → clear selling pressure. The recent crash candle had a long lower wick (some buying), but the bounce candle had significantly lower volume than the sell candles. ➤ Buyers Buyers defended the 89,700 level (long lower wicks). But the bounce was weak and lacked conviction. Buyers are only holding the floor, not reversing the trend. 📌 Conclusion: Sellers currently have the upper hand; buyers are only defending, not attacking. RSI (1H) RSI has entered or approached the oversold area. However, its upward reaction is weak. This means: Selling pressure has slowed (RSI rising slightly), But there is no strength in the reversal (RSI still below mid-range, weak angle). 📌 Interpretation: Expect range-bound movement or compression, not a fast bullish reversal. ✅ Final Summary 🔻 Current Trend: Short-Term Bearish As long as price remains below 91,300, and especially below 92,000, sellers stay in control. 🔸 Support Levels First support: 89,700 Major support: 88,700 – 88,200 A breakdown → increases the probability of a sell-off toward 87,700. 🔸 Neutrality Trigger A close back above 91,300 – 91,500 returns the market to a neutral state. 🔸 Bullish Trend Trigger For a real shift to bullish structure → Bitcoin must reclaim 92,300. ⚠️ Risk Alert ⚠️ Futures are not beginner-friendly. These triggers require solid experience. Before using them, study risk management and practice with the learning content here.
EcoByG Bitcoin Daily Analysis #7 — Daily BTC Market Update

Welcome to My Analysis. Now, let’s break down today’s Bitcoin structure. Bitcoin is currently forming a range structure with a slight bullish bias. After a strong upside spike, price has entered a compression phase, where candles are getting smaller and volume is dropping as the market “digests” the move. The alignment of the moving averages shows that the market is slowly shifting out of indecision and leaning toward a mild bullish tendency. Right now, price is trading exactly on the Equilibrium Zone following the major impulse move. After being rejected from the 94K ceiling, Bitcoin is now testing whether it can break away from equilibrium and form a second bullish leg — or not. Buyers vs. Sellers Buyers After the big upward spike, buying volume was clearly dominant in the bullish candles. We still see soft defense around the 92,000 level. Price holding above all three moving averages → buyers maintain light control. Sellers Strong selling pressure appeared at 93,200 – 93,700. Upper wicks show sellers are preventing an easy breakout above this zone. Overall: the market is balanced but slightly tilted toward buyers. RSI RSI is currently neither overbought nor oversold. This means: The market hasn’t chosen a clear direction yet. The momentum from the previous bullish spike hasn’t fully faded. But there isn’t enough energy for a strong breakout either. In simple terms: RSI says the market is in “waiting mode.” Final Conclusion The market is currently in: “Range with Bullish Bias” Bullish scenario If Bitcoin stays above 92,000 → Next targets: 93,700, and if that breaks → 94,580. Bearish scenario If the 92,000 support breaks → Correction toward 91,450 is likely. Breaking that → a deeper move back toward the heavy zone 89,800 – 88,700. Dominant Scenario A second bullish wave is possible if price stabilizes above 92,000, but the market has not yet gathered enough energy to break major resistances. ⚠️ Important Note: The Federal Reserve has a meeting today and will announce the interest rate decision. Trade cautiously — volatility may increase. ⚠️ Risk Alert ⚠️ Futures are not beginner-friendly. These triggers require solid experience. Before using them, study risk management and practice with the learning content here.
EcoByG Bitcoin Daily Analysis #6 — Daily BTC Market Update

Welcome to My Analysis. Now, let’s break down today’s Bitcoin structure. Bitcoin attempted once again to break through the liquidity zone at 91,800–92,300, but since buyers showed no demand in that area, price was rejected again and returned back into the equilibrium zone. Here, the moving averages have tangled back together, showing indecision. The moving average values are: 28, 58, and 99. The RSI shows that there is still no meaningful momentum entering the market — meaning Bitcoin hasn’t picked a direction yet. This suggests the market needs more time before participants decide whether to put serious money in or not. Most traders prefer to stay patient for now. For short setups, the earliest possible level is around 89,000, but for long setups, we still don’t have proper confirmation above 92,300. Taking a long here would be unsafe and risky, and it’s better to give the market more time. Trading volume is still balanced between buyers and sellers, which means the market remains in equilibrium. ⚠️ Risk Alert ⚠️ Futures are not beginner-friendly. These triggers require solid experience. Before using them, study risk management and practice with the learning content here.
EcoByG Bitcoin Daily Analysis #5 — Daily BTC Market Update

Welcome to My Analysis. Now, let’s break down today’s Bitcoin structure. Bitcoin isn’t bullish yet — it’s just ranging inside a downtrend. And unless one level breaks, the market is preparing for another move down. Here’s the breakdown. Market Structure The primary trend is still bearish — price is trading below broken structures and several major resistances. The current move is mostly a corrective rally inside the downtrend, not the start of a new uptrend. Price action & candle behavior Price is currently oscillating inside a tight range between 89,800 and 93,700. The recent upward move is a correction wave inside the bearish structure. The last pullback bounced exactly off 88.7K support, and price is now heading back toward the range top. Volume There was a strong volume spike at the 88.7K bottom → indicating buyer entry. However, volume has declined during the recent rise, which shows the rally lacks full conviction. RSI RSI bounced from the range bottom (near 30). A small bullish divergence is visible. Still, RSI remains well below buyer power (below 70) → the upside is not yet fully confirmed. Final summary Overall structure: still bearish. We are inside a corrective range within a downtrend. 93,700 is the key level for either breakout or reversal. Until 93,700 is cleanly broken, the range continues and the probability of another drop back to 88.7K is high. Deeper supports: 84K → 82K. ⚠️ Risk Alert ⚠️ Futures are not beginner-friendly. These triggers require solid experience. Before using them, study risk management and practice with the learning content here.
تحلیل روزانه بیت کوین: آیا کف قیمتی دفاع میشود یا ریزش ادامه دارد؟

Welcome to My Analysis. Now, let’s break down today’s Bitcoin structure. On the daily timeframe, the structure remains clearly bearish. Price is still trading below broken structures and under several major resistance levels. After the strong drop, Bitcoin is now in a corrective phase within a downtrend. Price is currently ranging between the two key levels: 83,900 – 93,700 From a price-action perspective: Candles have formed a Lower High Price still does not have the strength to create a Higher High → This confirms ongoing weakness. A Demand Zone (red box) has formed around 83–84K, which caused the previous strong recovery. For now, price is trapped between the descending dynamic trendline and the 84K support. Volume — the most important factor for me Low volume at the bottom → indicates uncertainty and lack of decision-making No strong reversal volume yet → Buyers are not showing real commitment. What’s happening on the 1H timeframe? There are two major zones: 🔴 Supply Zone — 91,800 to 92,300 This is the top of the previous range Price entered it multiple times but got rejected Last entry → sellers immediately took control → drop to the low Key signal: Each time price enters this box, we see many upper wicks and rejections Volume does not increase → meaning no strong buyers attempting a breakout Result: Range and rejection 🟢 Demand Zone — 88,250 to 88,700 This zone has been extremely clean on the 1H: First touch → strong reaction + fast rebound Volume spiked exactly at the touch → showing real buyers Candles have strong lower wicks Price has revisited the zone several times without breaking it Key signal: As long as this zone holds, the short-term trend = bearish range with strong support. What does volume tell us? 🔸 Volume on the drops → high → Sellers were serious, intentional. 🔸 Volume during pullbacks → low → This confirms the move is corrective, buyer strength is weak, and continuation of the downtrend is more likely. 🔸 Volume increased inside the demand zone This is the most important signal of the entire chart: When price touched 88,300–88,700, a candle printed with above-average volume. → This confirms the demand zone has real buyer interest. 👈 So for now, this bottom is defendable. Current Market Structure Summary 🔵 Higher TF (Daily): Bearish 🟠 Mid TF (4H–1H): Bearish range 🟢 Low TF (1H): Range with slight bearish bias Meaning: Primary trend → Bearish Current structure → Range-bound Entry triggers → Breakout of the range Key Levels That Determine the Next Move If 88,250 breaks: Bearish continuation Target → 83,900 If 92,300 breaks: Range ends Structure shifts bullish on higher timeframes Targets : 93,700 100,565 ⚠️ Risk Alert ⚠️ Futures are not beginner-friendly. These triggers require solid experience. Before using them, study risk management and practice with the learning content here.
تحلیل روزانه بیت کوین: آیا بیت کوین آماده انفجار قیمتی است؟ (آمادگی برای حرکت بزرگ)

Hello and welcome to today’s Bitcoin daily update. I hope you’ve seen the previous analyses. Today I have good news—especially if you trade futures. Is Bitcoin preparing for a big move? In my opinion, yes. Bitcoin is currently forming a “range inside a range,” which is often a precursor to a major move. But so far, neither side has broken out. There are three very important points on the chart: 1) Bitcoin is inside a larger range Range Low: 84,600 – 85,300 Range High: 92,200 – 93,700 2) Inside this large range, a smaller range has formed This is exactly what we call a Range inside Range, and this setup usually appears before an explosive move. The small range is between: 89,600 – 90,600 91,800 – 92,200 This behavior shows energy build-up. Is the structure ready for a major move? Yes. Here’s why: ✔️ Deceleration of the downtrend In the recent selloffs, notice that the lows are not getting significantly lower → This is a deceleration pattern, signaling seller exhaustion. ✔️ Price is compressing under a key resistance When price starts to consolidate tightly right below a range resistance, we call it Compression — and it usually leads to a breakout move. ✔️ Price is far above the strong demand zone The strong demand zone at 82,500 – 81,400 is the same area that launched the market $10K upward the last time price touched it. Price is still well above this zone, which means: The major buyers haven’t surrendered control. ⚠️ Risk Alert ⚠️ Futures are not beginner-friendly. These triggers require solid experience. Before using them, study risk management and practice with the learning content here.
تحلیل روزانه بیت کوین: چرا ریزش به سمت 88 هزار دلار محتملتر است؟

Welcome to My Analysis. Now, let’s break down today’s Bitcoin structure. This chart now contains far more important signals than before—especially in terms of market structure, supply & demand zones, and the critical role of the 92–93K resistance. --- Overall Market Position Bitcoin is currently in a short-term bearish structure, and the origin of that weakness is very clear: 💥 The drop started precisely from the supply zone at 92,200–93,700. After multiple taps into this zone: Price failed to break out Selling volume increased Now price is moving right below this major supply area. --- Market Structure The pattern on the chart is clear: SFP of the high → consolidation → heavy drop → pullback → second drop → weak rebound Which means: A Lower Low (LL) has formed A Lower High (LH) has formed Short-term trend → Bearish We are at the exact stage where if price closes below the red zone, a new LH will be confirmed and the next drop becomes likely. --- RSI RSI is showing a bearish cross below its moving average, indicating that buyer momentum is weak. --- Final Summary Short-term structure is bearish Price is trading below the strong 92–93K resistance RSI is bearish with weak momentum Buyers are weak; sellers are regaining control Therefore: Turning bullish before a clean breakout above 94,000 is not logical. The probability of a drop toward 89,700 and 88,600 is higher than the probability of a rally. ⚠️ Risk Alert ⚠️ Futures are not beginner-friendly. These triggers require solid experience. Before using them, study risk management and practice with the learning content here.
تحلیل روزانه بیت کوین (BTC): آیا ۹۶ هزار دلار سد راه صعود است؟

Welcome to My Analysis. Now, let’s break down today’s Bitcoin structure. We can clearly see that Bitcoin has risen from the accumulation zone at 84K, moved up toward the 93K level, and is currently stuck there. The 93K–96K area is the liquidity zone for sellers, which makes it a difficult region to break through. To push past this level, Bitcoin either needs a whale-driven move, or we need to see stronger volume inflows. From a broader perspective, the current range is between 84K and 94K. For a confirmed breakout and to say that the market structure has turned bullish. we need Bitcoin to close several 4-hour candles above 96K. On the other hand, if we want to consider a safe scenario for a move downward, then price must continue below 84K. RSI shows us that when price reached 94K, momentum slowed down, indicating that BTC wants to take a breather. This is a reasonable area for consolidation before potentially continuing its movement in the upcoming sessions. ⚠️ Risk Alert ⚠️ Futures are not beginner-friendly. These triggers require solid experience. Before using them, study risk management and practice with the learning content here.
Disclaimer
Any content and materials included in Sahmeto's website and official communication channels are a compilation of personal opinions and analyses and are not binding. They do not constitute any recommendation for buying, selling, entering or exiting the stock market and cryptocurrency market. Also, all news and analyses included in the website and channels are merely republished information from official and unofficial domestic and foreign sources, and it is obvious that users of the said content are responsible for following up and ensuring the authenticity and accuracy of the materials. Therefore, while disclaiming responsibility, it is declared that the responsibility for any decision-making, action, and potential profit and loss in the capital market and cryptocurrency market lies with the trader.