
dumcom
@t_dumcom

What symbols does the trader recommend buying?
Purchase History
پیام های تریدر
Filter
Bitcoin 2016-2024+ = Amazon 1997-2007+ ? Similarities Overlayed

The chart performance of Bitcoin from 2016 onwards is similar to Amazon's from 1997 onwards when overlaying the two charts. When looking at fundamentals both are innovative technologies that have network effects. Both are misunderstood at times and overbought at other times. The overlayed chart reminds about the risk of a short-term decrease in Bitcoin's price, but also reminds of the importance of keeping a long-term view if Bitcoin continues to perform similarly to how the stock price of Amazon did. This is not financial advice, your capital is at risk in all investments, don't invest unless you're prepared to lose all the money you invest. Bitcoin has a very high risk associated to it, do your own research, do not take any actions based on this idea.
SPX Short Term Bearish: RSI Divergence, Doji, Hindenburg Omen
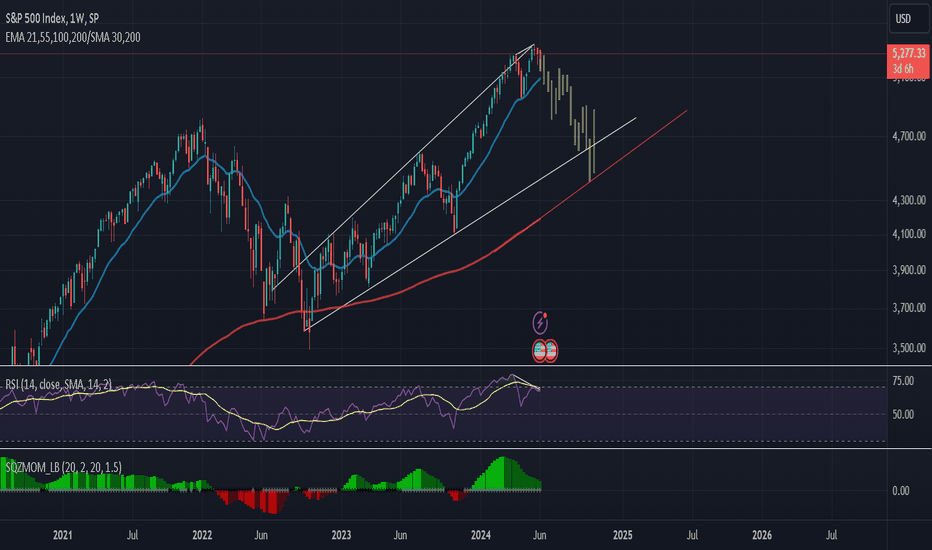
The S&P500 looks bearish in the short term. There is a bearish RSI divergence in the weekly and daily chart, with price increasing and RSI decreasing. The weekly momentum is slowing down. The weekly doji candle on 20 May can indicate a local top and the beginning of a short-term correction. The triggering of the Hindenburg Omen and Titanic Syndrome signifies increased risk in the markets. The expected rate cuts in 2024 can cause the market to have a short-term negative reaction, as happened before by 35% around the 2019 Fed Pivot, 58% in 2007 and 51% in 2000. According to the CME FedWatch tool, there is currently an 18.5% probability of a rate cut at the 31 July FOMC meeting and a 65.7% probability at the 18 September meeting. The closing below the 21W EMA can act as confirmation. A potential bottom can be a wick towards the future 200W EMA at around $4350, but the correction might not be as significant. A long term bullish perspective remains, with a potential significant uptrend starting in November - December 2024 due to rate cuts and increased liquidity. Not financial advice, do your own research, do not take any actions based on this idea.
Disclaimer
Any content and materials included in Sahmeto's website and official communication channels are a compilation of personal opinions and analyses and are not binding. They do not constitute any recommendation for buying, selling, entering or exiting the stock market and cryptocurrency market. Also, all news and analyses included in the website and channels are merely republished information from official and unofficial domestic and foreign sources, and it is obvious that users of the said content are responsible for following up and ensuring the authenticity and accuracy of the materials. Therefore, while disclaiming responsibility, it is declared that the responsibility for any decision-making, action, and potential profit and loss in the capital market and cryptocurrency market lies with the trader.