
dudebruhwhoa
@t_dudebruhwhoa

What symbols does the trader recommend buying?
Purchase History
پیام های تریدر
Filter
dudebruhwhoa
الگوی تکراری بیت کوین: آیا قله جدید در راه است؟ (تحلیل تکنیکال)
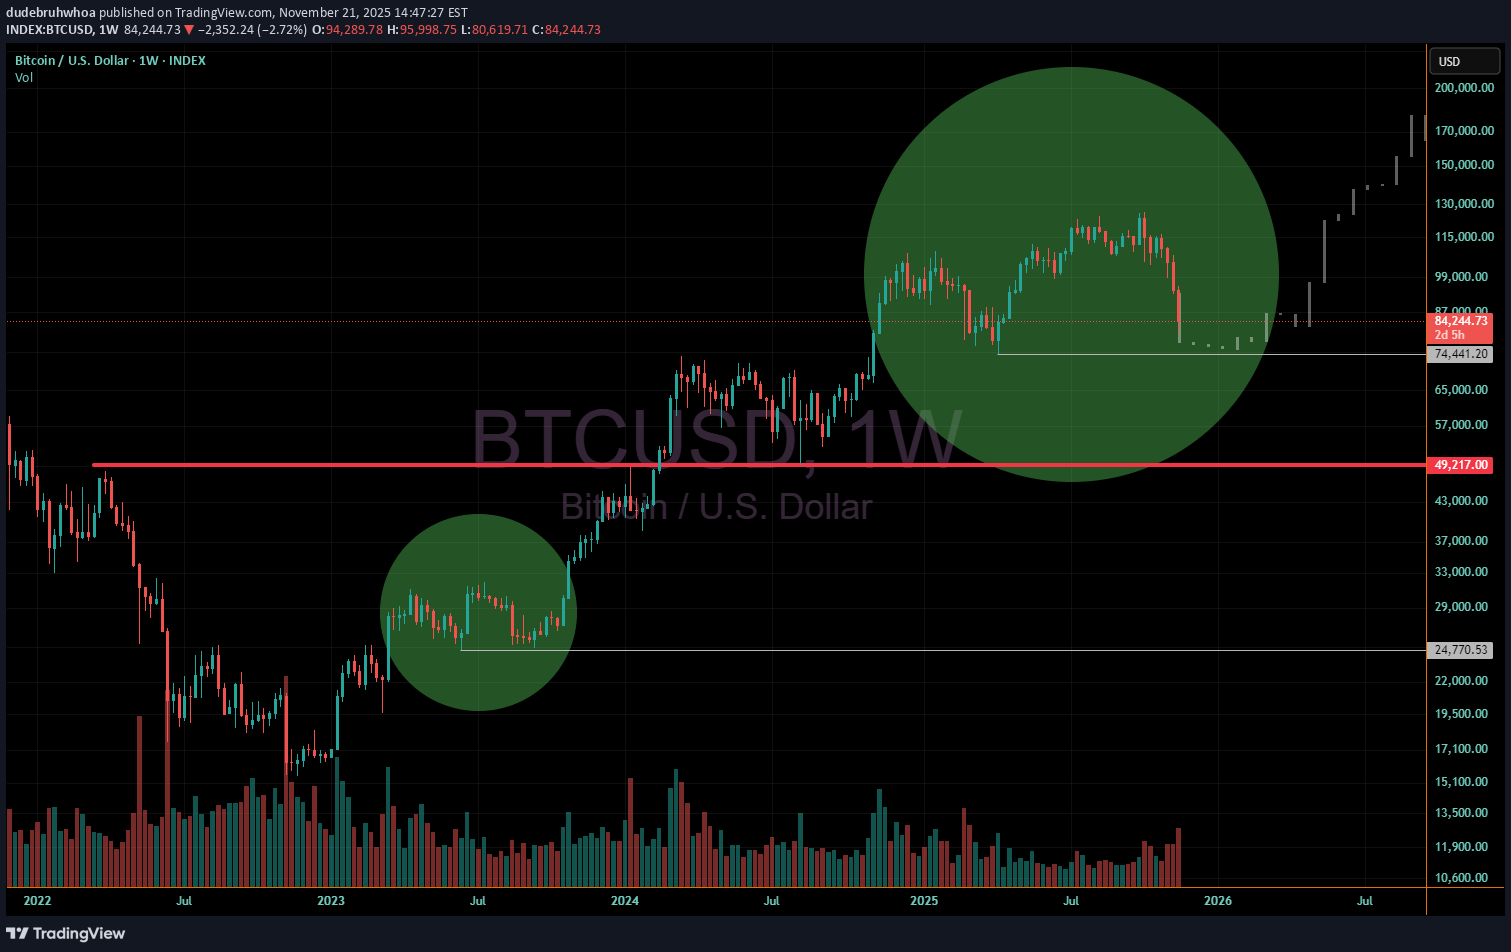
Possible repeating pattern in Bitcoin here. If so, a possible stop near the upper white line as it did previously with a very slightly higher 2nd low, then start moving up slowly after finding its lows, and finally spike up and find a new high. Must not lose the thick red line around 49k if we make a lower low. Volume needs to come back in and start flipping green vs the present rising red volume being seen on weekly chart now. This could take upwards of 6 months or longer to play out.
dudebruhwhoa
Reclaim 3.9 cents to go ~100+%
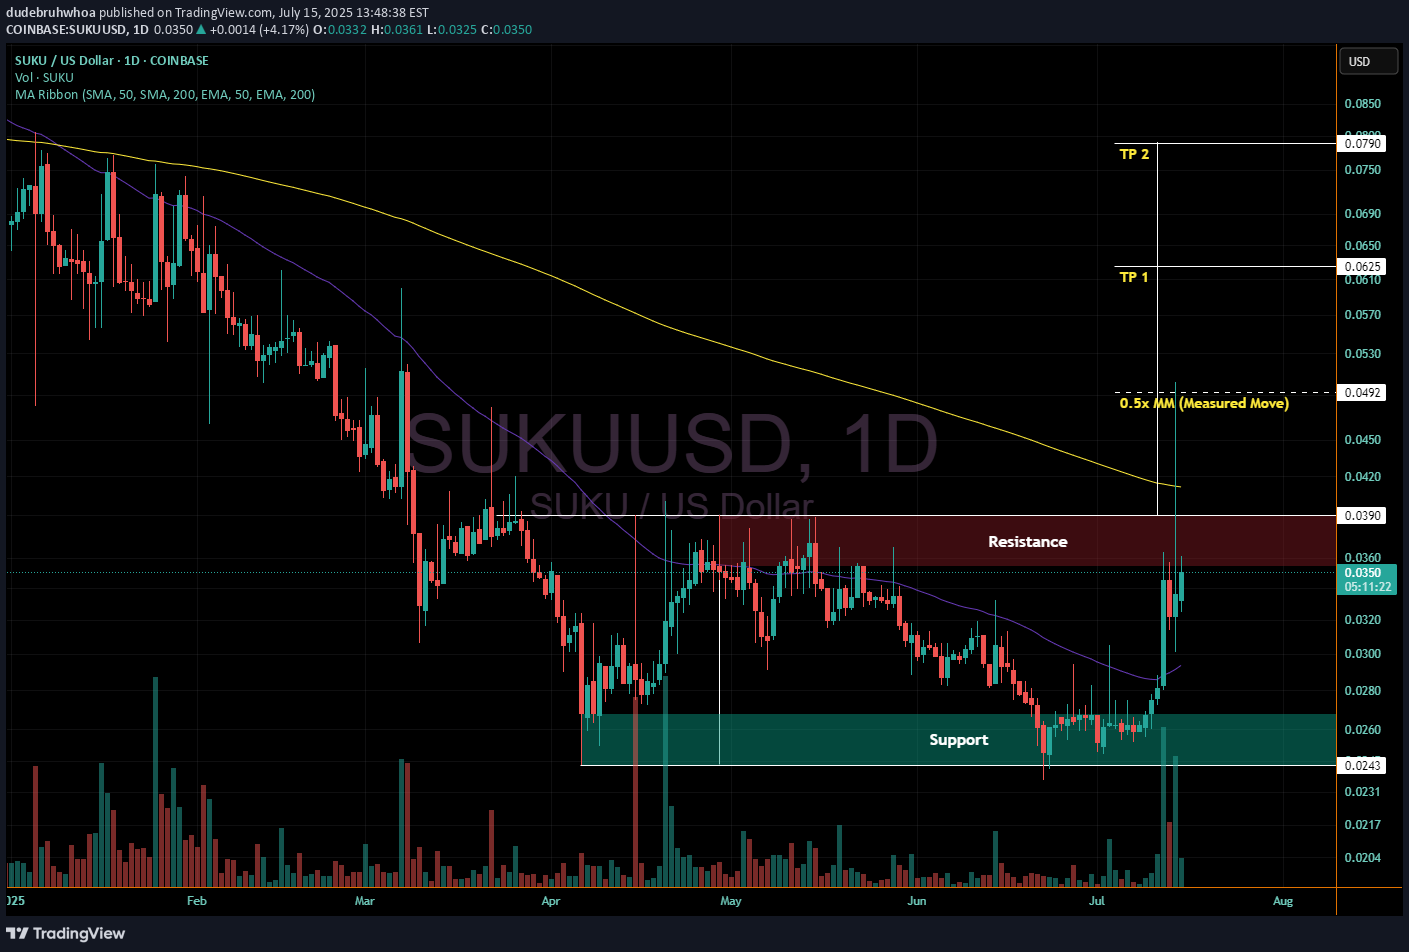
Quick double bottom pattern chart for suku/usd. It has finally seen an impulsive move up after bottoming around 2.4 cents. That move did breach 3.9 cents and tap the 0.5x measured move towards TP 1, but hasn't yet held above 3.9 or the 200 daily EMA just above it. It is presently pushing on resistance. As long as bitcoin holds up, a move above 3.9 and the 200 EMA that pushes on up to TP 1 and 2 seems quite likely. If not, we may see a move back down to or even just below support for a 3rd lower low beforehand
dudebruhwhoa
Head Shoulders Bull and Bear Targets

Lose $2.08 - Ripple will move down to 1.26 and then 98 cents approxHold 2.08 and reclaim ~3 dollars - Ripple can move up to 4.91 and then 6.3Dashed lines are additional possible targets if it continues in either direction, the first dashed lines also mark halfway points to bull or bear TP 1
dudebruhwhoa
Rising Wedge Breakdown
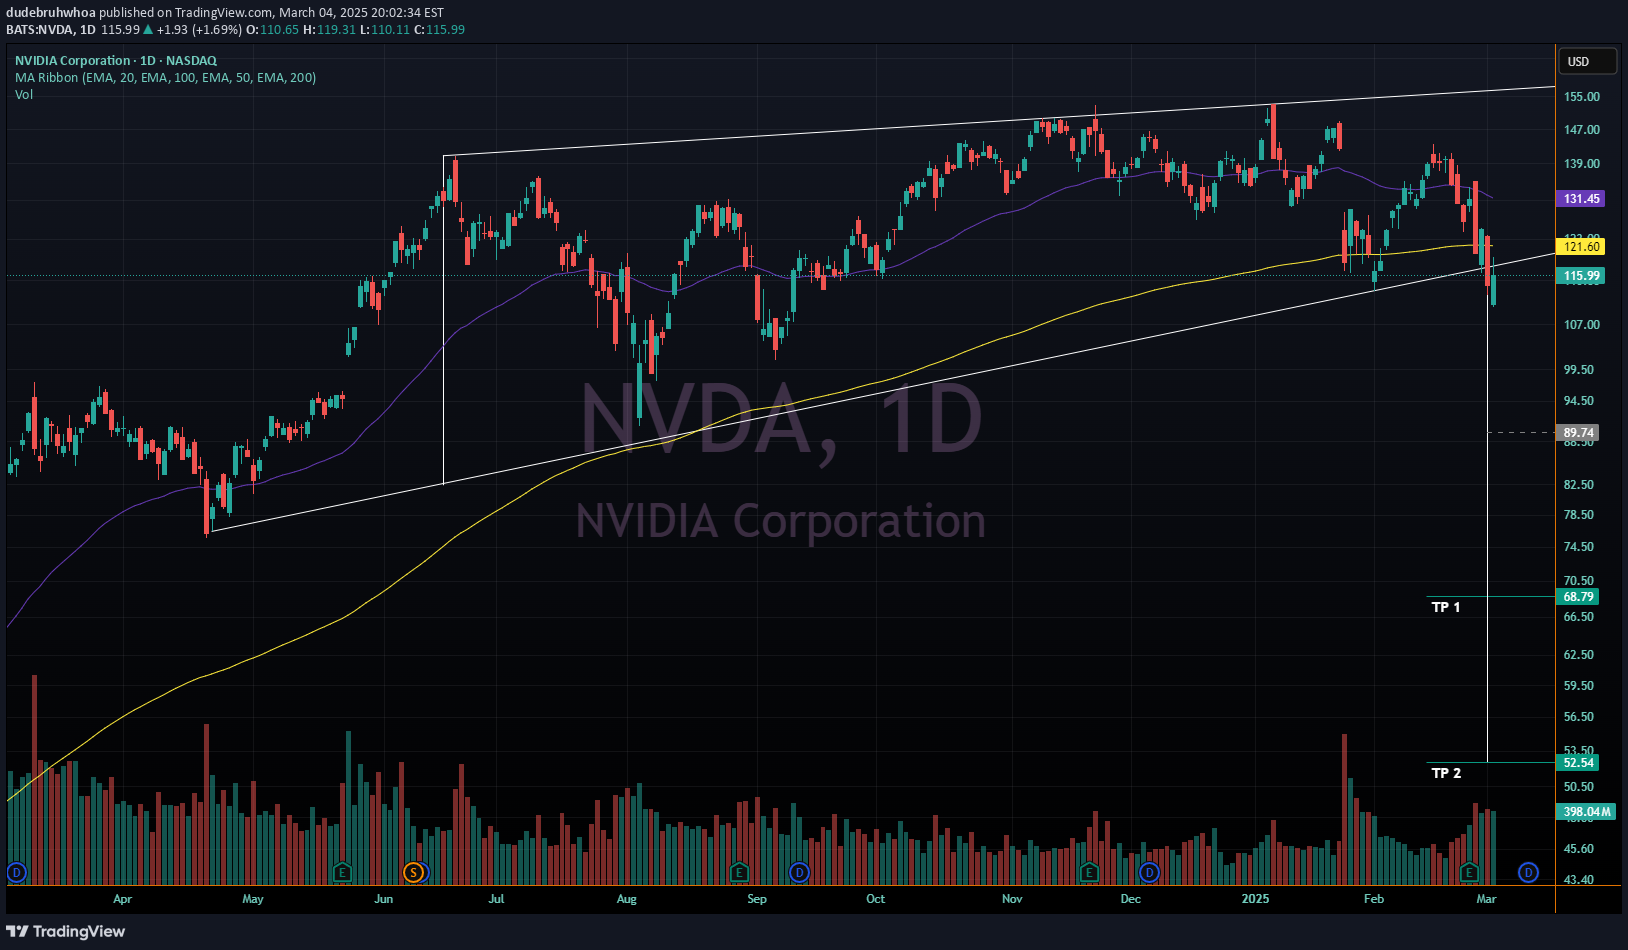
Nvidia needs to reclaim the bottom of a rising wedge it just lost and failed to reclaim on the last two daily candles. It did wick back above it with the most recent daily candle but failed to reach the 200 day EMA, and closed below. There could be further tests, but the most likely scenario here is down towards the two take profit targets shown on the chart. A halfway point to TP 1 is the dashed grey line, which may also be a stopping point along the way down.
dudebruhwhoa
4h Parallel Channel

Short-term:Bitcoin is in a parallel channel on the 4h chart.Break above the channel to head towards 120k and continue making new ATHsBreak below the channel to re-test 85-90k.Long-term:Bitcoin is likely going to approx 132.5k, as shared here:Channel lost, downside targets are 89-90k and then 85.5k if it fails to reclaim the channel:
dudebruhwhoa
4h Parallel Channel

Remain in the channel to break 4k: , break down from the channel to test 3k or lower.break out of the channel to move to and above 5kbreak down from the channel to test 3k or lower
dudebruhwhoa
HBAR Monthly S/R Targets Chart

Publishing a monthly support and resistance chart, a weekly view of that chart - with targets - that I've been sharing for a while, so others can follow along.This in addition to the parallel S/R chart that is already published here:With an updated snapshot of it here (targets adjusted for where it broke out):Possible areas of local support if any dips below monthly resistance are marked on the chart.Hope this helps if you are following HBARUSD
dudebruhwhoa
HBAR Monthly S/R Targets Chart

Publishing a monthly support and resistance chart, a weekly view of that chart - with targets - that I've been sharing on Twitter/X for a while, so others can follow along. This in addition to the parallel S/R chart that is already published here:With an updated snapshot of it here (targets adjusted for where it broke out):Hope this is helpful for those watching HBAR make its move this run.
dudebruhwhoa
Repeating Pattern on 4h Chart?

Possible repeating pattern to the leg up from 65 to 98k. Yellow arrow shows where we are in the same setup that is highlighted by the orange rectangle.If this is true, we'd see something like a drop from here to mid-to-low 80k range before finding enough buyers for the push above 100k.Long-term long, short-term short.Reminder that there is a daily CME gap yet unfilled below this area however, around 78 to 80.7k:
dudebruhwhoa
Repeating Pattern

HBAR loves to repeat patterns. Here's a new one, take the circled area, blow it up and overlay over where we are presently, and the similarity bears a striking resemblance to just prior to its last major move up.
Disclaimer
Any content and materials included in Sahmeto's website and official communication channels are a compilation of personal opinions and analyses and are not binding. They do not constitute any recommendation for buying, selling, entering or exiting the stock market and cryptocurrency market. Also, all news and analyses included in the website and channels are merely republished information from official and unofficial domestic and foreign sources, and it is obvious that users of the said content are responsible for following up and ensuring the authenticity and accuracy of the materials. Therefore, while disclaiming responsibility, it is declared that the responsibility for any decision-making, action, and potential profit and loss in the capital market and cryptocurrency market lies with the trader.