
dramos31
@t_dramos31

What symbols does the trader recommend buying?
Purchase History
پیام های تریدر
Filter
Signal Type

Coinbase COIN has two gaps to fill — which first? 🚀 9% gap above at 50MA resistance 7% gap below near long-term support Volume and price action will show the next move. Break above 50MA signals bullish fill; drop to support could mean bounce. RSI neutral, momentum key.

Hey traders! I'm testing out a new, simplified chart setup and wanted to share it with the community here before posting it on X. I'd really appreciate any feedback — whether it's suggestions for improvement or just letting me know if it looks clean and useful. Thanks in advance!
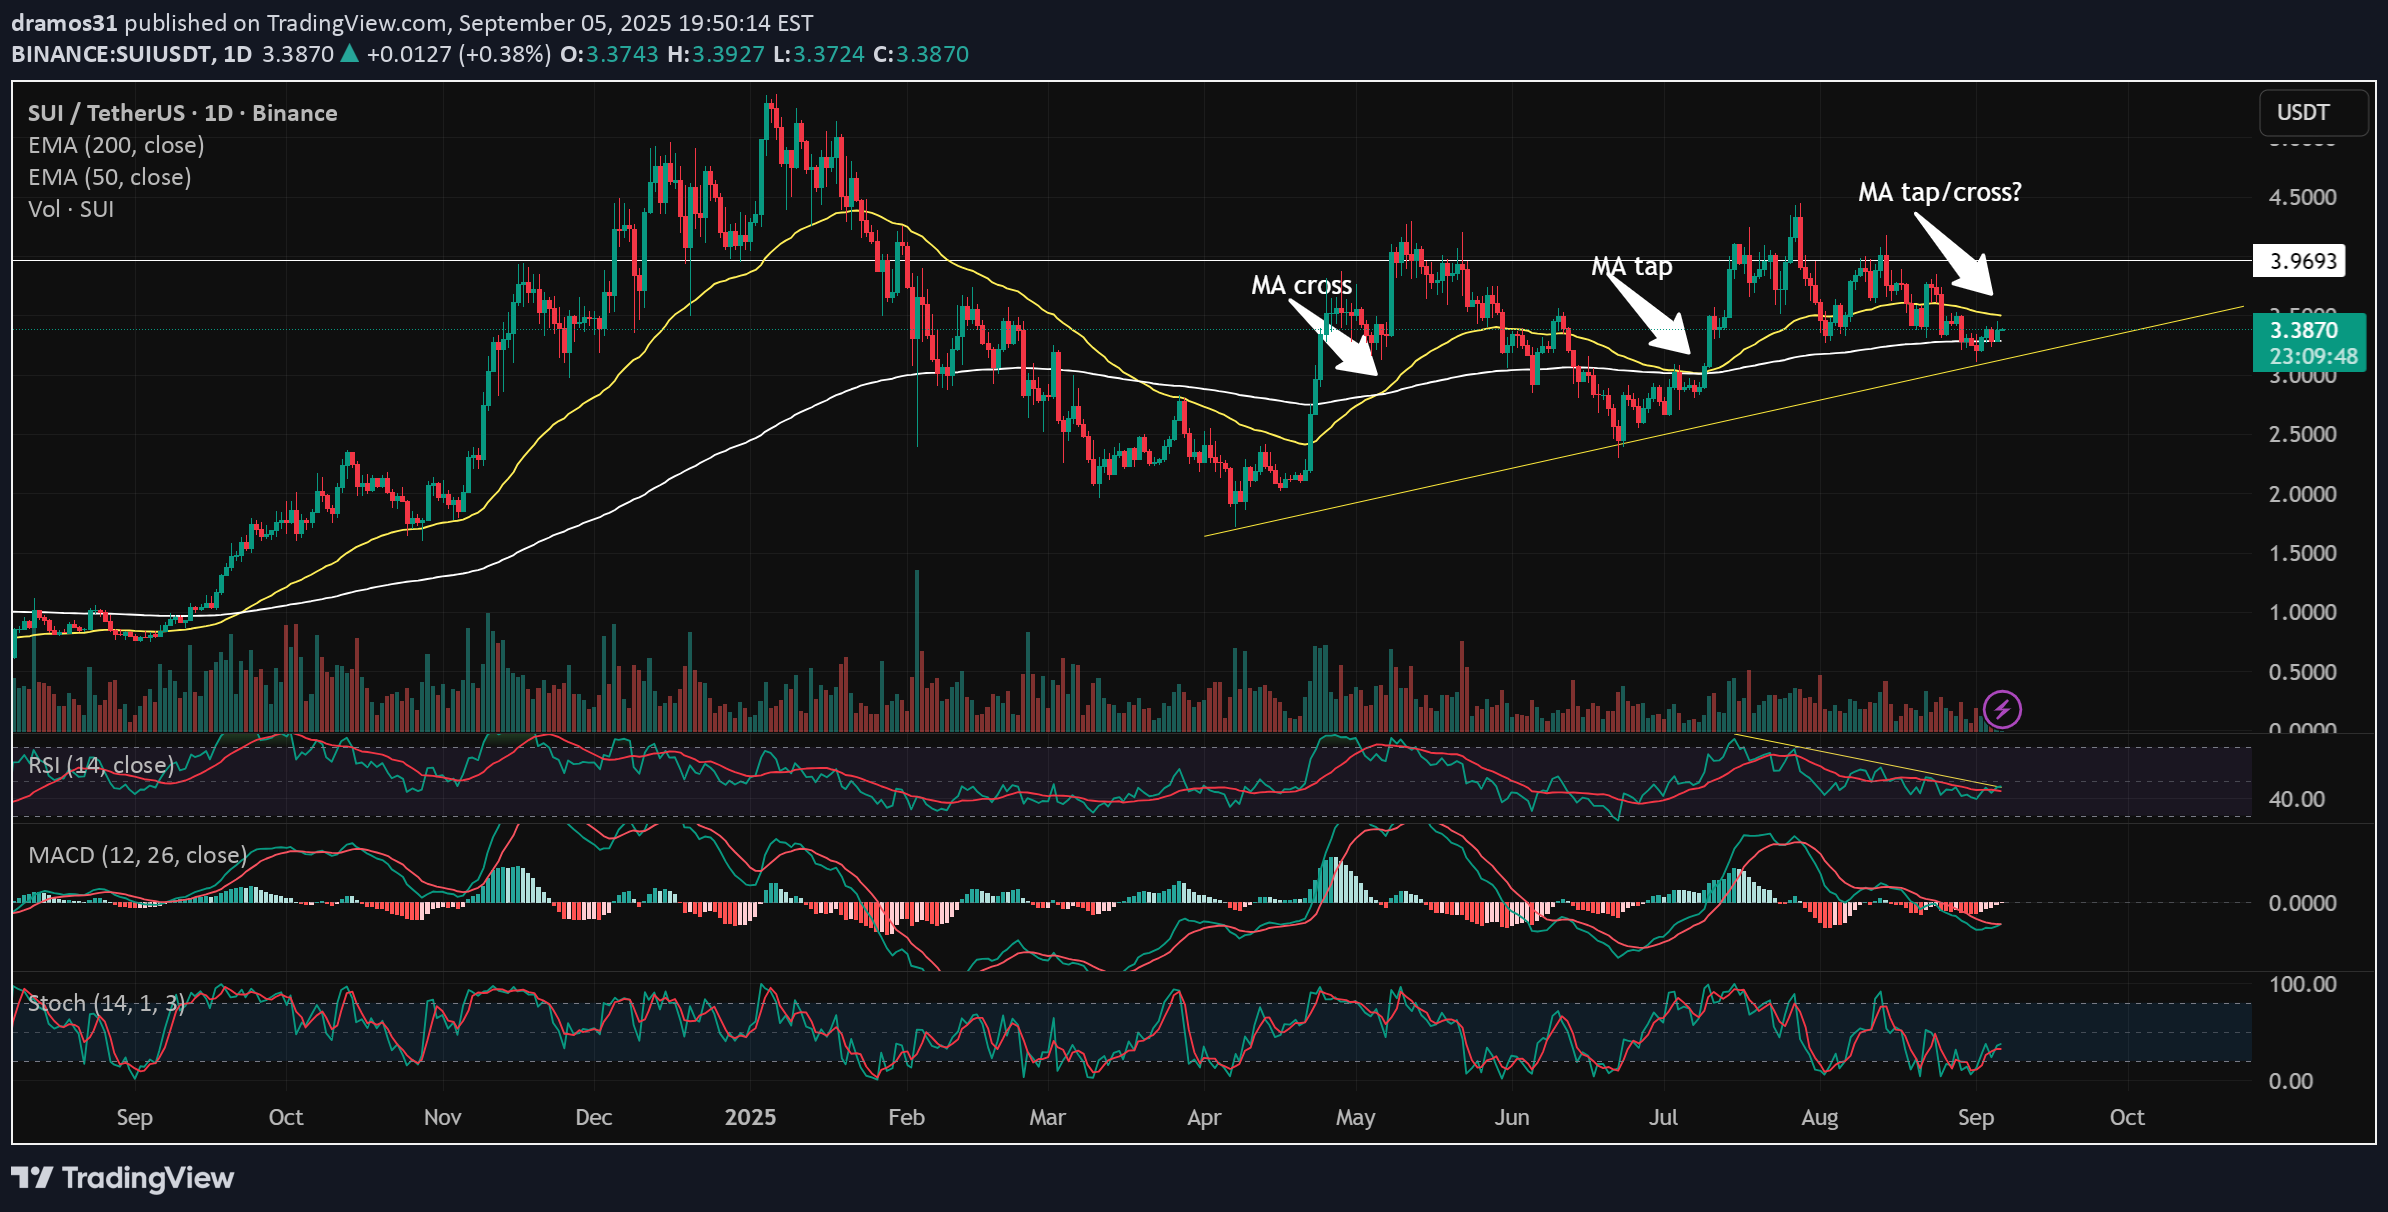
🟢 Trend & Structure Since April, SUI has been respecting a clear upward support trendline, tapped 3 times and holding firmly. This validates the bullish structure and sets the stage for a potential ascending triangle pattern, with higher lows pressing against the $3.9 resistance zone. Ascending triangles are typically continuation patterns, but they require volume expansion to confirm. Without that, they can just as easily break down. 📉 Moving Averages (MAs) In May, we saw a golden cross (50 EMA crossing above 200 EMA) which shifted the broader bias to bullish. In July, price retested the 200 EMA successfully, respecting long-term support. Today, SUI trades above the 200 EMA (~$3.28) but remains below the 50 EMA (~$3.49). This creates a squeeze zone between the two averages. A decisive move out of this range will set the next direction. 📊 Indicators RSI (14): Currently around 44, sitting below 50. This shows bearish momentum bias, though not in oversold territory. MACD: Both lines are below zero, histogram is red but fading. This hints at a potential bullish crossover, but not confirmed yet. Stochastic: Rising from oversold levels but still in the bearish half of the range. Needs to break above 50 to show strength. Overall, indicators lean bearish-to-neutral, with some early signs of possible reversal. 🔉 Volume Profile Volume has been declining steadily since July, showing weakening demand. For any breakout above $3.9 to hold, we would need to see a clear surge in buying volume. 🎯 Key Levels to Watch Support: $3.28 (200 EMA). If broken, downside targets $2.76 (Fib 0.618 golden ratio) as the next logical support. Resistance: $3.70 (Fib 0.236). $3.90–$4.00 horizontal zone. A clean breakout above this on strong volume would confirm the ascending triangle pattern and likely extend the uptrend. ⚠️ Fundamental Catalyst – Token Unlock On October 1st, 2025, 44M SUI tokens will be unlocked. Unlocks increase circulating supply and often add short-term selling pressure. Combined with SUI trading near key support/resistance levels, this event could act as the catalyst for a decisive move — either breaking down support or fueling a breakout if demand absorbs supply. 📈 Outlook & Scenarios At this stage, SUI’s chart shows mixed signals: Bullish case: If price continues to hold above the 200 EMA and demand returns, an attempt toward $3.7–$3.9 resistance is likely. A breakout above $3.9 would confirm continuation of the uptrend. Bearish case: If $3.28 fails, a retrace toward the $2.76 Fib support becomes the higher-probability path. Bottom Line: SUI is at a decision point. Structure is bullish, but indicators lean bearish, and volume is weak. The October 1st unlock may be the trigger that decides whether this ascending triangle plays out to the upside or breaks down toward deeper support.

ETH Daily – Descending Triangle at Key Support ETH is currently testing major support at $4,322, forming a bearish descending triangle. Price is compressing, and volume has decreased over the last week — typical of consolidation before a breakout. RSI is around 50, sitting below its moving average and flattening, showing neutral to slightly bearish momentum. MACD is below the signal line but still above zero. Histogram is red and trending lower, indicating weakening bullish momentum. Stochastic RSI is near oversold territory, which could suggest a short-term bounce — but no confirmation yet. Volume continues to decline, suggesting a bigger move is coming. If $4,322 breaks, next support is around $4,286, with a potential drop toward $4,065 if momentum accelerates. If support holds, expect possible sideways action or accumulation. Watch for fake-outs — especially if price attempts to reclaim the upper triangle trendline without volume support. Bias: Neutral to Bearish — waiting for confirmation.

Bitcoin is showing signs of weakness on the daily chart after forming a double top pattern in July and August, with the neckline break confirming a bearish reversal. Price has now dropped below the 50-day EMA (~$113.4K), retested it as resistance, and is struggling to reclaim the key ~$112K former support level. Momentum indicators support this bearish structure: RSI sits below 50 (currently 45), indicating bearish momentum, though a slight bullish crossover suggests short-term relief is possible. MACD remains below the signal line and zero, but the histogram is flattening, implying the bearish momentum is slowing, not yet reversing. Stochastic is rising from near-oversold levels but still under the midline, aligning with a possible bounce that lacks trend confirmation. Volume has increased slightly during the recent bounce but doesn't yet suggest strong accumulation. If this relief rally fails at resistance, I expect BTC to revisit $107K, with a potential extension toward the $100K–$98K zone, especially if volume fades and momentum rolls over. Bearish thesis remains intact unless BTC can reclaim $115.4K with conviction.

Solana (SOL/USDT) – Daily Chart Analysis SOL attempted a breakout above the key $205 resistance zone but failed to hold above it, showing signs of a bull trap or false breakout. 🔍 Technical Highlights: RSI is showing bearish divergence (price made a higher high, RSI did not) and is now hovering near the neutral 50 level — suggesting momentum is fading. MACD is crossing below the signal line, though still above zero. This points to weakening bullish momentum, not yet full bearish confirmation. Stochastic RSI is curling downward around the midpoint, hinting at a potential short-term pullback. Volume has decreased on the recent move up — lack of conviction from buyers. Key Support to Watch: $185 zone, which lines up with the 50 EMA — strong potential for support or consolidation. Bearish Scenario: A breakdown below $185 could open the door for a deeper retracement toward $170–$172, which is near the 200 EMA. Bullish Invalidation: A strong reclaim and close above $205 with rising volume would invalidate the short-term bearish setup and may signal continuation toward $219+.
Disclaimer
Any content and materials included in Sahmeto's website and official communication channels are a compilation of personal opinions and analyses and are not binding. They do not constitute any recommendation for buying, selling, entering or exiting the stock market and cryptocurrency market. Also, all news and analyses included in the website and channels are merely republished information from official and unofficial domestic and foreign sources, and it is obvious that users of the said content are responsible for following up and ensuring the authenticity and accuracy of the materials. Therefore, while disclaiming responsibility, it is declared that the responsibility for any decision-making, action, and potential profit and loss in the capital market and cryptocurrency market lies with the trader.