
discobiscuit
@t_discobiscuit

What symbols does the trader recommend buying?
Purchase History
پیام های تریدر
Filter
discobiscuit
BTCUSD bullish analysis
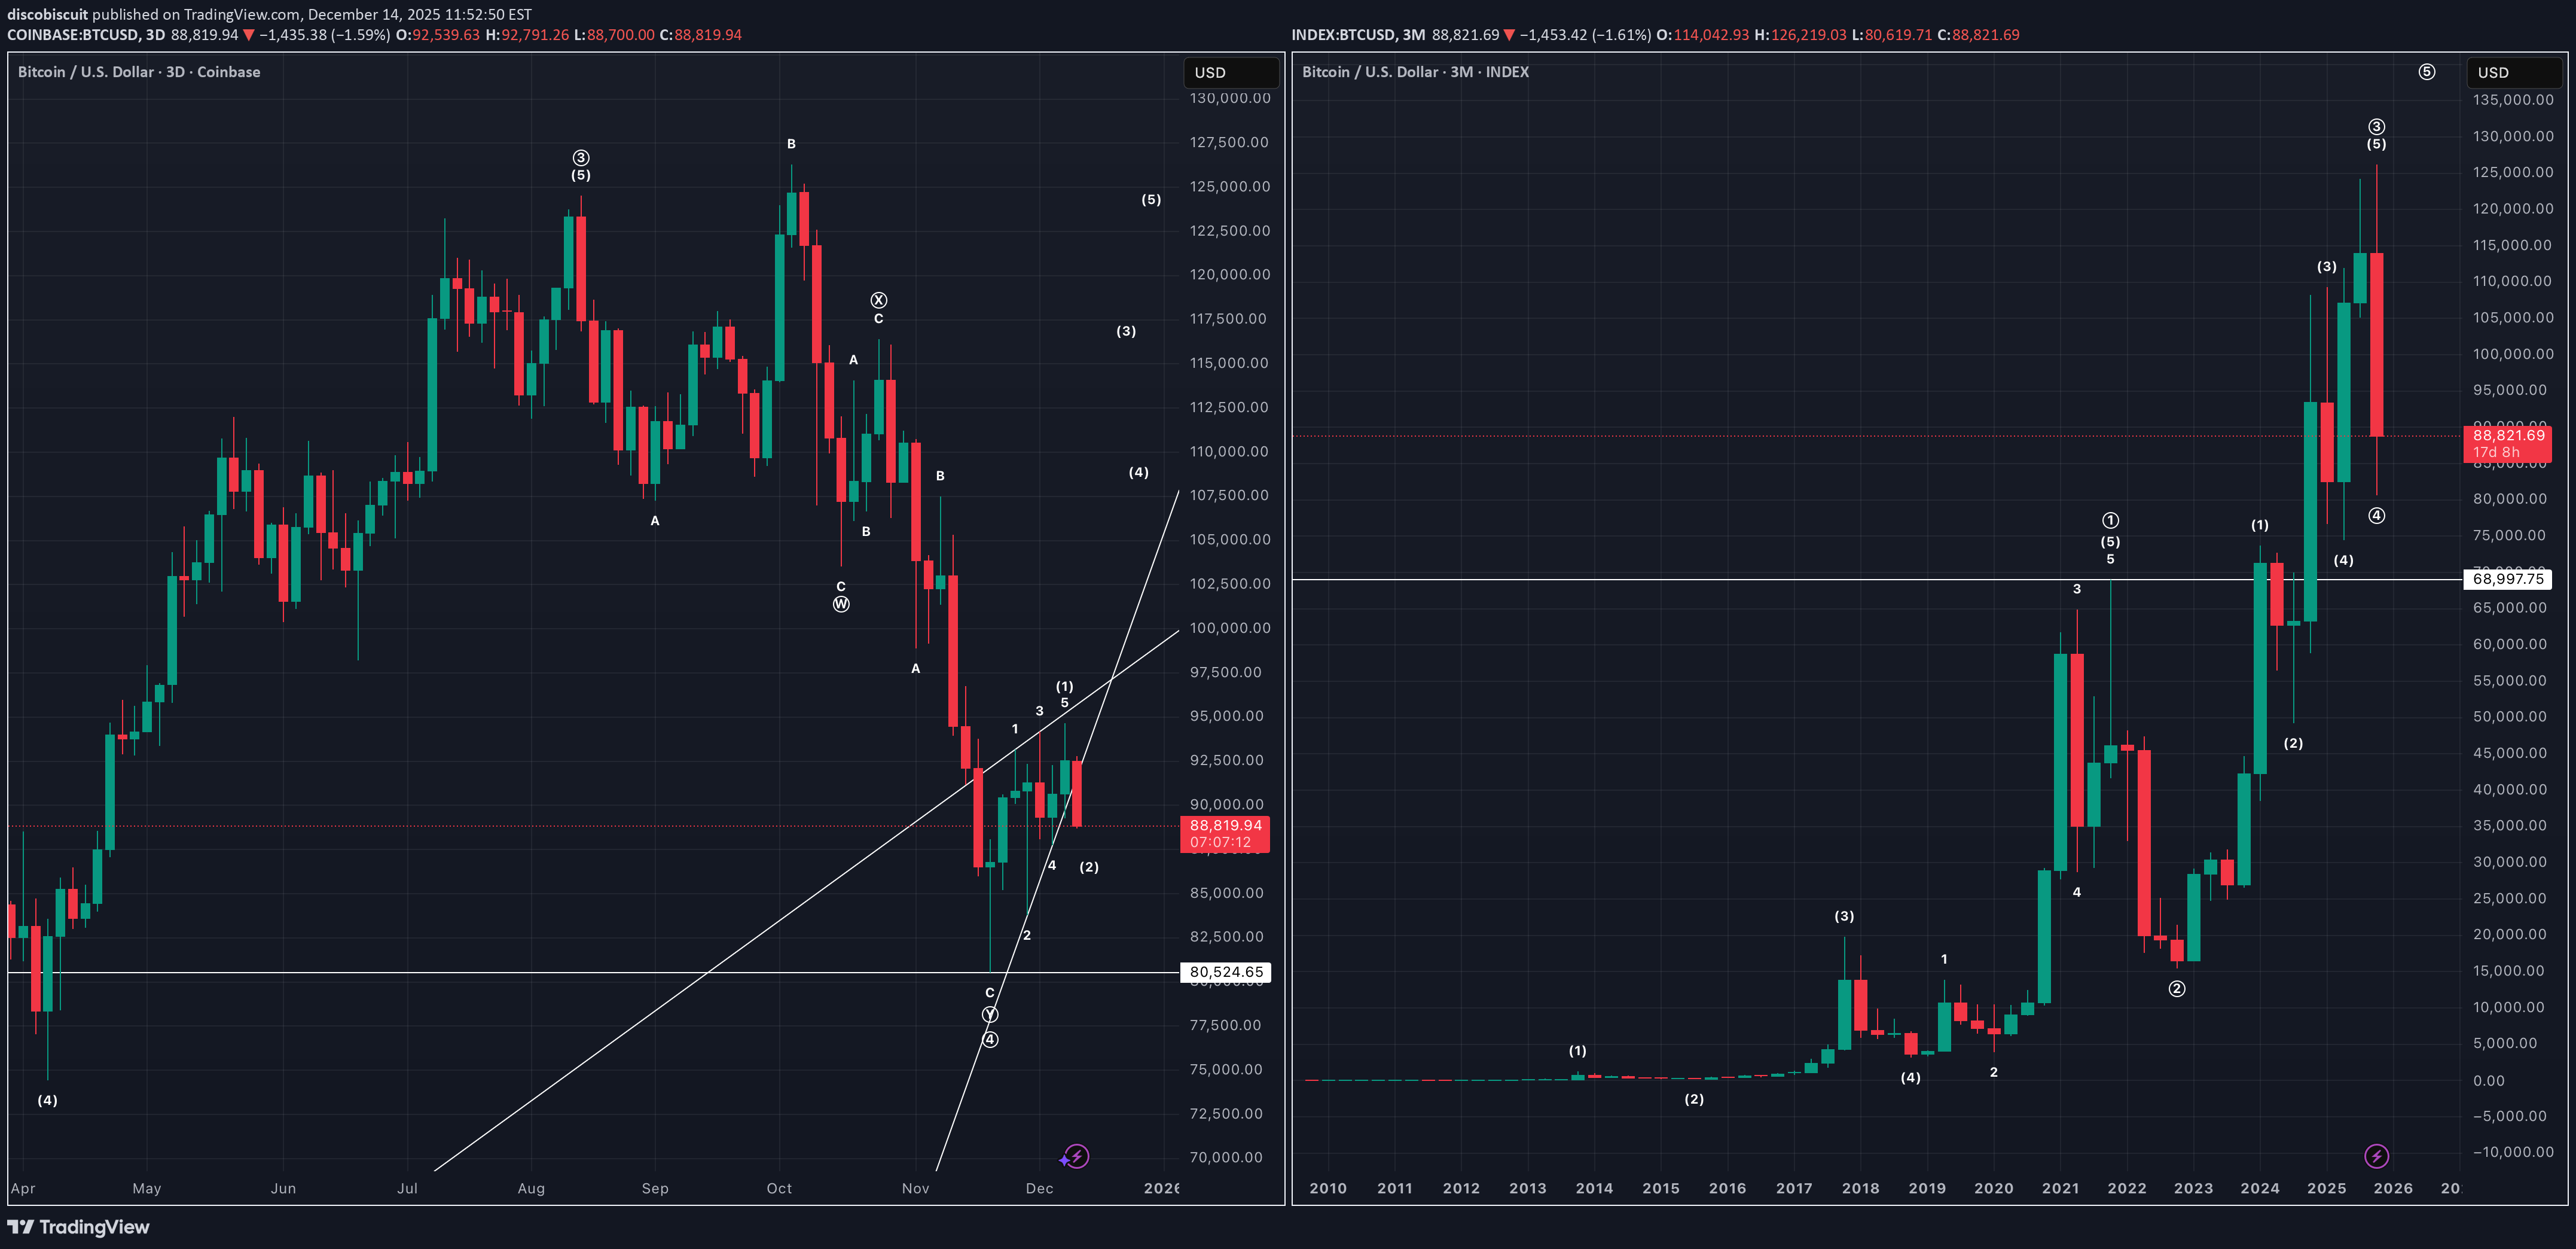
Technical analysis for BTCUSD. This Elliott Wave count has bottom completed at 80524.65, leading diagonal (1) complete, corrective wave (2) ongoing, 80524.65 needing to hold as support. Big picture, BTCUSD looks to be in wave ((5)) of supercycle of its entire history.
discobiscuit
تحلیل صعودی بیت کوین و اتریوم: مقایسه موجهای الیوت و سطوح کلیدی حمایت
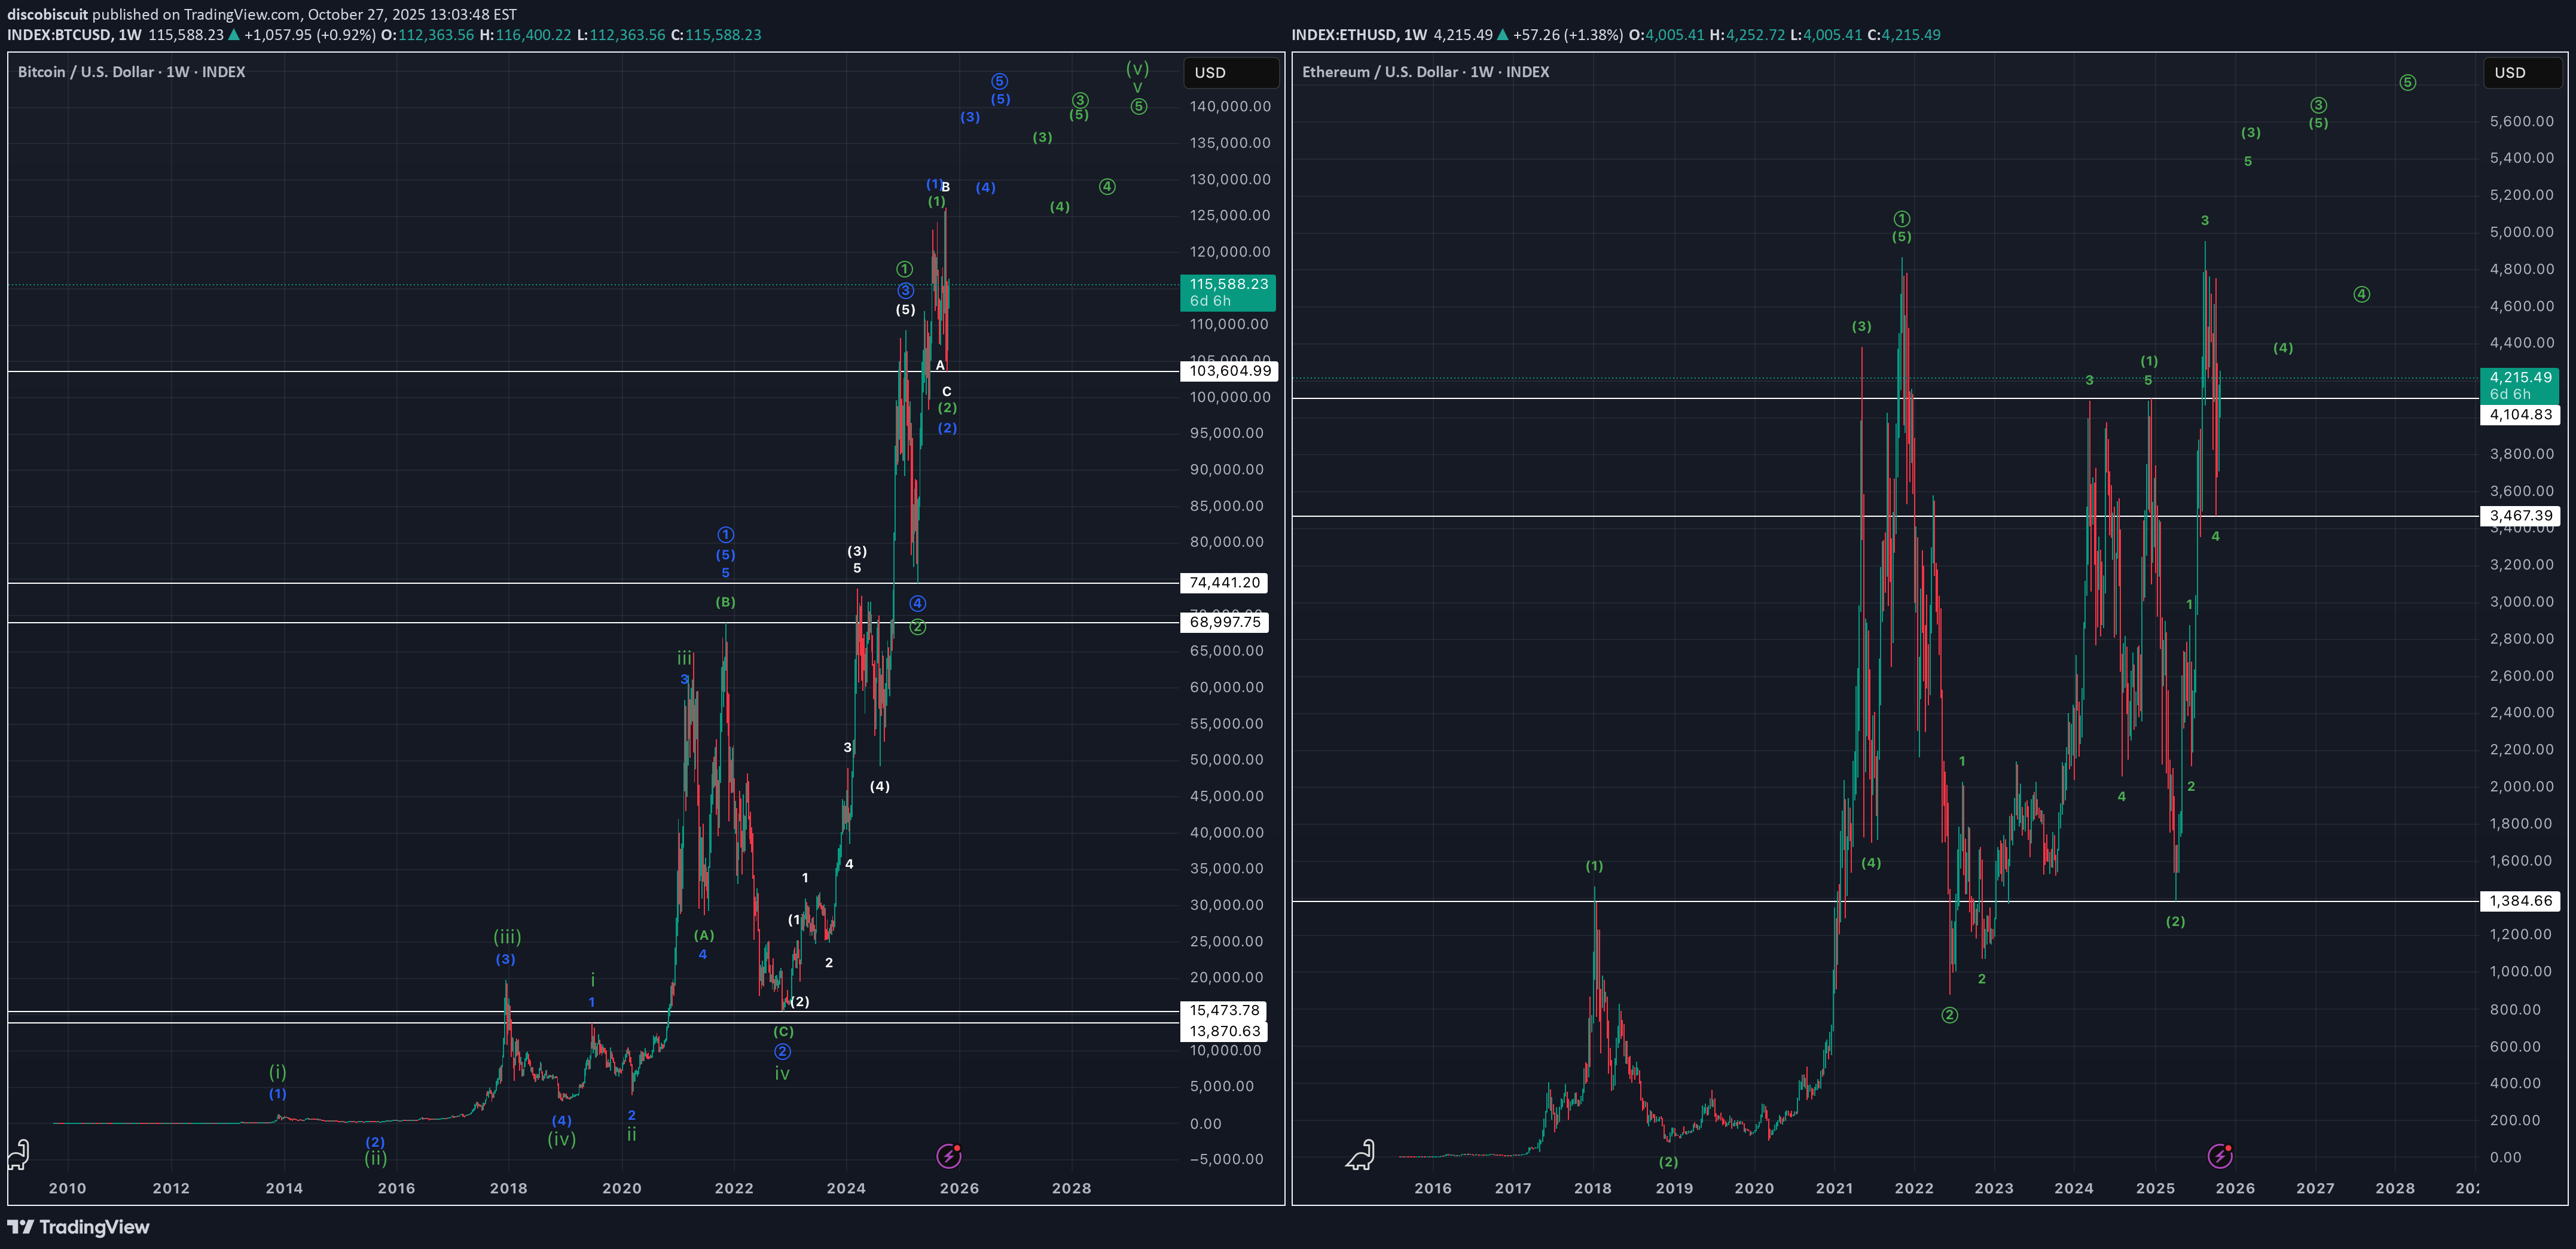
Bullish Elliott Wave counts, comparing BTC and ETH. ETHUSD looks to be in wave 5 of (3) of ((3)), which would suggest three major impulse waves up and two major corrections down. Key level of support is 3467.39. BTCUSD has more interpretations, IMO, but what I think is most clear is that if price returns to ATHs, that price would be in a wave 3 of an impulse that started off 74441.20 in April 2025. Wave 2 of this impulse would be an expanded flat, and key level of support is 103604.99.
discobiscuit
تحلیل موج شماری بیت کوین (BTCUSD): آیا صعود ادامه مییابد یا ریزش آغاز میشود؟
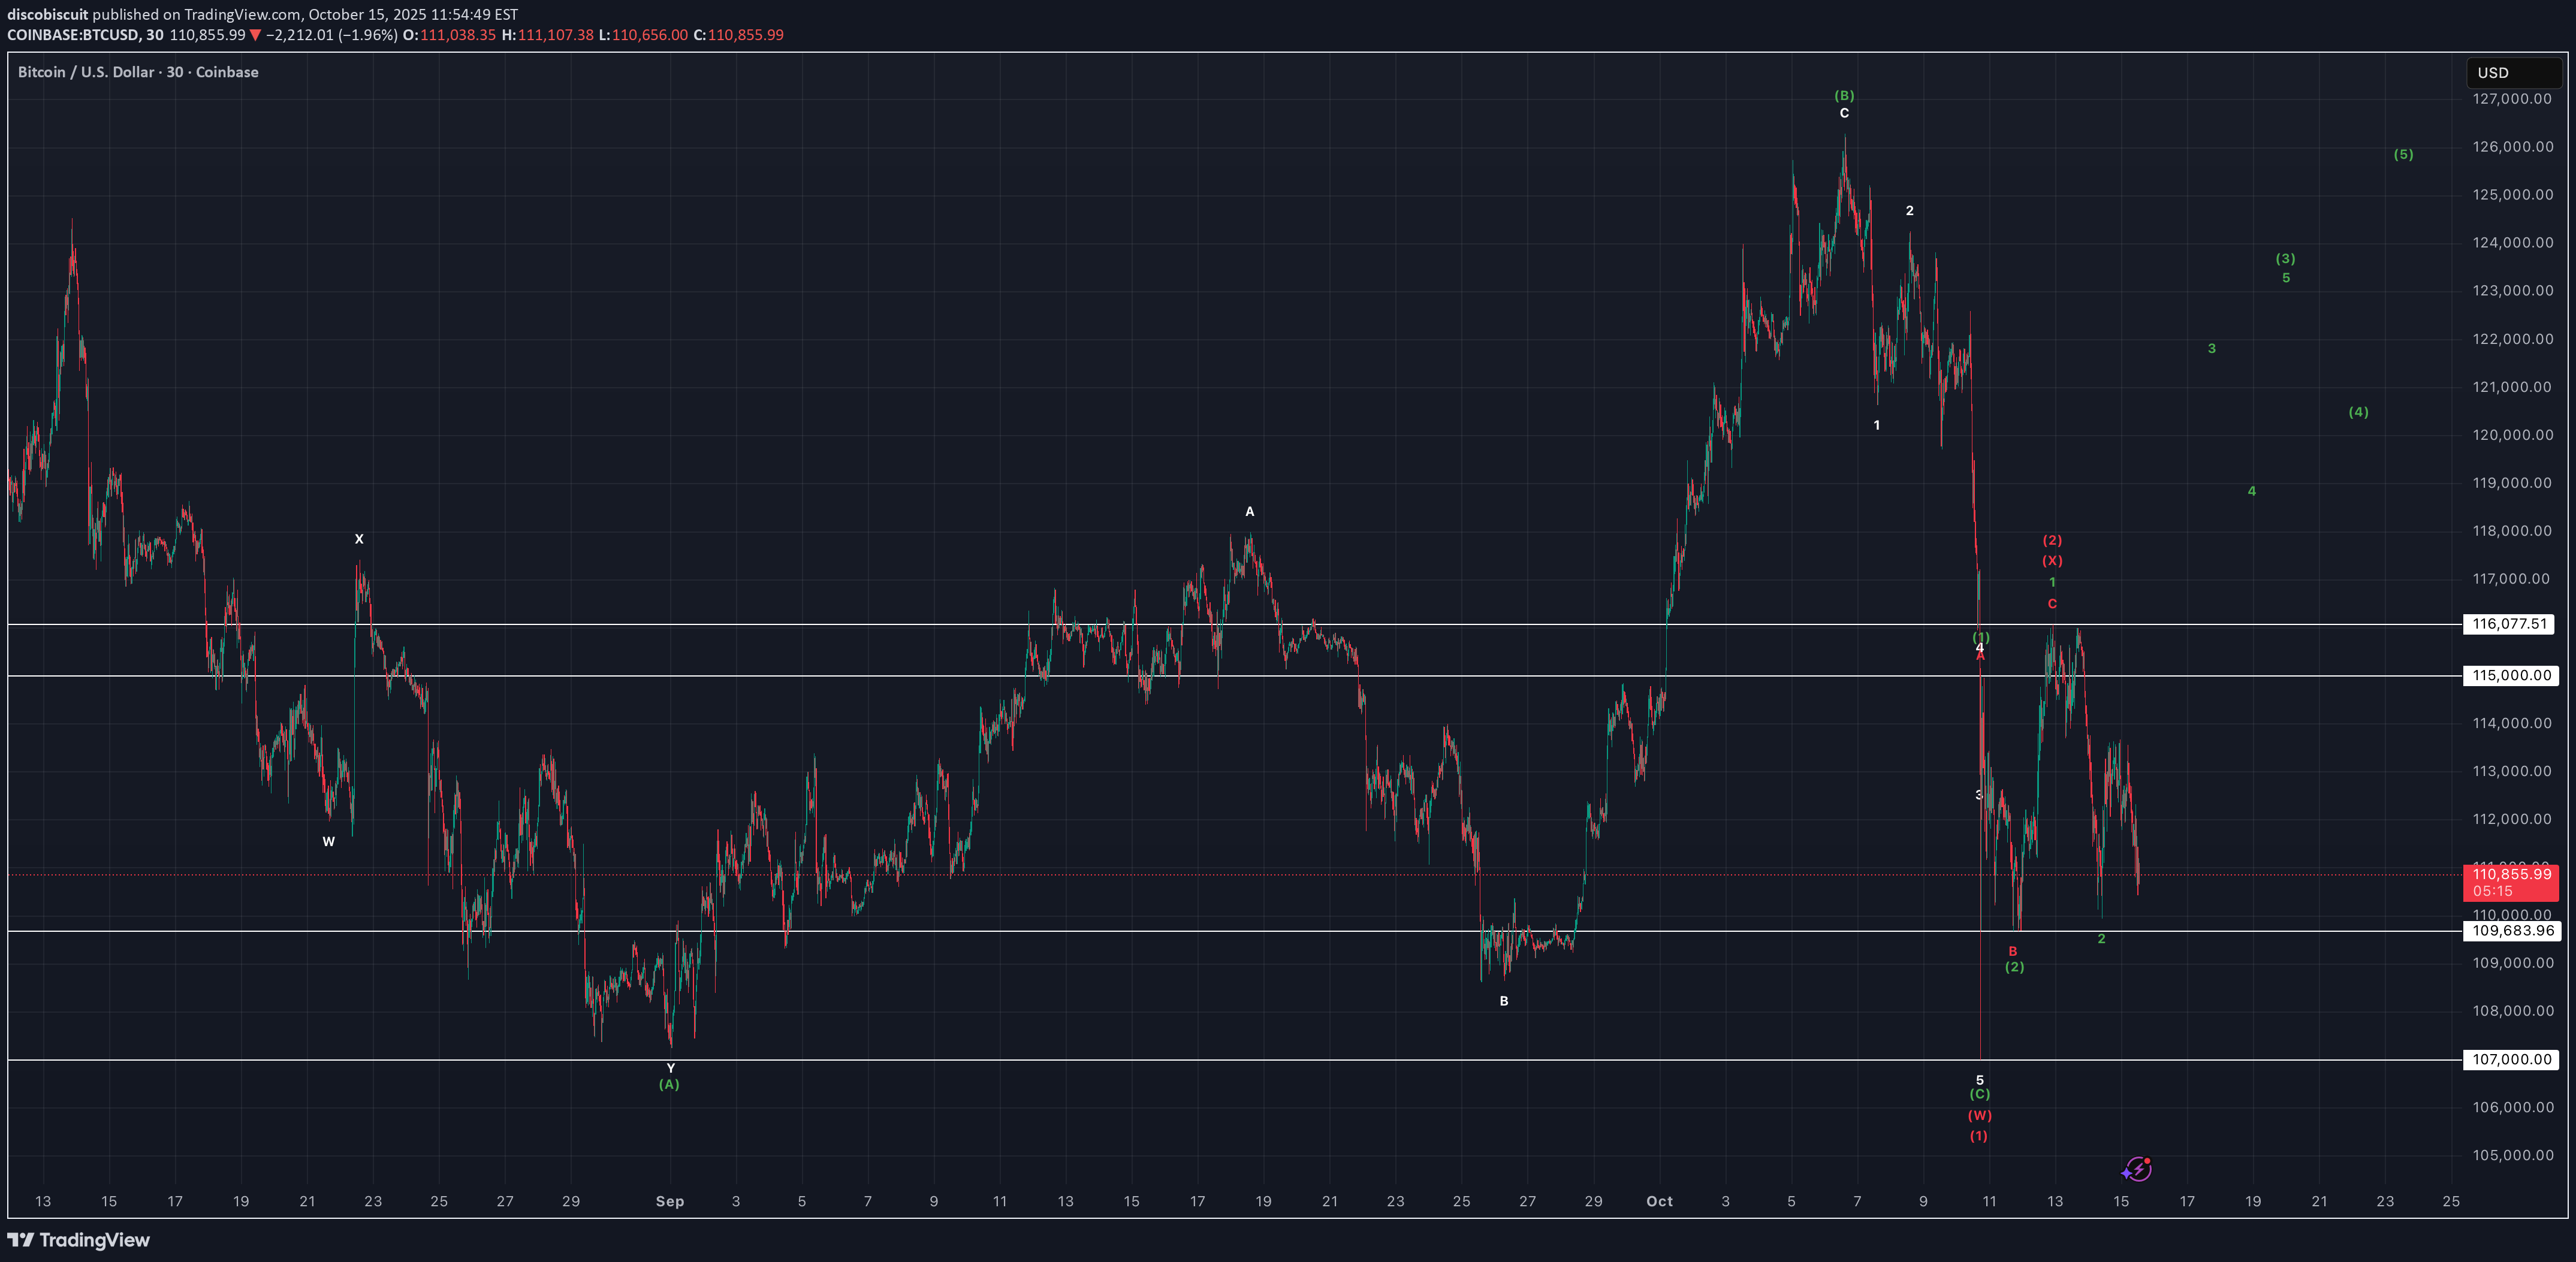
Technical analysis for BTCUSD. Price action from 13 August to 10 October looks like an expanded flat (in green), with completion at 107000. Two small impulse waves off low of 107000. Bulls need 109683.96 to hold as support; otherwise, the two small impulses most likely become a zigzag (in red). If 109683.96 breaks as support, then either a larger (c) wave of the expanded flat or some sort of double-three becomes probable. Bulls have good risk/reward off 109.683.96 at present.
discobiscuit
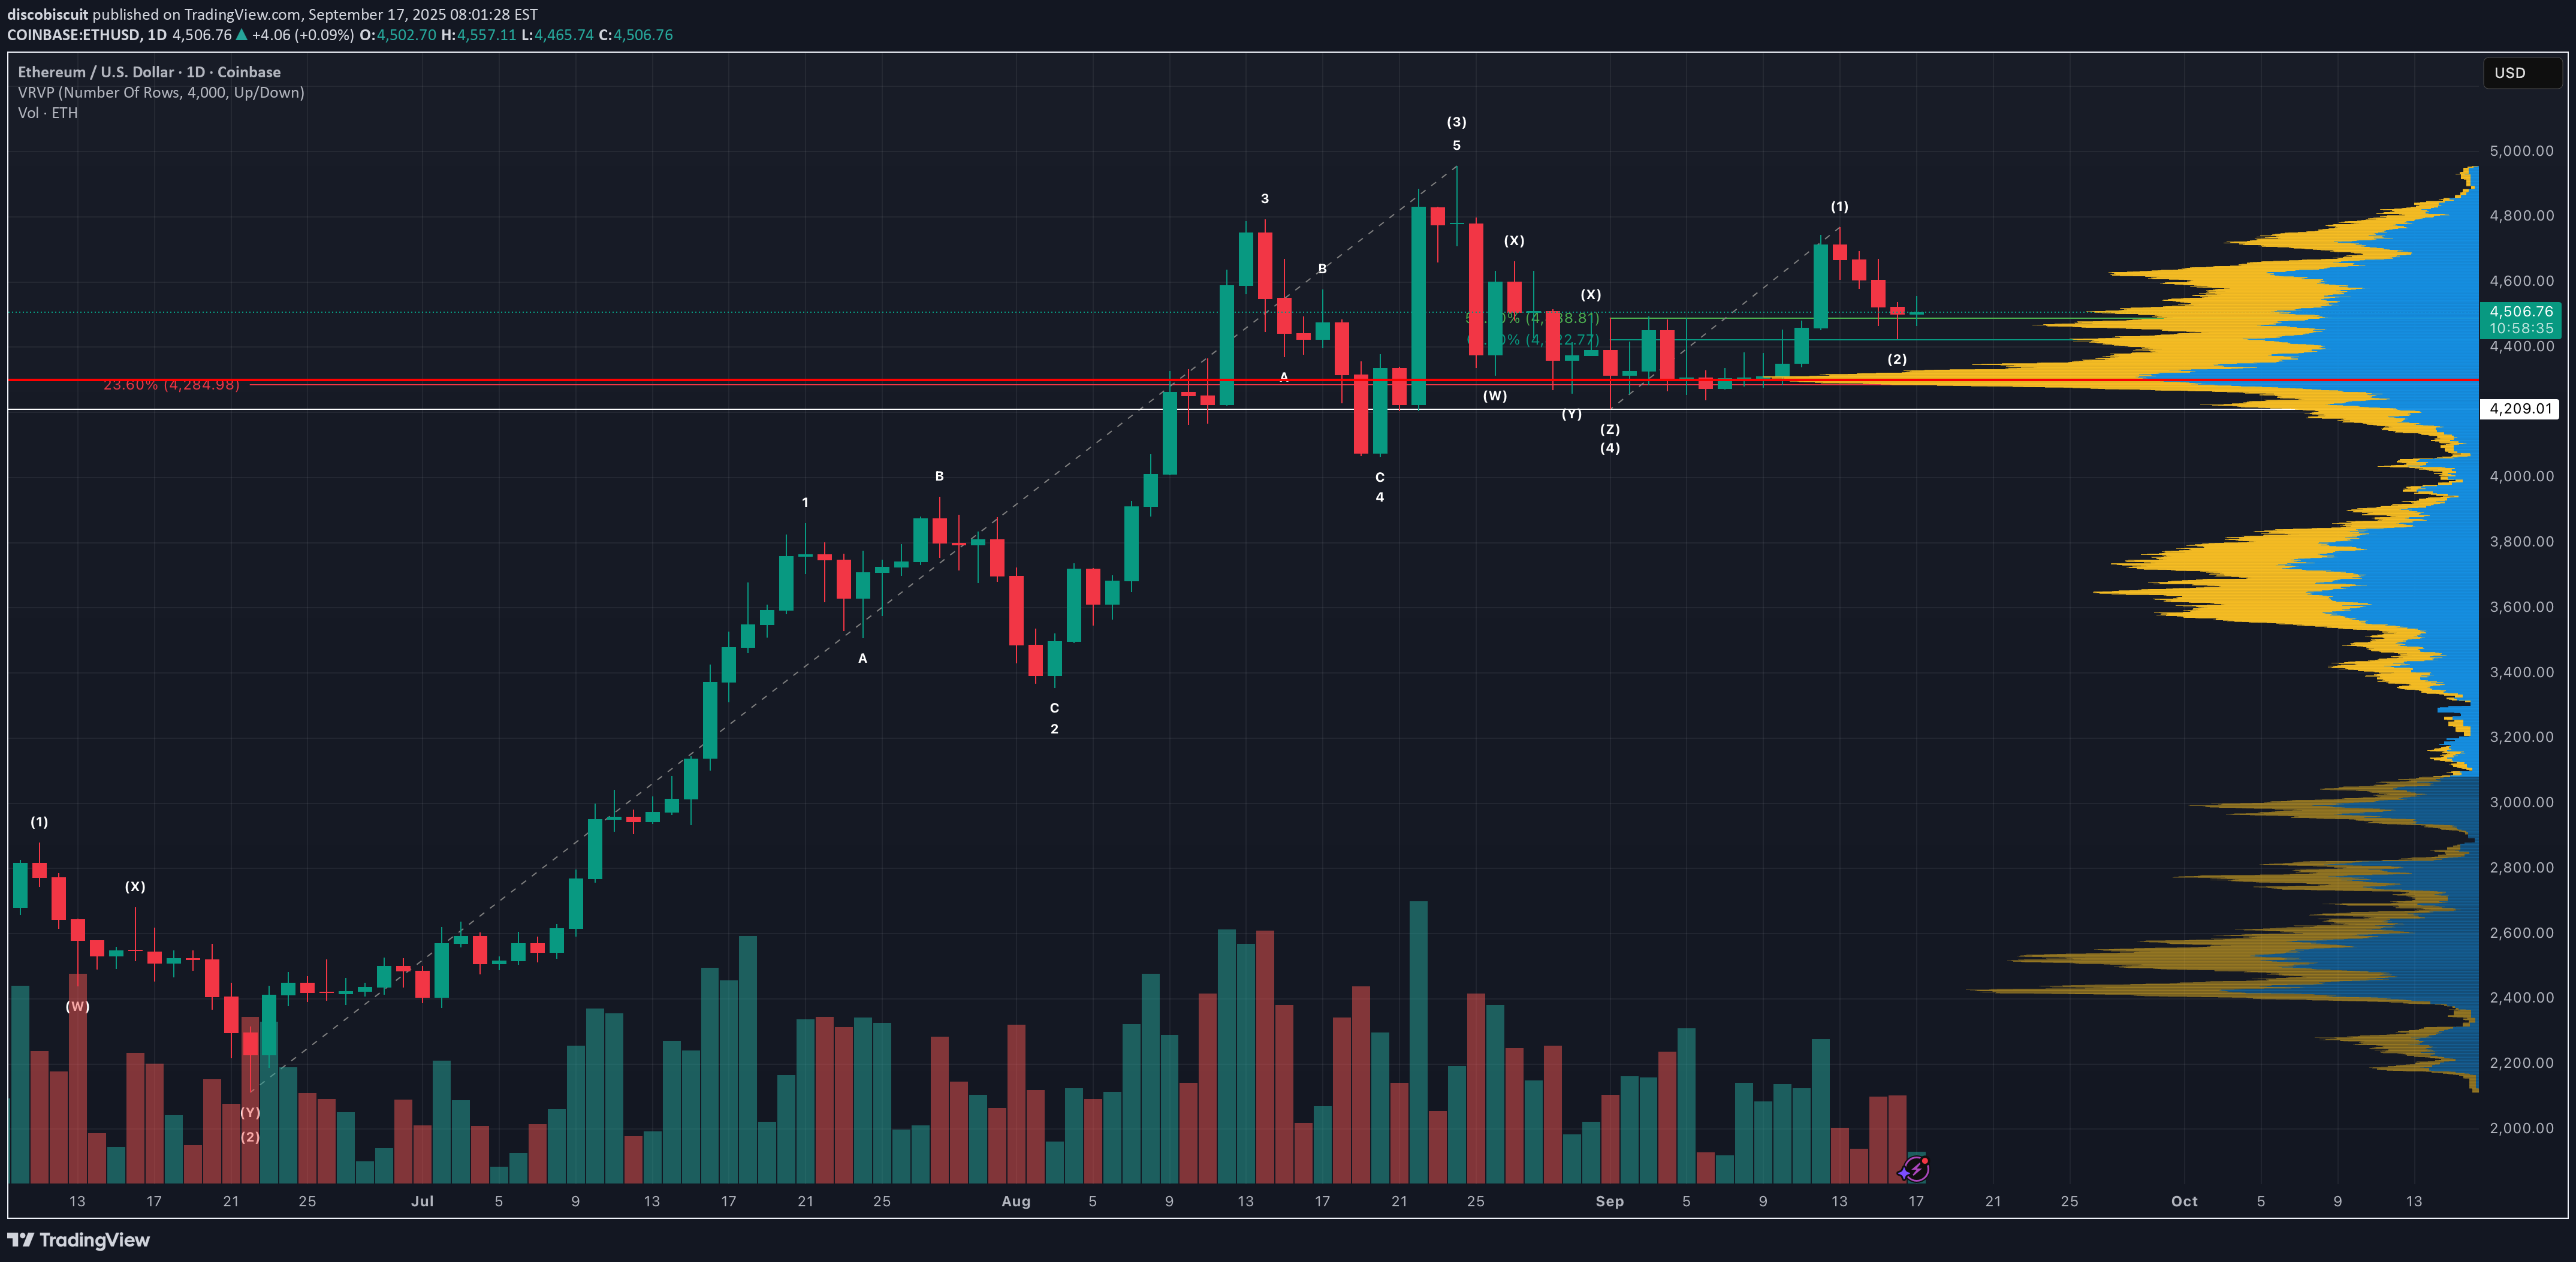
تحلیل صعودی بیت کوین (ETHUSD): هدفگذاری قیمت در محدوده 6500 تا 7000 دلار!
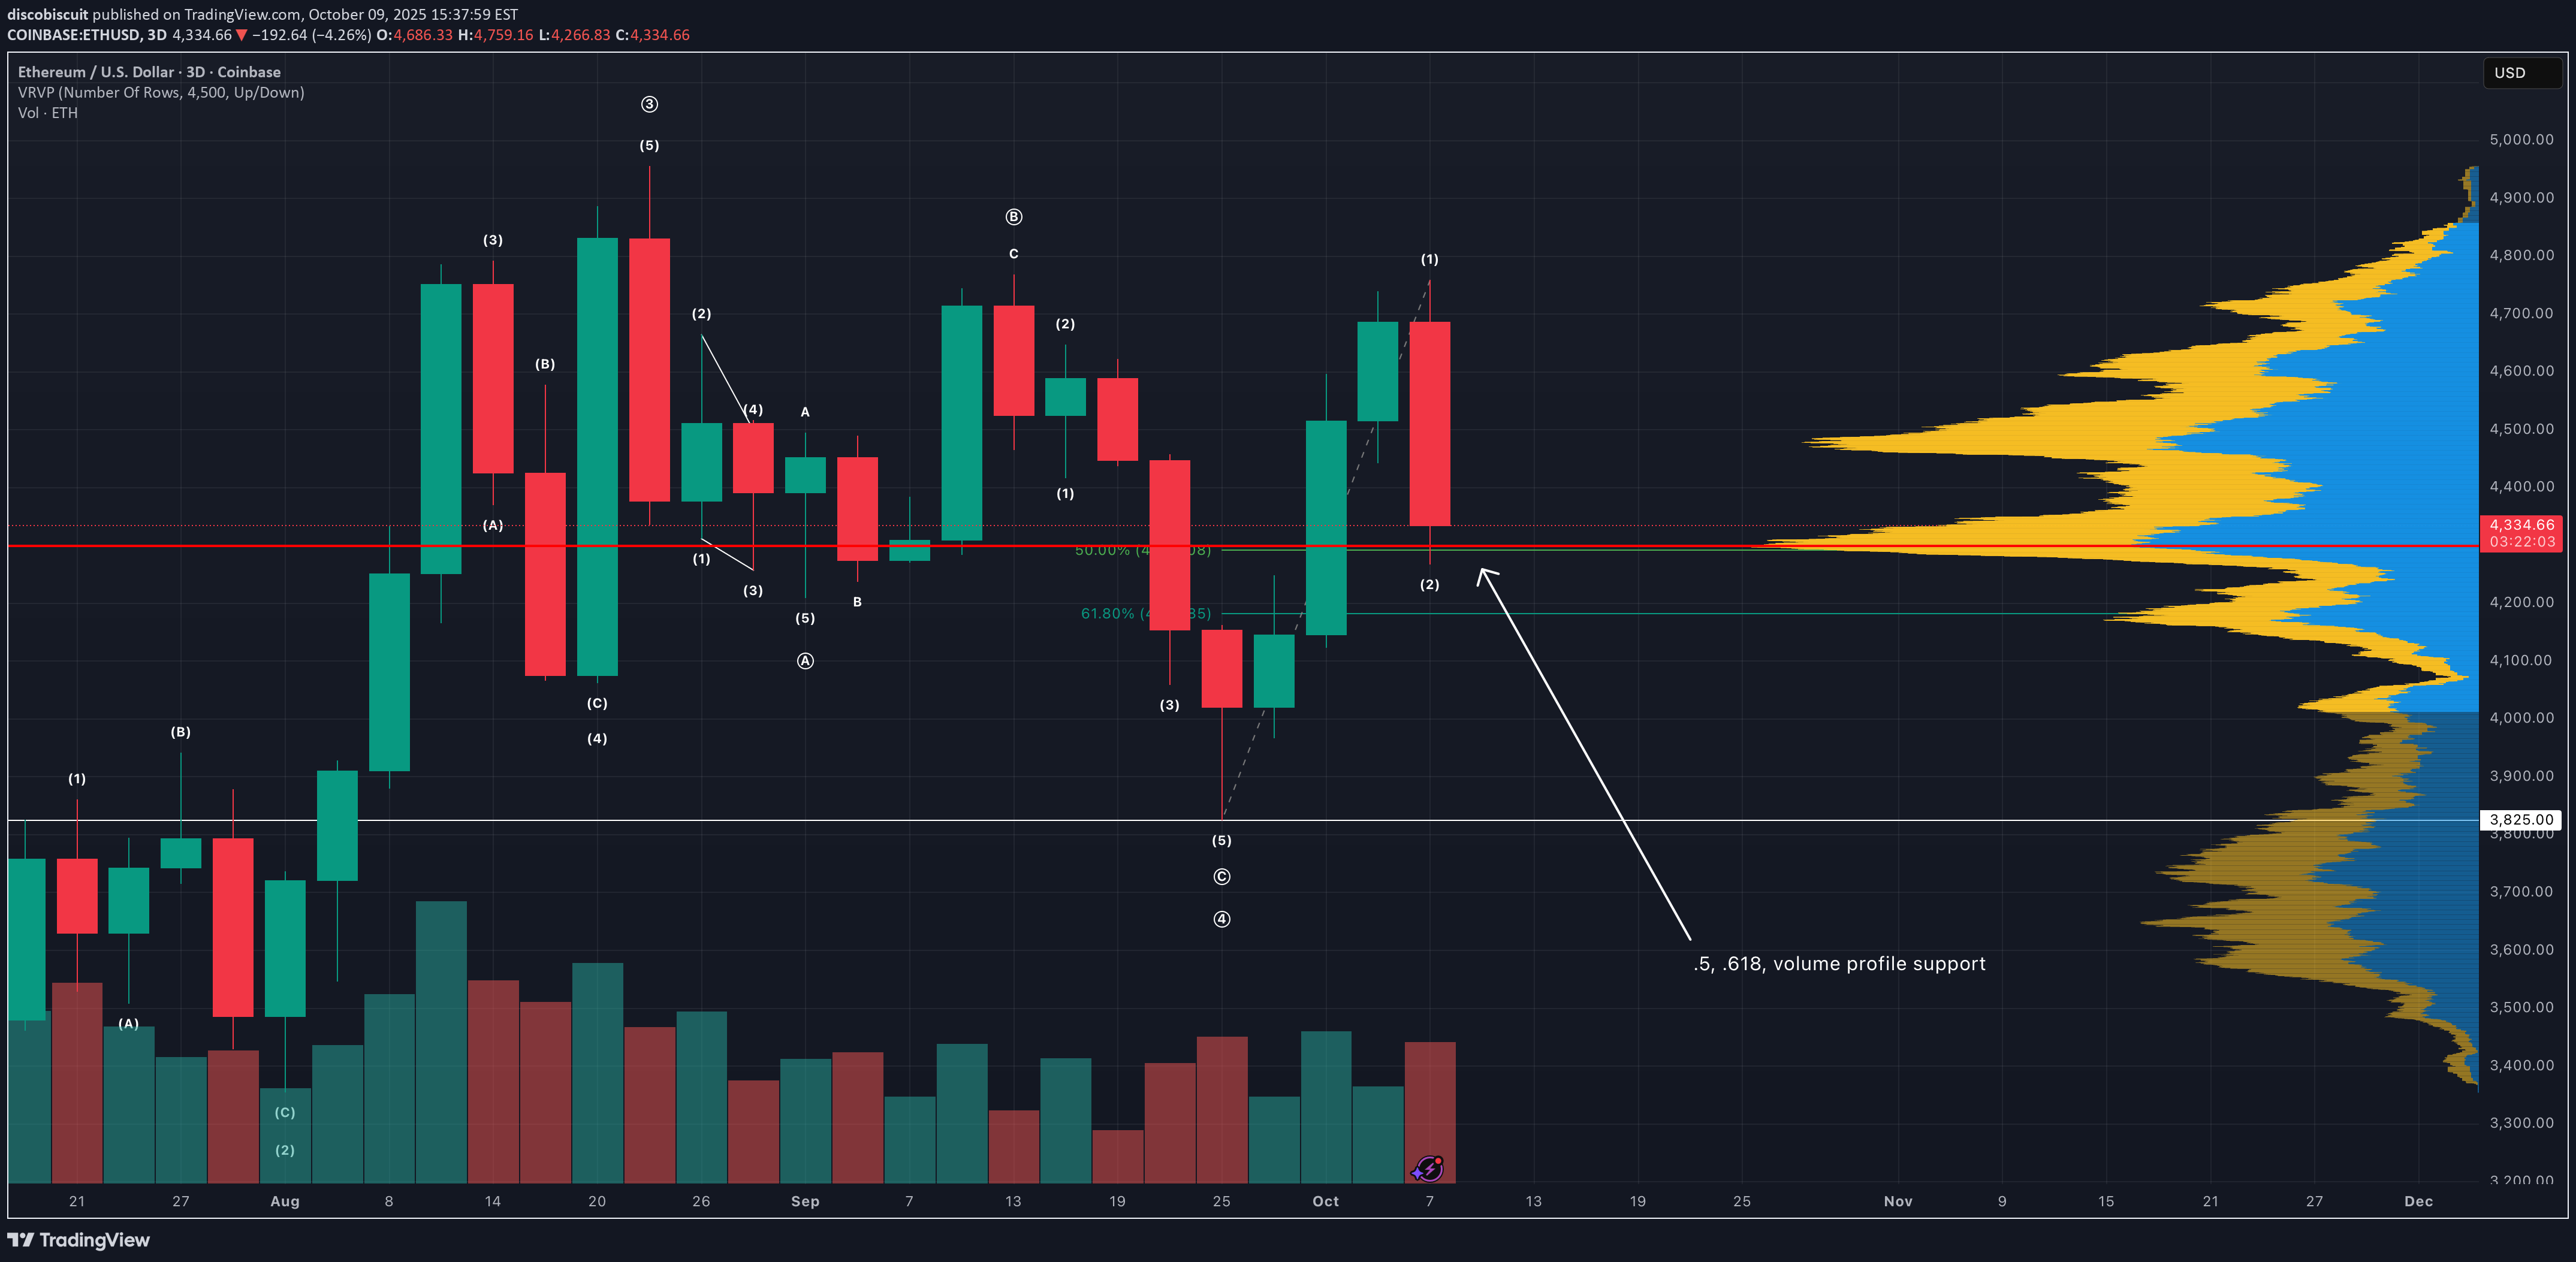
Bullish count for ETHUSD. Count envisions price in wave (2) of ((5)), looking for price/wave (3) to find support off of .5, .618, and volume profile point-of-control. If correct, looking for wave ((5)) of iii to complete in the 6500-7000 area. Count valid above 3825.
discobiscuit
ETHUSD bullish analysis
Bullish analysis of ETHUSD. Looking for wave ((5)) of iii north of 6k. Let's go!
discobiscuit
S&P/Nasdaq bearish case
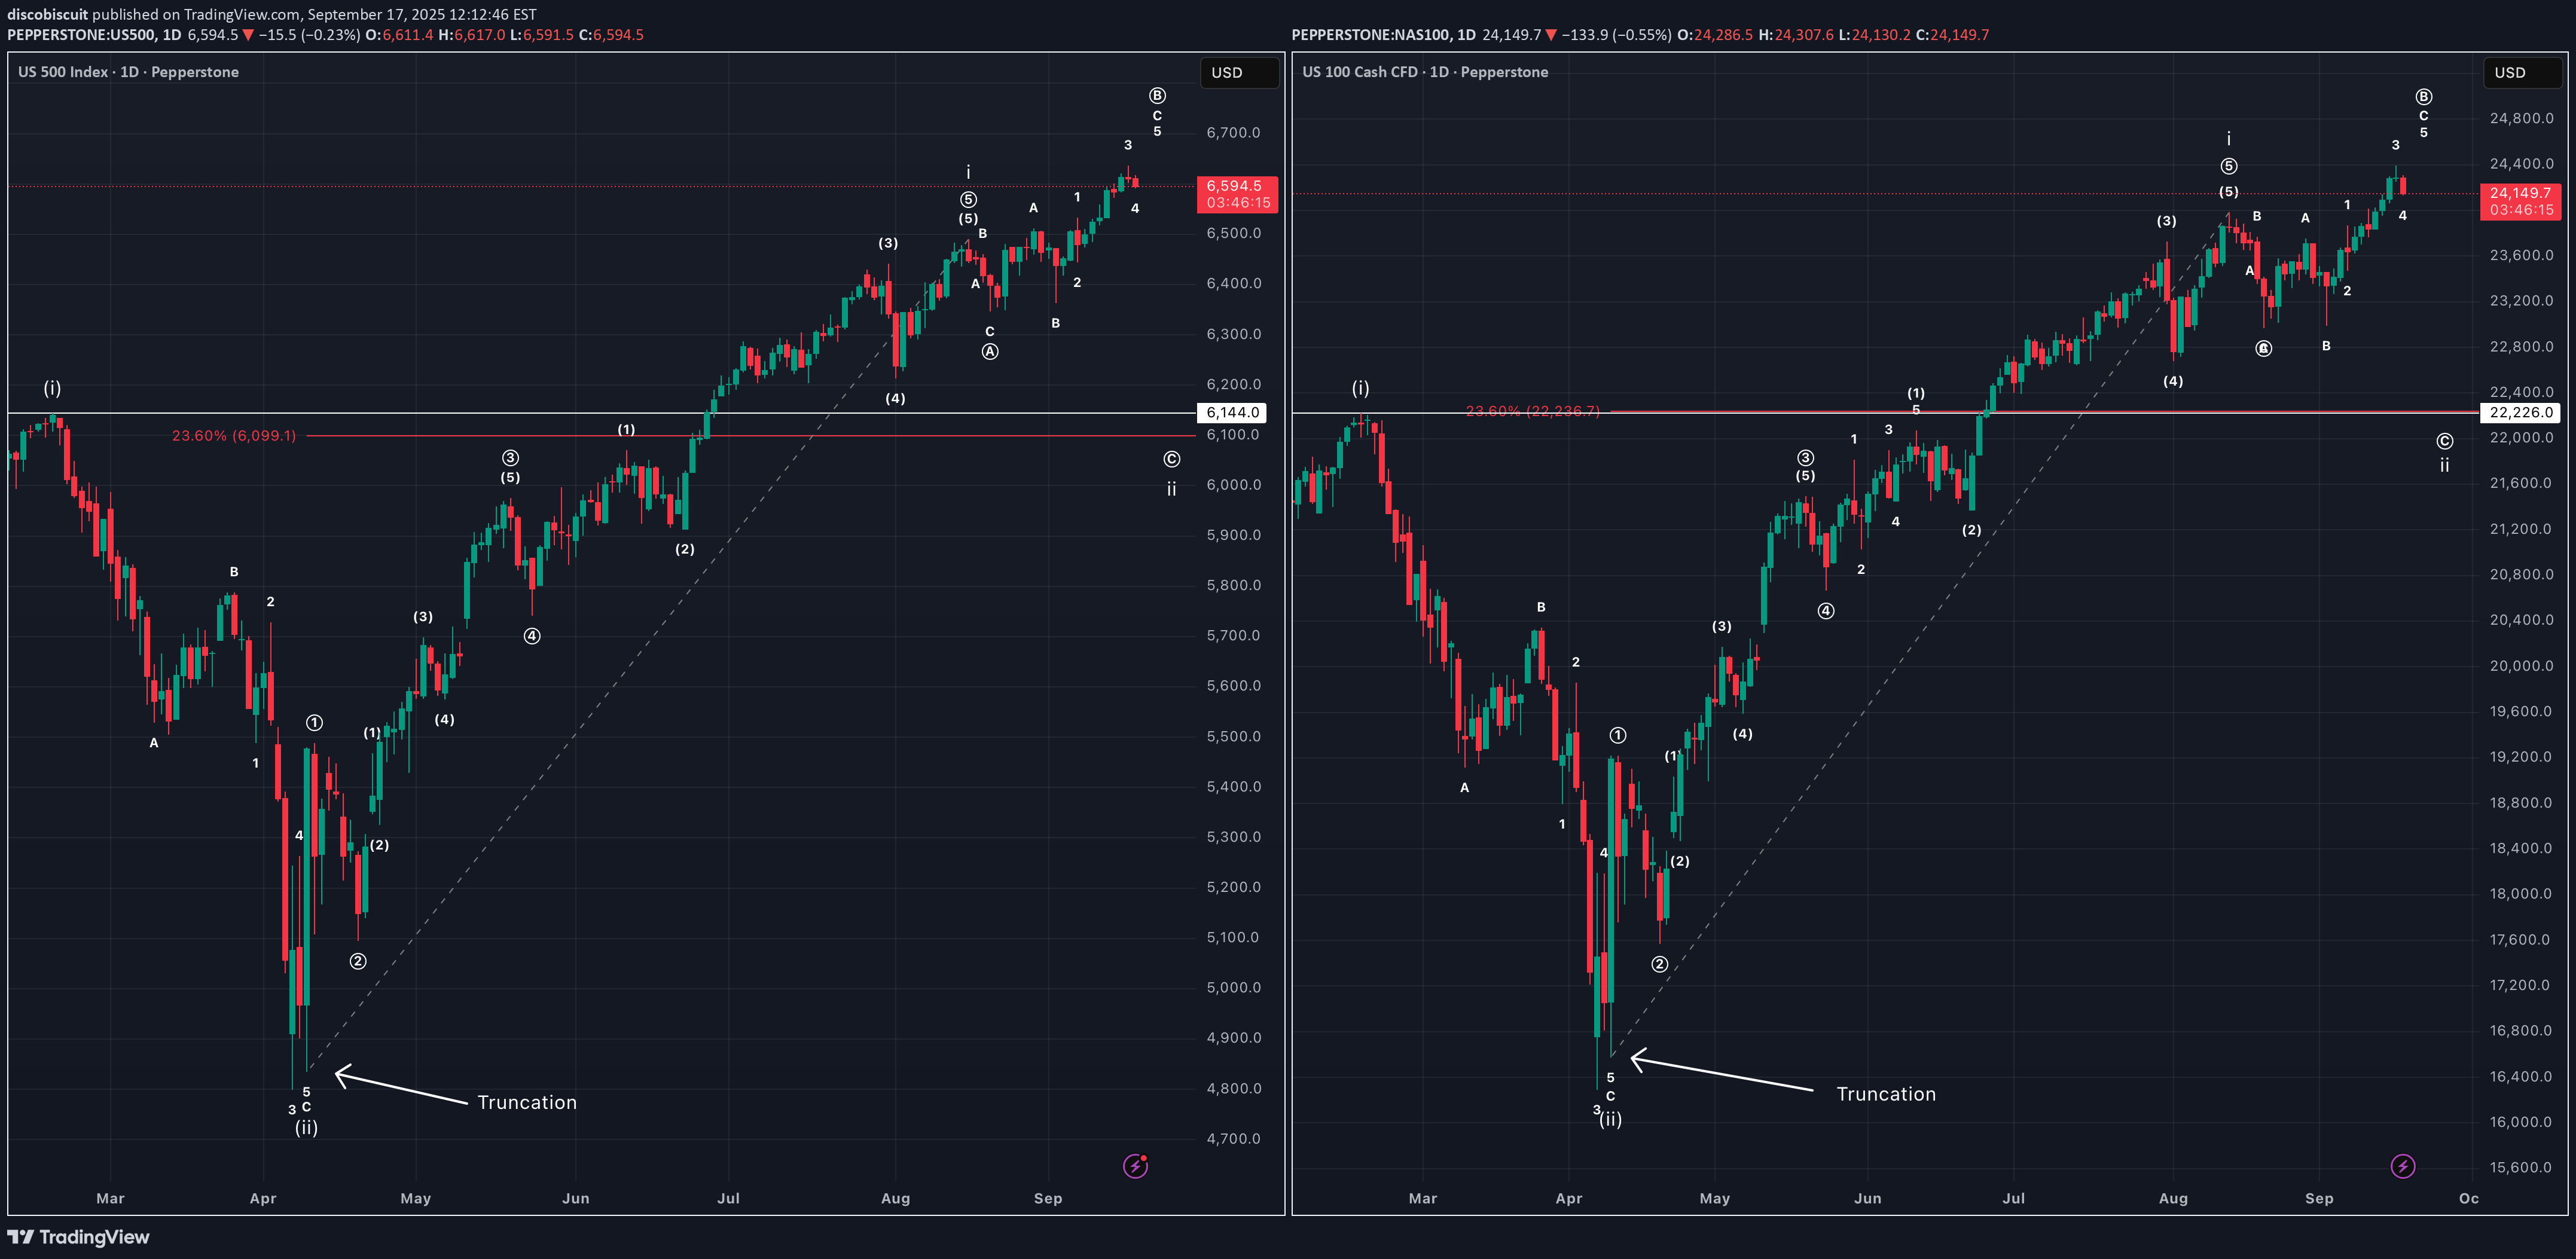
Bearish case for equities today: This count has short-term pain for long-term gain. Looking for initial pump, then dump over the next few days, target buy below 6144 for S&P and 22226 for Nasdaq. If correct, VIX (UVIX) should pop.
discobiscuit
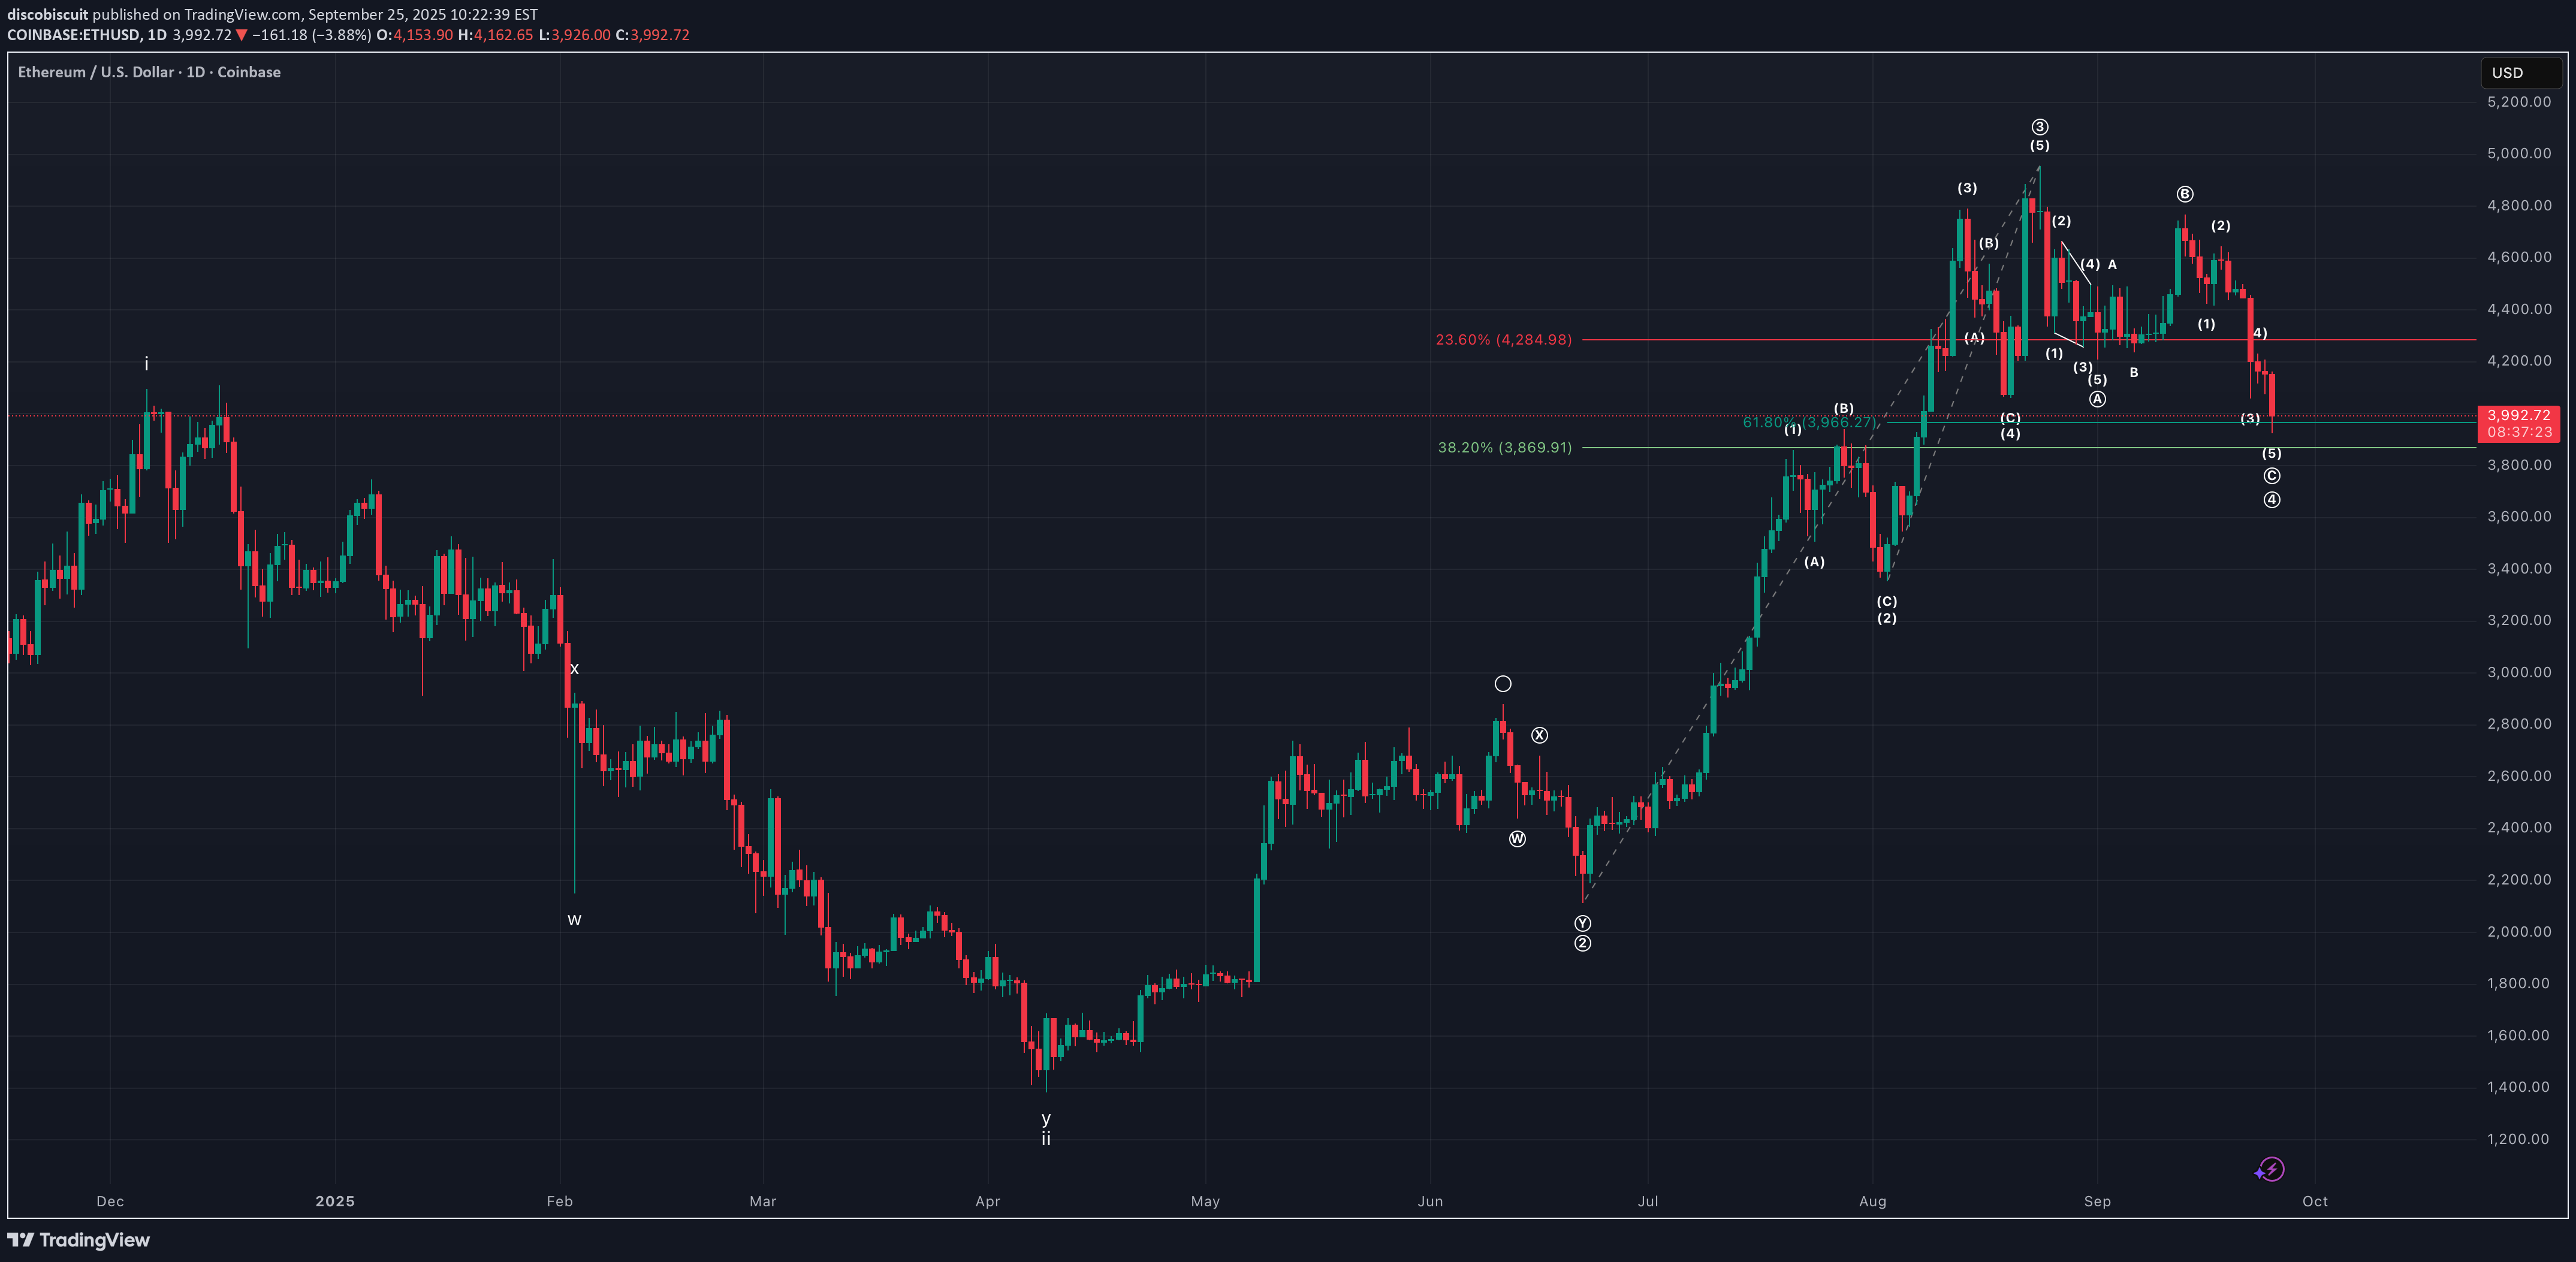
ETHUSD, bullish short-term case
Bullish case for ETHUSD. This Elliott Wave count has price in wave (5) of ((3)) of iii. Wave (4) retracing to 4 of lesser degree, .236 from (3) to (2). Current price sitting at .5-.618 support, with volume profile point-of-control providing support at well. If this proves correct, target wave (5) completion above 6500. Analysis invalid below support of 4209.01.
discobiscuit
BTCUSD bull and bear analysis
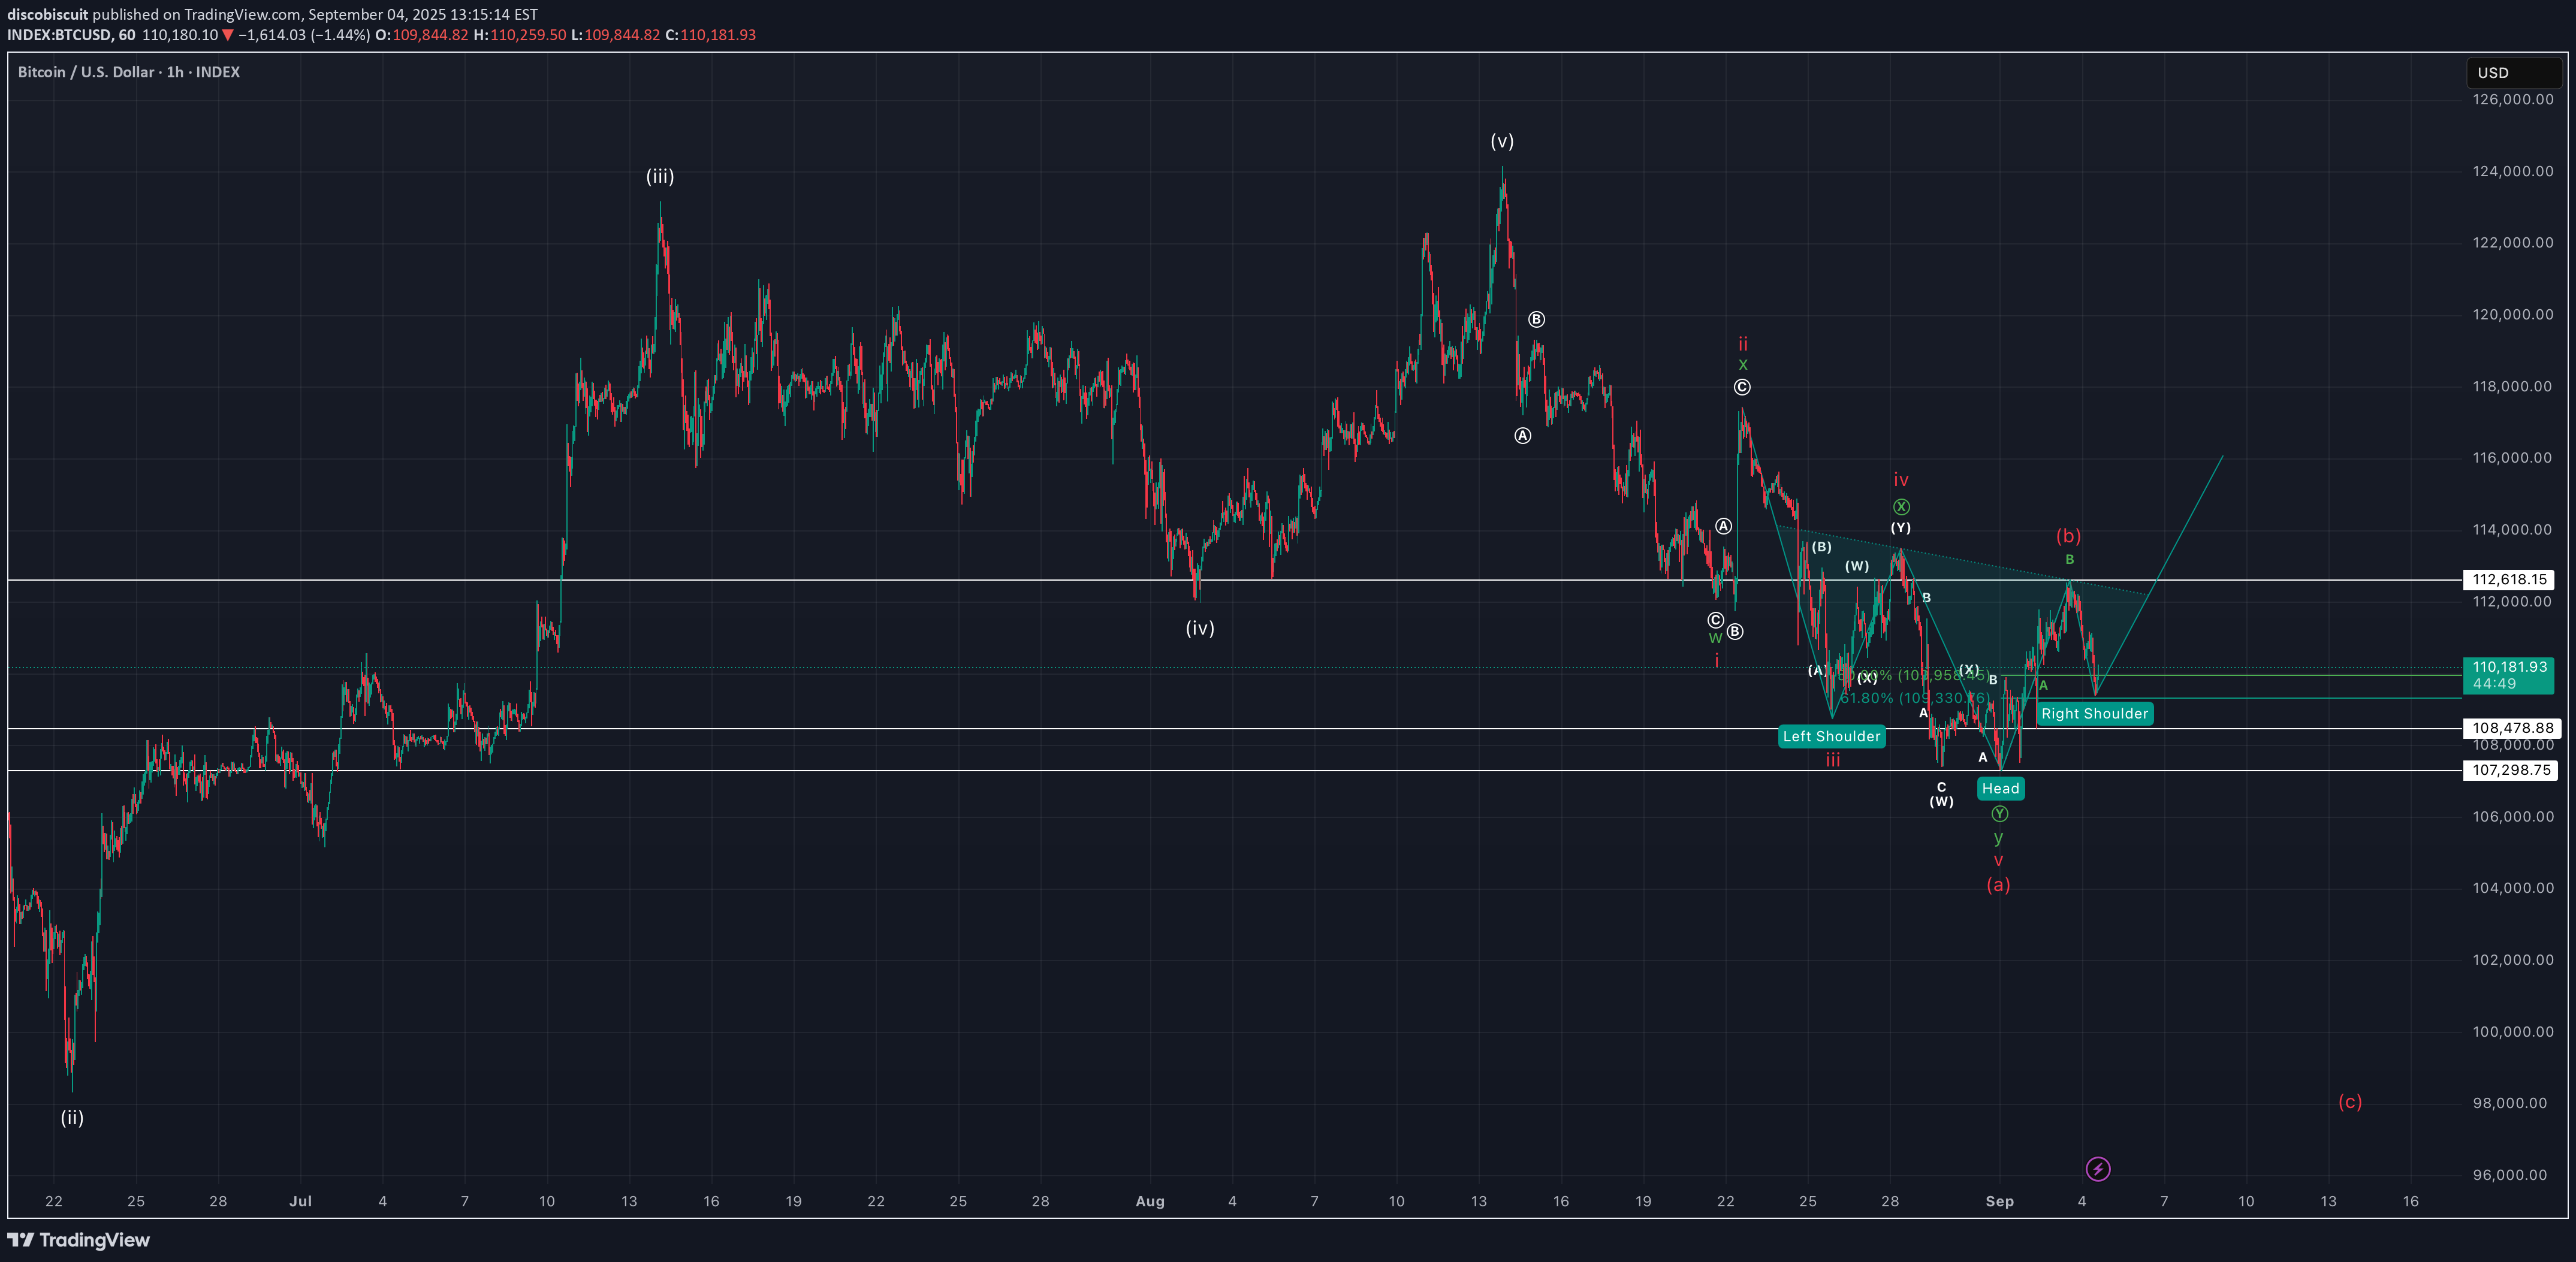
Bull and bear case for BTCUSD. Bulls see completed double-three (in green), with bottom of 107298.75 in place, inverse head-and-shoulder pattern, right shoulder off .618 fib pull, key resistance at 112618.15. Bears see leading diagonal (a) (or (1) if even more bearish), (b) correction complete, key supports of 108478.88 and 107298.75 breaking on impulsive price action to target sub 100k. Leading diagonal is technically correct but not the prettiest.
discobiscuit
BTCUSD Elliott Wave Analysis
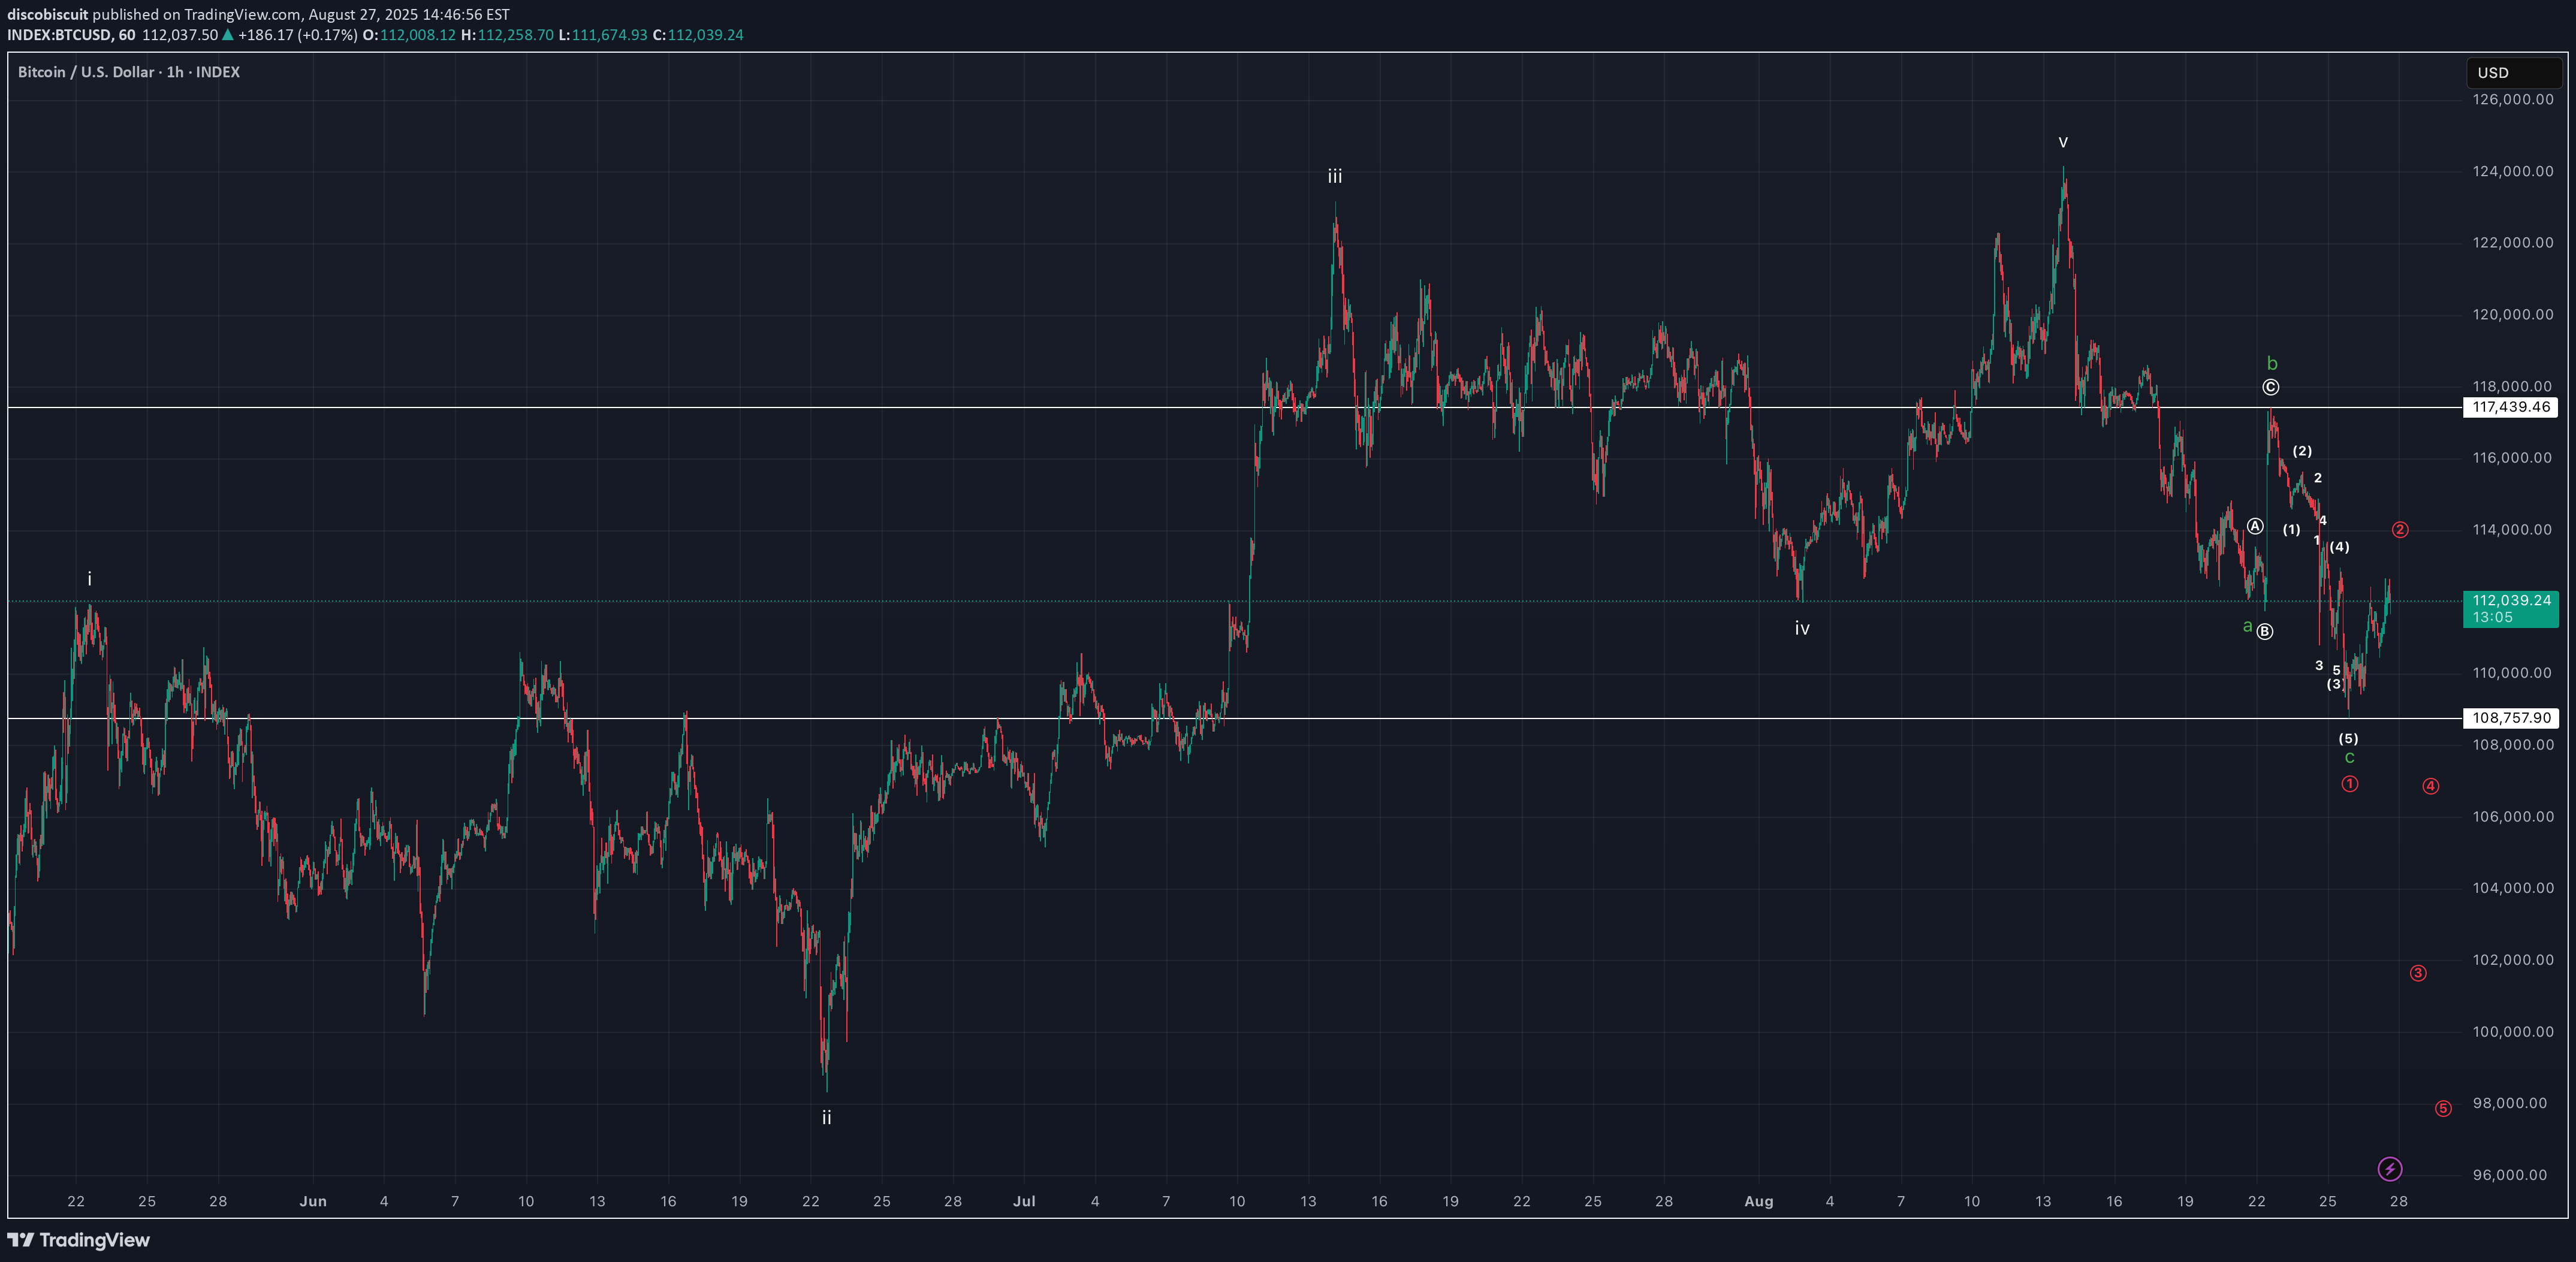
Bull and bear analysis of BTCUSD. For simplicity, I have a completed impulse off April 2025 low to ATH. Bulls see a zigzag correction completed (green), key support 108757.90 and break above 117439.46 providing some confirmation. Bears see continuing impulse price action to downside, with 117439.46 holding as resistance and 108757.90 breaking as support.
discobiscuit
Bull and bear analysis for BTCUSD
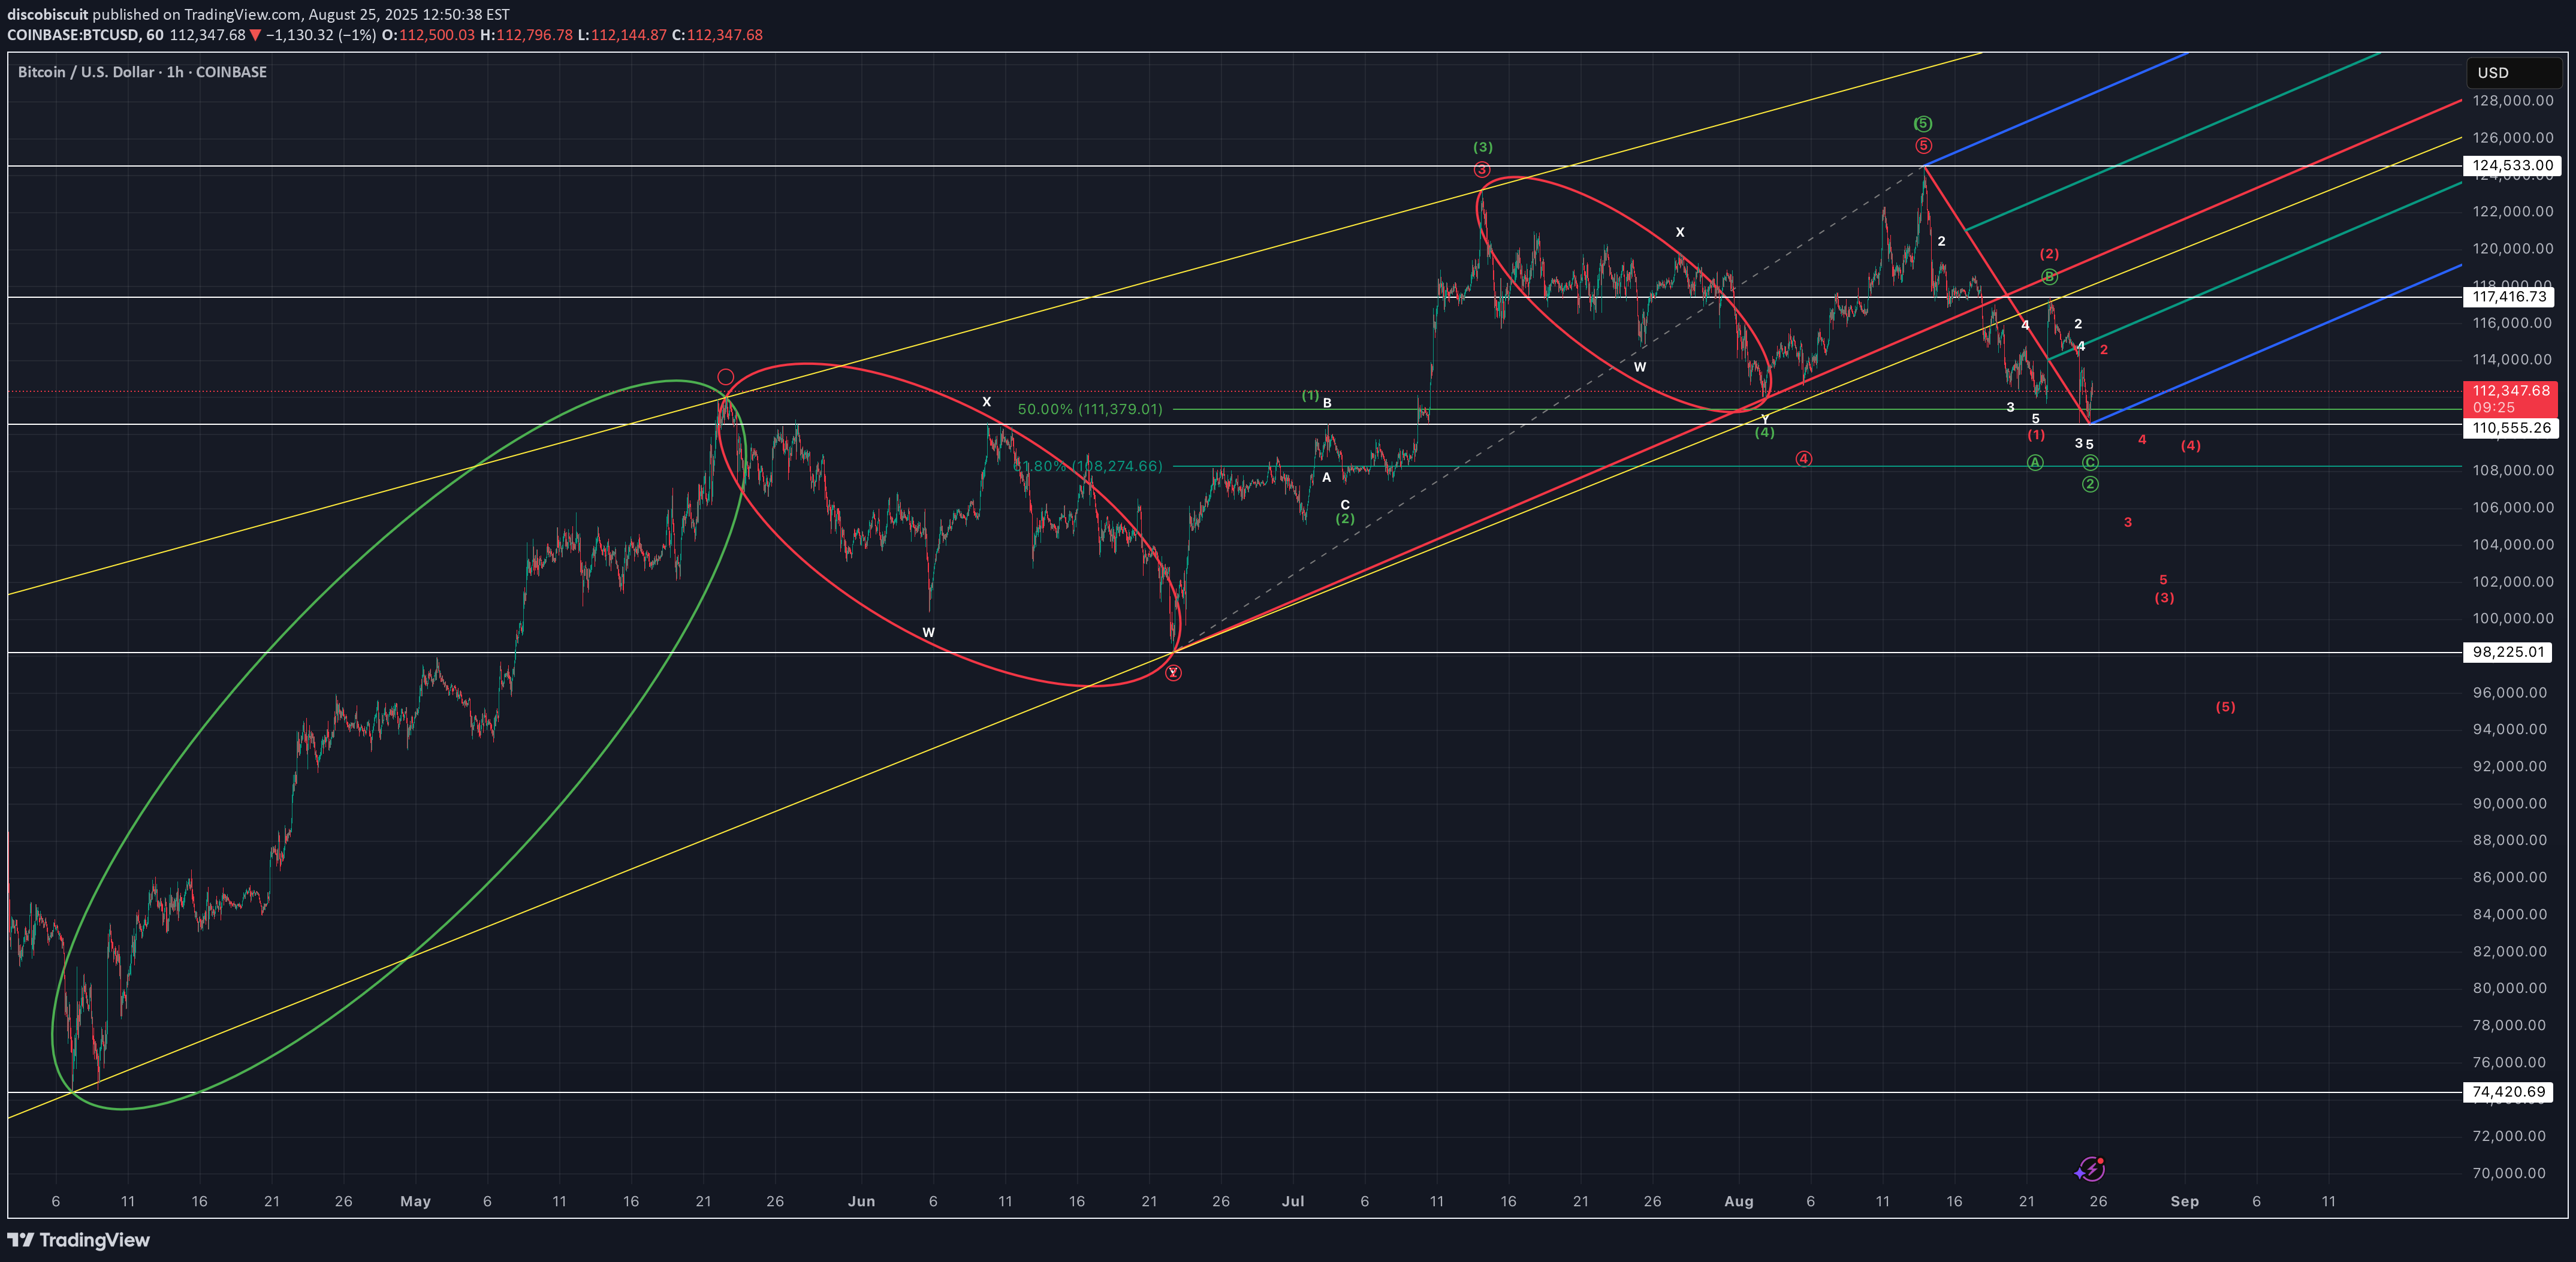
Bull (green) and bear (red) analysis for BTCUSD. First, the bear case sees an ending diagonal off April low of 74.420.69. I think this is less likely than the bull case because 1) wave ((5)) of the ending diagonal did not throw over the wedge and 2) wave ((2)) and ((4)) are both double-threes and thus violating the rule alternation. However, if correct would see continuing impulse waves down breaking 110555.26 and 98225.01. 117416.73 needs to hold as resistance in this scenario. I think the more likely case is the bull case, with a 1/2 1/2 looking for wave ((3)) towards the 150k area. Price bouncing off .5 fib, high probability area for a wave ((2)), key support at 110555.26; this could break down and set up for a deeper wave ((2)). Break below 98225.01 would violate bullish case. Bulls need to break above 117416.73, 124533, and 136909.74 to support this count.
Disclaimer
Any content and materials included in Sahmeto's website and official communication channels are a compilation of personal opinions and analyses and are not binding. They do not constitute any recommendation for buying, selling, entering or exiting the stock market and cryptocurrency market. Also, all news and analyses included in the website and channels are merely republished information from official and unofficial domestic and foreign sources, and it is obvious that users of the said content are responsible for following up and ensuring the authenticity and accuracy of the materials. Therefore, while disclaiming responsibility, it is declared that the responsibility for any decision-making, action, and potential profit and loss in the capital market and cryptocurrency market lies with the trader.