
derahmanov
@t_derahmanov

What symbols does the trader recommend buying?
Purchase History
پیام های تریدر
Filter
derahmanov
derahmanov
BTC New Bull Market 99% Confidence

99% Confidence It is now official that BTC has started its new bull market cycle after a confirmed weekly candle close above 25.5k. Major Wyckoff accumulation phase is over, now is the time to mark up the price. Elliot Wave analysis also confirmed that the whole move in the last quarter is a new cycle wave 1. And price has already made weekly candle close above 50/200 EMA and 200 SMA, a very convincing move. BTC can still go up somewhere to 30-37k and then stop, next it will make a corrective move of cycle wave 2 for 6-8 months and land above major Wyckoff accumulation trading range, so it will be somewhere at 25-27k or maybe higher. The low of wave 2 will be the third best time to buy. So wave 3 is around Q4 2023-Q1 2024. I still amazed by how BTC can still going up and stay in its traditional cycle despite all the odds that conventionally only gold survived. And even now BTC strongly inverse correlated with SPX, a decouple phenomenon, maybe only temporary.
derahmanov
Wyckoff BTC almost take off

If the price breaking out from the box or making an SOS, BTC will go higher to 34k, a wave 1 of the whole new cycle
derahmanov
How Wyckoff & Elliot Wave Theory applied together

Maybe this near "full-stack" technical analysis using Wyckoff and Elliot Theory along with relevant indicators such as Moving Average and Cumulative Volume Delta (CVD) will puzzled some of the traders who used to have a simpler analysis on the market. But to those who curious this is something that is really interesting to know. The chart above is showing us how the two theories can be complementary to each other. Lets analyze the chart above of BTC/USD in 4h timeframe from left to right comprehensively based on the Wyckoff phases of the 2nd accumulation model. Phase A: During the early November of 2022, BTC was under heavy sell-off after Binance dumping hard on FTX where the price crossunder 200 EMA and 100 SMA. The waterfall crash of BTC was printing a 5-wave of zigzag wave. We can see that the lowest point of wave 3 shows the highest selling volume in a single 4h HA candle and also act as Preliminary Support (PS) where then I put the 1st support line there. The sell-off continue to form the last zigzag wave where we can see multiple high selling volume bars and made a very deep negative cumulative volume delta in which it represents as Selling Climax (SC) in Wyckoff. A massive buying then occurred which immediately push the price back up to the wave 4 of zigzag wave area, which in Wyckoff we can name it as Automatic Rally (AR). By using these to extreme high of AR and low of SC we can draw a rectangle to have a better view on the consolidation area. After the dramatic push and pull of price, the market volume gradually decreasing followed by price having a contracting highs and lows, forming a classic contracting triangle, where we can see some of the lows are respecting the 2nd support line. Phase B: The end of contracting triangle followed by another zigzag wave of smaller degree, where it breaks the 2nd support line and creating the second lowest low which we can name it as Secondary Test (ST) that the selling volume is much smaller hence also creating a shallower negative CVD. Price then go up back to the 2nd support line and able to reach back to 100 SMA although still not able to candle close it on the first attempt but eventually able to close it on the second attempt. Price then going on a small rally creating an ascending channel of 5-wave leading diagonal and able to close above the 1st support line, the 200 EMA and even able to make a higher high. But the volume is still not enough to make a change of character breakout. Phase C: The mini rally is identified as the 1st wave of primary impulsive wave, so the reactionary move where the price breaking down the ascending channel, the 1st support line, 200 EMA and 100 SMA and going back down to the 2nd support line can be identified as wave 2. Most of phase C volume going under the Volume Mean Level, it is the lowest volume of all of the phases. Combination of multiple minor corrective waves creating a WXY wave and we can see the 2nd support line is holding the price quite well where it represents as Last Point of Support (LPS). Phase D: The volume and price gradually moving up and able to close above 100 SMA and 200 EMA, then going higher to 1st support line with higher volume to a point of Show of Strength (SOS) where a change of character breakout is formed and also breaking out from the box or the whole Trending Range. Phase D is the perfect time to make an entry. The identifying of the first two waves of an impulsive move also creating a high confidence that we are entering the wave 3 or we can also call it as the money wave. Phase E: Just enjoy the rally This whole chart actually representing a very textbook Wyckoff Theory of the 2nd Accumulation Model and we can also see in this chart the transition between corrective wave and motive wave of Elliot Wave Theory. In Phase A and the early Phase B, the corrective wave is on its end, where the rest of the Phase B to E we can see how the scaffoldings of early structure of an impulsive move is constructed. making a consolidating of accumulation before going a strong trending move. Wyckoff explains this transition of corrective wave to a motive wave in a beautiful way and surely we can also use it on the transition of motive wave to a corrective wave using the distribution model. This is just one variation where we can use Elliot and Wyckoff hand in hand in order to have a much better technical analysis on the market and maybe this combined analysis that I made on the above chart could be the best scenario to apply for both theories. Hopefully this helps to educate for anyone of you who read this post, thank you
derahmanov
BTC Elliot Wave Analysis, Potential 18k!!!

Using Elliot Wave analysis, I think BTC currently is on minor wave 5 of intermediate wave 5 of primary wave A. Approximately the low will drop at the closest liquidity area at 21k , before it bounce back for the formation of wave B somewhere below 22k to 23% Fibonacci retracement level and dashed yellow line and could be making a wick just above 1D 200 EMA . I do expect it to go higher somewhere in 38.2% but I'm not so sure after BTC candle close under 1D 200 EMA , but we'll see. Next move after wave B, BTC will be making a waterfall drop for the formation of wave C. I put the potential low of wave C somewhere at 19.5k or the 2018 ATH, it can potentially go even lower as low as 17-18k. So we can expect a massive sell-off especially after CPI report which inflation expected to be sticky and hawkish FOMC meeting in the middle of March where I also expecting a major surprise from The Fed. My analysis in the highest timeframe still see BTC current move as cycle wave 4 and truncated cycle wave 5, as long as the price below that weekly ChoCh or 25.5k and not as cycle wave 1 or the starting wave of a bull market. So, I still expect BTC to make a lower low than 15k, could be somewhere at 8-12k in Q2 or Q3.wave A is complete, price hits 21k area, its a temporary bottom for now. Now is the time for reactionary wave of wave B somewhere below 22k, I would be surprised if it goes higher than that, it is still possibleTurns out price is going lower to 20k area, due to Silvergate fud, its a really strong and massive fud
derahmanov
BTC Outlook 2023 - 2027

BTC Outlook 2023-2027 (Revised) I think its almost confirmed with high confidence that this rally is bear market rally, not a rally of a new cycle that ends the BTC bear market. 25k is already its highest peak, it will going sideway for a while before resuming the drawdown to a lower level. Q1 2023 is one month left before it ends. This rally is the corrective move of wave 4 of the 4th cycle ABC move. After we have the truncated bull market of 2021, now we also have a truncated bear market. Its a textbook Elliot Wave cycle but its just not the ideal one. But it is the ideal one to model the current cycle. We can see that the peak of the current rally has touch multiple important moving averages. That's it, the unbreakable wall of the rally. Next move we will see again another massive drawdown, the wave 5, the last wave of the ABC move. My prediction is that BTC will be asking for a major support between 12-14k liquidity area, touching 1M 100 SMA and 50% of Fibonacci retracement level, and surely a weekly bullish divergence will be formed, and that would be the best time to buy before a new cycle started. Approximately the bottom will be formed around Q2-Q3 of 2023, but I think Q3 is preferable considering the macroeconomic condition. The identification of almost-confirmed-with-high-confidence wave 4 of ABC move also stating that the current cycle has been going a time period of more than 4 years tradition and still counting due to a longer bear market. The first time that BTC breaking this tradition after going 3 Elliot Wave cycles and 3 halvings. For the next cycle, we will have the first wave peaking between 32-37k, the 3rd wave peaking at around 2021 ATH and for the 5th wave, the blow off top will be around 130-170k. Let see if this post will age really well in the coming years.
derahmanov
BTC Outlook 2023-2025

Fresh new data and more information of significant factors brings me to a new deliberate prediction. The corrective wave that we are in is not a usual corrective wave. It could make twice as long as the two previous corrective waves in 2014 and 2018, an ABC move from a larger degree of Elliot Wave (Could be a wave 4 from the whole BTC movement since 2009). Currently we are in a bear market rally that potentially will bring BTC up to 25k, from there the corrective move will continue to the bottom which potentially at 8k in early 2024. I still believe potential Fed pivot will be around Q4 2023-Q1 2024 and inflation at that time will probably sits around 2-3%. 3% is good enough to restart the Quantitative Easing. Due to the longer corrective wave, 4th BTC Halving in Q2 2024 will occur in the 1st wave, not the same with the last three halvings that occured in the 3rd wave. This also means that we are approximately one year away from the beginning of a new bull market that potentially will make BTC going up to 140k or 1600% from 8k. Expect more business entities to collapse, more lay-offs and rising unemployment which also means rising in crime rates. Take care and survive!
derahmanov
Economic Outlook for 10-15 years ahead
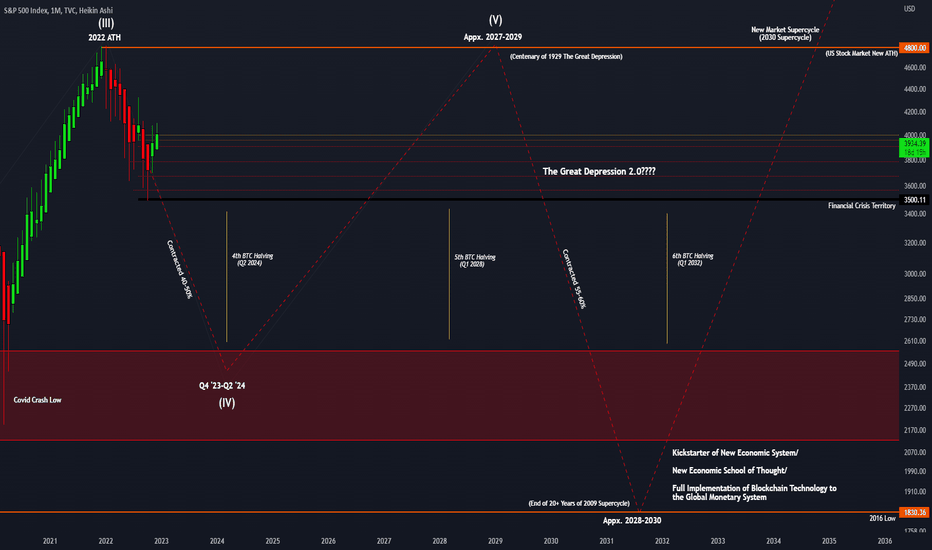
My Economic Outlook for 10-15 years ahead The rare double-dip recession October CPI report shows Inflation slightly decreased to 7.7% and The Fed already made a statement to decrease The Fedfunds Rate. Potential Fed pivot approximately will occur in Q1 or Q2 of 2023. That will be the time of disinflationary period or maybe we are already in by now. What to be expected in disinflationary period is stock market drawdown will continue, rising unemployment, more business entities will collapse, fewer job openings, in short 2023 will be dark especially in the US. Technically it is a recession. The good news is inflation can be pushed back to 2% area and from there QE can be restarted. Most people that already tired by long economic drawdown are strongly craving for bull market. Productivity will rise again along with its economic and secondary leverage and a creeping up inflation leaving the 2% area. An inherent nature of capitalism. The question is what will be the destiny of Petrodollar as its losing control over the total international trade volume. The rapid change of global power dynamics which spearheaded by BRICS+ economy has substantially diminish the Dollar hegemony. The regional powers that have control over the world commodities are grouping up to create a new, commodity-backed currency. In addition to that there is a strongly rising tension between Russia and NATO. More than 50 years ago, the US left the Bretton-Woods System and to keep the US dollar relevant as global reserve currency, Petrodollar was introduced and rapidly embraced by the OPEC which consequently making the US Dollar became the world's most traded currency. That is the underlying value of the Dollar besides of debt. But the current astronomical $30+ Trillion of government debt and the weakening of Petrodollar globally has come to a critical question of what will be the next US decisive move? Chaos has to be applied first to disrupt any potential challenger to the US Dollar, and from there a revolutionary economic policy has to be implemented. Worst case scenario is the new Great Depression can manifest after almost 100 years since its first occurrence in 1929. Note: This economic outlook which also the same with any version of economic outlook is subject to a high degree of uncertainty. This post is mean for educational purpose only.
derahmanov
Finding the bottom

Elliot Wave analysis shows that BTC is in an impulsive bearish move of C wave of weekly ABC correction. I think 20kish bottom from a technical perspective has a higher probability, but the current economic environment especially in the US does not incline into that option. The newest Consumer Price Index (CPI) report of May 2022 that just released yesterday is not a good news. US Inflation keeps on rising at 8.6%, the highest since 41 years of US economic history. U.S Dollar will be force to be taken from the market circulation by raising interest rates. Economic recession is inevitable and could kill significant amount of businesses, lowering people purchasing power, and forcing them to only allocate money for primary needs spending. Don't know how much is enough in raising interest rates in order to control inflation without hurting too much on the economy. In this kind of economic condition, there is a significant probability that BTC could fall to 12k level, although I do not inclined into it, but let see what the market provide us in the near future.
derahmanov
RVN/USDT

Hello Traders, RVN has already launch from its major support at 0.09 and heading towards another key level at 0.11. Bat structure is spotted and currently RVN is moving at the right wing of it which at the same time is following its 3rd wave. Let see if this bat harmonic pattern that coincide with Elliot wave works out. RSI is already above 50 line and the MAs are in good uptrend formation. Buy: $0.09-$0.1 TP1: $0.13 TP2: $0.149TP1 hit
Disclaimer
Any content and materials included in Sahmeto's website and official communication channels are a compilation of personal opinions and analyses and are not binding. They do not constitute any recommendation for buying, selling, entering or exiting the stock market and cryptocurrency market. Also, all news and analyses included in the website and channels are merely republished information from official and unofficial domestic and foreign sources, and it is obvious that users of the said content are responsible for following up and ensuring the authenticity and accuracy of the materials. Therefore, while disclaiming responsibility, it is declared that the responsibility for any decision-making, action, and potential profit and loss in the capital market and cryptocurrency market lies with the trader.