derJessie
@t_derJessie
What symbols does the trader recommend buying?
Purchase History
پیام های تریدر
Filter
Signal Type

derJessie

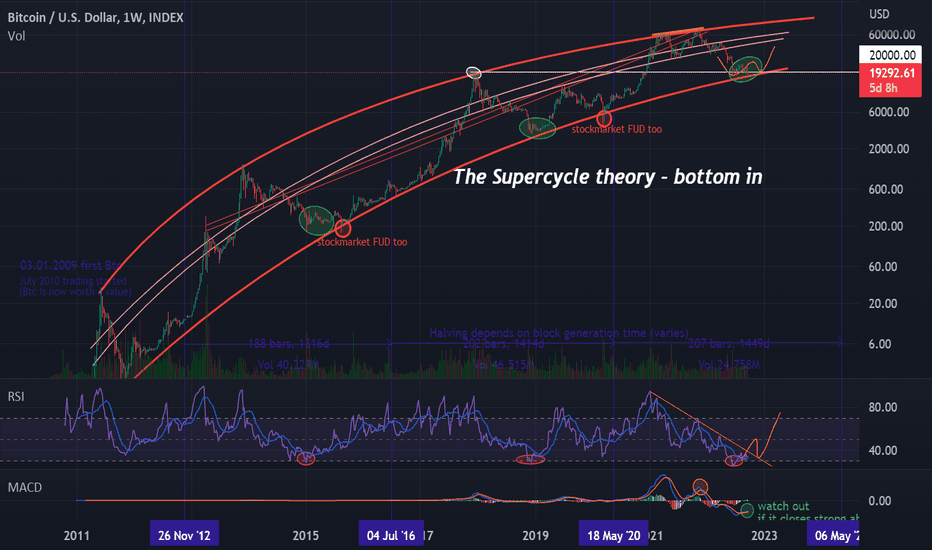
Bitcoin Supercycle theory - bottom in Bull theory – Bottom is already in for Bitcoin BTCUSD There are severeal technical indicators and measurements that suggest it could be. Firstly, the 50-week MA already crossed the 100-week MA. Each time this occured, the bottom was already in, both times as the weekly RSI dipped into oversold conditions. The price behavior has also been similar to the 2014 bear market for months with a drawdown of -53% below the 50-100WMA. (-But there is more time for that special fractal in another post.) Secondly, this current level happens to be a 0.786 Fibonacci Retracement of our entire run up from Covid-19 to the November top in addition as it is the support oft he previous all time high(2017). Furthermore sitting right now on the weekly 300MA. The Fear and Greed Index has only registered prolonged periods in Extreme Fear(below 10) as we have witnessed at the 2018 capitulation bottom and the 2020 Covid-19 selloff. Therefore the capitulation happened in June, with Luna (+UST), the depegging of USDT, 3AC, blockfi, Celsius… which are all max fear events. But everyone is now expecting 13-15k thinking we are in the middle of a bear market rally. While the GBTC Grayscale Bitcoin Trust value sitting already at chart comparable 11k. From technical analysis we couldn’t have bottomed more. Even on chain indicators signal the bottom is near. NUPL, RHODL Ratio, Puell Multipli, Entity adjusted Dormancy-Flow, MVRV-Z Score, 2Year MA Multiplier, CBBI-Bull Run Index. We have already seen arguably the most extreme network capitulation in Bitcoin‘s history, with now also a Hash Ribbons blue ball on the daily timeframe. Bitcoin is trading at a fair value. I am still hoping for an expanding flat 3-3-5 elliot wave correction, a double three WXY pattern, or even a simple overshooting B of an ABC. But if that 17,6k gets structural taken out we are not talking about recession but deflationary depression and just the start of a longer bear market. Fortunately the global narrative is shifting. People are now saying we are going into a deep recession. CNBC‘s Cramer saying to avoid all speculative investments like crypto, while the worst is priced in already. It starts to look like the main worry is becoming recession with deflation and not inflation now. That idea gets strengthened by US-CPI showing a second month of decline. Based on the 5-year break-even inflation rate, a leading indicator, it can already be said with certainty that we have seen the short-term peak in inflation. And that inflation is expected to recover further through 2023. Keep in mind every time inflation tops - Stock market rallies! Once the consumer price index print comes in significantly lower (September~7,9% but October ~7%) the stage will be set for a Powell flip flop. FED pivots systematically lead to strong rallies. So November FOMC potentially for a midterm or year-end Christmas rally. This means that the Fed will step back on better CPI-data and inflation will eventually start running again in 2023. Nobody does see a fruitful future for investments right now. To trick the retail there is no need for a positive narrative so everyone keeps being bearish. Only technical analysis matters. Afterwards we will see what the news catalyst was. Btc may range more than equities first, then rotation into more risk happens later. Hence Bitcoin Dominance will rise and Altcoins will pump after Bitcoin. But Btc is not yet in a multi-year bear market within its 4 year cycle because BTC.D would be at that point much higher while we are seeing new 4 year lows. Something is different. As a trader you have to adapt the possibilities. Invalidation of that bull scenario if we set a new low in Bitcoin. Then there will be much bigger problems in the market. So all eyes on the DXY and the behavior oft he FED, because Btc is at this time just the risk-taking follower of Nasdaq and SPX. Special greetings to Blockchain Backer, following him for almost a year.Comment: Nothing changed, BTC still in the range. Oscillators show it may take a while. My beds are that 17.6k will be the bottom if the global economy will allow that to remain true in the next months. My advice, don't listen to fud from the news around you. Stick to your plan and don't forget every Wyckoff Accumulation has a spring (at least a second test of that low). At 18k there are a lot of liquidations, stay alert.Comment: In the last few days we have seen another media capitulation event. First the dispute between Binance(CZ) and FTX(SBF) and then the unreal bankruptcy of Alameda and FTX Group(second largest crypto exchange). It is an absolute scandal that speaks against the industry and for much-needed regulation. How the consequences will affect the market and whether other companies will go bankrupt as a result is not yet foreseeable. Fear across the market with USDT depegging again, confidence is at an all time low. There is extreme skepticism of crypto right now. Who in their right mind would buy? Well, there has never been a bottom that is exiting, they are always horrifying. Chances of it being bottoming formation have dropped drastically after 17.6k has been taken out structurally. The Wyckoff Accumulation schematic with PO3 is the only last bullish hope. For this, 21.6k must be reached as quickly as possible with an impulsive bullish upward movement. A weekly close back inside the range would be a good sign. If we don't get consistently above 18.5k BTC again in the near future, this was just the bearish retest by positive falling inflation numbers and we will see much lower prices and spend even more time down here until next halving in 2024. Everyone calling 10-12k next targets may be right as a stock index correction can be expected. Don't forget, there is also a CME Futures opening gap at 9.7k BTC from 07/27/2020. Crazy times but stick to your plan.Comment: Nothing changed - volume decreases. Let's see if the new year invalidates this idea!Comment: Initial range target hit. Update: Small changes in expansion size after new impulse structure.

derJessie

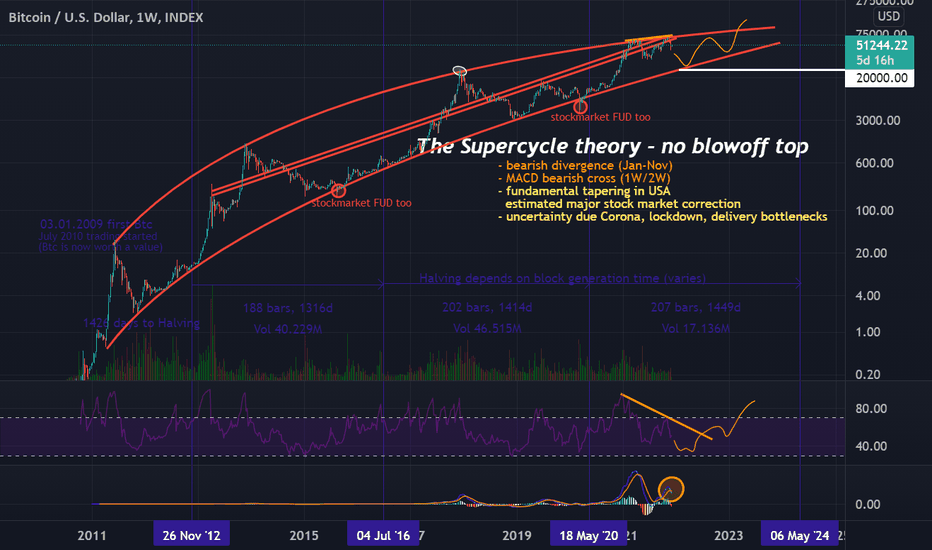
BTCUSDBearish sentiment and fear in the market, therefore a less profitable possible forecast for the future.The crypto crowd had expected a parabolic top in Q4 2021, identical to the 2013 and 2017 bullrun highs. History repeats itself but it would be too easy and predictable for all market participants. A typical reason why exactly this will not happen.The problem is that we don't have enough cycles to compare to know how Bitcoin and crypto changes as it grows.With a higher total crypto market capitalization, we have extended/lengthening cycles. That means we have longer bull runs followed by a shorter bear market. Also less return in the short term due to less parabolic momentum.There is a possibility that since we reached the 1 trillion total market capitalization in January 2021, we are in a long super cycle without ever seeing a blow-off top again. That would mean a bearish forecast for next weeks and Q1 2022 if we have not seen a higher high until then.A trigger for this assumption are indicators of technical analysis. Especially reaching the red logarithmic top curve with two diagonal support/resistance lines in the middle. This has been expanding since 2011 and was able to predict a price range afterwards. That would take us to a maximum low of $ 20k per bitcoin over the next few months. Also a retest of the white highlighted high of the 2017 run. There has never been such a retest, but it would fit the theory of the super cycle.Further indicators are an orange marked bearish divergence in the RSI (falling relative strength index at the same time as rising prices) from January top (65k) to November top (69k). Although prices are rising, there is no longer as much volume and purchasing power in the market. This means the market could face a trend reversal and low price targets. The blue bearish cross in the MACD (Moving Average Convergence/Divergence) also indicates this.In line with the trigger for the technical analysis, there are reasons for this bearish correction due to external fundamental influences that could continue to have a negative effect on all financial markets, described in yellow.Nobody wants the predictable crypto dream to end by now, but a super cycle is the result of large adoption and a good outlook for a healthy regulated market. Even if that means we don't have a large parabolic blow off top without a large volume and currently not even media attention.This analysis was drawn on the weekly timeframe. As a result, some data are estimated and not accurate.The stock markets have corrected. The more plausible bearish scenario has played out. In the coming days I will present the next analysis.

derJessie

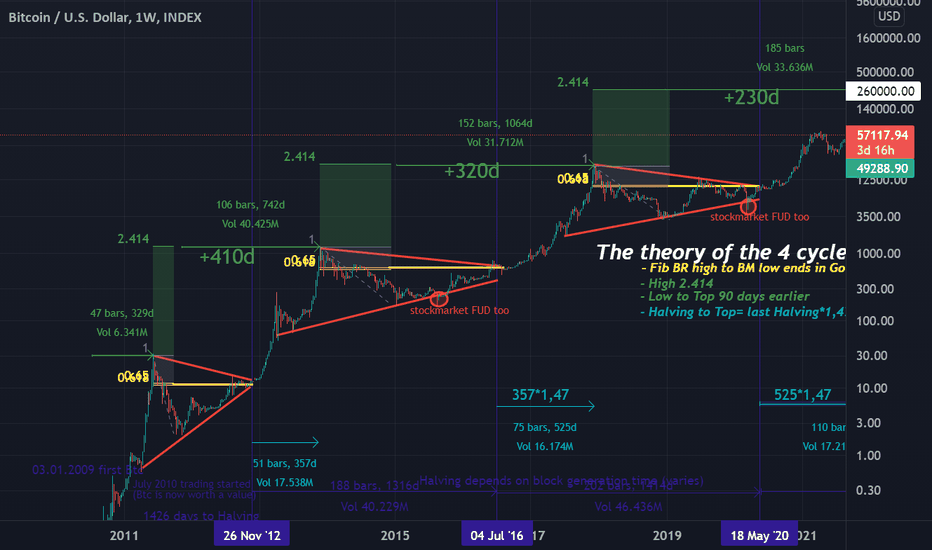
BTCUSDAccording to this theory, based on the assumption we already had 3 cycles (2011 is one) we will not see a top for the fourth cycle in December or quarter 1 2022.Each date of the Bitcoin halving is important for the analysis, through which one can recognize a clear structure, since the strong bull run of psychological people buying behavior can only begin afterwards due to the subsequent shortage of supply. With the current block generation time, the next halving date is assumed to be May 6th, 2024. It was 357 days from the first halving in 2012 to the top price. It was 525 days from the next halving in 2016 to the top. A time increase of 1.47 compared to the last run. If you take this value as a fixed factor related to the previous cycle, you would reach the next price target from the end of June to the beginning of July 2022.Each previous cycle top ends in a bear market that forms a red triangle or bull flag in higher time frame. In the last 10 years there were 2 values outside, driven by FUD(fear, uncertainty, doubt) on all financial markets due to external influences.If you pull the Fibonacci-Retracement from the bullrun top to the bear market low, the triangle runs perfectly towards the yellow Golden-Pocket(0.618-0.65) with a target of 2.414. Which leads to a green top at the end of the current cycle of around 260k +-30k. A wide range because we only stay at these heights for a few days and price is based on emotions that are controlled by greed and worldwide media attention.Suppose we take the starting trade value of Bitcoin in July 2010 as a bearmarket low. Then there are 329 days until the bull run top 2011. Again from the bear market low to the high at the end of 2013 it is now 742 days, 410 days more than the previous run. This parabolic bull run top arrived again around 90 days earlier in the following cycle added from the previous cycle. This would also bring us to a top in late June through early July 2022 marked in green.This analysis was drawn on the weekly timeframe, so the halving date is not correct and all other calculated values are +-6 days. As a result, some data are estimated and not accurate.This is my first theory. The importance for investors is to think long term.
Disclaimer
Any content and materials included in Sahmeto's website and official communication channels are a compilation of personal opinions and analyses and are not binding. They do not constitute any recommendation for buying, selling, entering or exiting the stock market and cryptocurrency market. Also, all news and analyses included in the website and channels are merely republished information from official and unofficial domestic and foreign sources, and it is obvious that users of the said content are responsible for following up and ensuring the authenticity and accuracy of the materials. Therefore, while disclaiming responsibility, it is declared that the responsibility for any decision-making, action, and potential profit and loss in the capital market and cryptocurrency market lies with the trader.