
daveibo1ster
@t_daveibo1ster

What symbols does the trader recommend buying?
Purchase History
پیام های تریدر
Filter
Signal Type
daveibo1ster

Could see retest of a market structure breakout from a Monthly and ATH level...Fixed Range PoC lines up with VaH to create strong support at $1.90 $2 markWould fit for a third hit on second parabolic yellow trendlineLines up with the 0.66/0.0618 FibsHits on Band 1 of anchored VWAPGood confluence...Look for a third drive up for 35% return on Swing. SFP/Failed auction set up for short...?Thoughts?A strong bullish Divergence on CVD and OI would make this trade impossible not to take.
daveibo1ster
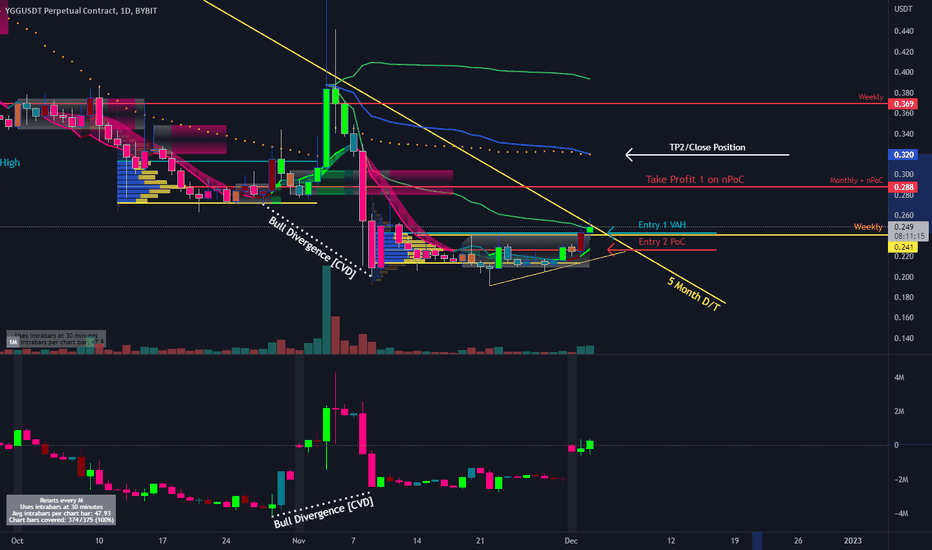
This one’s pretty.My DOGE call is still in play, TP1 was caught at the exact quarter of cent- 11c. BooYAHThis YGG perp I found on Bybit stinks of the previous DOGE set up.Cumulative Volume Data divergences label in white dotted lines. That indicates WEEKLY strength.I want my first entry at 24c - this is the Value Area High [VAH] of the accumulation range formed at basically all time lows of the token.Just like how DOGE dipped and shot off I’m expecting the same results.I’d be turning the screws on at 23c.Taking profit at the Weekly nPoC means you WON’T go broke.TP2/close entire position is in confluence with rolling VWAP, anchored VWAP from previous swing high failure pattern as well the month of October’s Value Area High.Two places of profit taking valued at around 20% and a final push at 30% to close ALL at 32cThis set up looks like Gin again.Find this TOKEN YGGhere:-bybit.com/invite?ref=8EBRA2
daveibo1ster

Let's start with 1. The 🐘 elephant in the room.1.Now, for a swing position on a daily timescales - this Bullish Divergence is golden. It's literally blaring off the charts like a fog horn through the muddy waters of technical analysis. Take note and build from this. We are 🐂 Bull biased.Now that the elephant has been addressed we can scope out confluence for entry points.Take a look at the GREEN BOX labeled 'Buy Strong Vol. Delta Cluster' - with this information we can be sure that the majority of volume is BULLISH, there is more weight in the buying power than the selling power.Now inversely, look at the RED BOX labeled 'Sell into Vol. Delta Cluster' - within this area there is strong selling pressure, we'll want to look at EXITING our position in this area with added confluence from the Fixed Ranged Volume Profile tool, RVWAP and the GOLDEN Fibonacci areas of resistence. I'll address this is section 3.2.I forecast the Price Action range starting Nov. 9 to end on Nov. 25. Today's (Nov. 26) candles is required to close (IF) above 9c with CONVICTION, [THEN] we can look for entry points at retest VALUE AREAS.If today's candles does close as required, we can be confident any pullbacks will work as a retest of volume VALUE AREAS.This is where it get's interesting.The confluence of the Weekly and Daily candles closes lays specifically on top of the VaH AND the PoC of the 16 BAR FIXED Volume Range - See horizontal Blue/Yellow bar drawn within the 16 bar range for reference.We can use these two points of confluence as ENTRY Targets.Now we have our confluence data for entries, we can look at where we should be taking profit. NO ONE ever goes broke by TAKING profit.3.We want to EXIT is style.TP1 abbreviated as 'Take Profit 1' is lined in confluence from the inital breakdown from Nov. 7 AND the ORANGE DOTTED 'Rolling VWAP' which indicates RESISTANCE. This marks for an excellent take profit mark of 11c. Dollar averaging at about 25% again on our position, IF we were to take two entries at 9c and 8.5c combined.TP2 is where I would close the ENTIRE position and look at entering shorts...The confluence in the Fixed Ranged Volume Profile RED LINE - PoC [Point of Control] and Fibonacci Sequences of 0.66 and 0.618 swing High/Low retracement values 16c-7c.ALSO, the DELTA VOLUME RED box of selling pressure from the previous HIGH range bound Price Action.^^^Many areas of confluence to close the entire position.---Close WHOLE position and look for smaller gain SHORT opportunities which would require further Technical Analysis at the time for exit plans.
daveibo1ster

RUNE look like it's behaving in a ranging pattern (like most of the crypto market right now)However this pattern i've found on RUNE looks very clean for a long-shot.The FACTS1. Price action is moving in a 27% range bound since breakdown and restest*** - see fib levels.2. Price is reaching the very bottom of the 27% price range.3. Price has respected a very clean yellow trendline from the highs of $3.83 all the way down to current price of $2.84. There are two heavy order block resistance points printed at July 21 and Feb 22 - see red box labeled RESISTANCE)Confluence of IndicatorsForewordA break on the upside of the yellow trendline would open the line for a long position. I would only shoot for a long once this trendline IS broken with conviction henceforth spying for a RETEST in order to open the LONG. I would be looking for a 20% move to the upside before closing the trade with a relatively tight stop loss in place.1. A break of conviction above the green dotted line at 2.9 would signal long options. i would like to see price hike over $3-$3.10 and then look to buy long spots at $2.92. Red box of Resistance confluences with fib level blue 0.66 and fib level yellow 0.618. - this is one of the golden indicators i use for spotting reversals. - here is where i close the trade.3. BULLISH DIVERGENCE spotted with dashed yellow lines on OBV AND RSI - powerful indictor of reversal.4. Price is still respecting the 27% bound range and MAY*** have finished its testing of the lows.ConclusionPotential for a clean 20% upmove with a nice 5R risk to reward (a 4% stop loss) is more than on the cards.Have to see a clean convicted break of yellow trednline!
Disclaimer
Any content and materials included in Sahmeto's website and official communication channels are a compilation of personal opinions and analyses and are not binding. They do not constitute any recommendation for buying, selling, entering or exiting the stock market and cryptocurrency market. Also, all news and analyses included in the website and channels are merely republished information from official and unofficial domestic and foreign sources, and it is obvious that users of the said content are responsible for following up and ensuring the authenticity and accuracy of the materials. Therefore, while disclaiming responsibility, it is declared that the responsibility for any decision-making, action, and potential profit and loss in the capital market and cryptocurrency market lies with the trader.