
crypto_Rida
@t_crypto_Rida

What symbols does the trader recommend buying?
Purchase History
پیام های تریدر
Filter
crypto_Rida
تحلیل تکنیکال ICP: ریزش قریبالوقوع و فرصتهای فروش (Short) در 7 دلار!
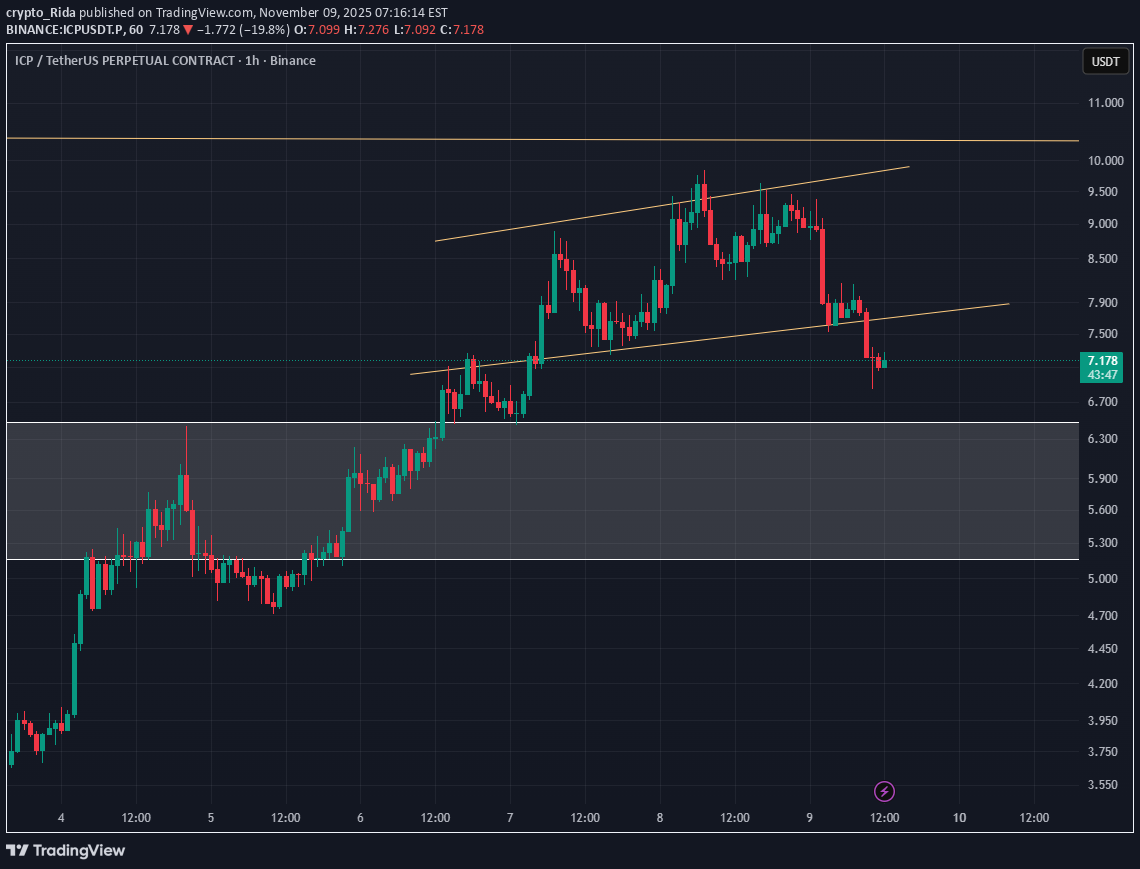
Price recently surge and retrace back to 7$ which is currently overing. looking at the orderbook and Ord flow, price has heavy cluster laddered down. and support has been broken from the trendline signaling more correction lies below. short swing trades 3-4x entry 7.2-8 tp 7.1 7 6.8 6.5 6 stoploss 9.5
crypto_Rida
رمزگشایی حرکت بیت کوین: تله نهنگها و استراتژی ورود هوشمندانه

1. Market Context Before the Move On-chain metrics showed exchange outflows, reduced available BTC, and rising whale wallet accumulation, setting the stage for reduced downside panic and shallow liquidity sweeps. Open interest and funding rates were balanced and slightly declining, meaning the market was not heavily biased in either direction—prime territory for a liquidity-driven move rather than a trend breakout. 2. The Downside Liquidity Sweep / Stop-Hunt As seen on both clusters and TradingView, price broke down and aggressively swept the lower support/liquidation cluster ($109,500–110,000). This cascade triggered long position liquidations and wiped out late, over-leveraged bulls, creating a "liquidity vacuum." At the same time, aggressive shorts tried to chase the breakdown, but on-chain delta and liquidations confirmed most were too late and then quickly liquidated on the reversal. 3. Reversal and Pump: The Smart Money Play After the downside flush, aggressive buying (positive delta, increasing OI around support) stepped in. This absorption matched large clusters Price bounced sharply out of the support box, confirming this was a classic institutional stop-hunt and fade. Longs who entered at the lowest liquidity cluster had the best risk/reward entries and quickly saw price rocket back above intraday support. 4. Short-Term Distribution/Profit-Taking As the move unfolded, net long profit-taking began. Price faced resistance in the prior mid-range (your TradingView upper white box, $111,800–$113,000). Shorts who entered early were liquidated, while new shorts began building higher—creating another potential squeeze if price surges again. Order flow delta signals showed longs in profit reducing exposure, while new shorts may be "fuel" for further upside. 5. Price Action Structure (TradingView 4h TA) The chart now shows price sitting inside a high-confluence support box, repeatedly defended as the main liquidity magnet. If this box holds, intraday bounces or even a reversion to the upper resistance range ($113,000+) remain the highest probability play. Failure to hold (strong breakdown with negative delta and OI spike) targets another flush and stop-hunt below. players: Open long if price 108500-109800 risk Takers : 109k-111k range tp: 111,400 111,600 111,900 112,400 stop: 107600new Tp 109,300 109500 110k 111k stop loss remaing the same, however remeber this trade already hit profit. this is for risk takers
crypto_Rida
راز حرکت بیت کوین: بازی نقدینگی نهنگها در بازار BTCUSDT

Institutional Market Analysis – BTCUSDT Over the recent sessions, the BTC market structure exhibited a classic set of liquidity-driven moves best identified and executed using advanced institutional order flow, liquidation, and open interest monitoring systems. 1. Pre-Move Context Institutional positioning data showed pronounced capital outflows from exchanges and strong signs of large account accumulation, creating a diminishing liquidity environment on the downside. Real-time derivatives metrics indicated a balanced yet cautious market: funding rates and open interest were soft, signaling risk-off positioning and a high likelihood of a liquidity sweep event. 2. The Stop-Hunt & Liquidity Cascade This thesis played out as price sharply swept the major support and liquidity cluster in the $109,500–110,000 zone. The move triggered a wave of forced liquidations among leveraged long accounts, clearing out weak positioning and drawing in aggressive late sellers. High-resolution flow monitoring confirmed that short positions entered during the flush were quickly neutralized as the market reversed. 3. Reversal and Aggressive Positioning Immediately after the sweep, signature absorption flows appeared—evident from rising participation and open interest at key zones. Smart-lot execution and block order prints indicated institutional interests accumulating, setting the stage for a rapid reversal. The result was a pronounced recovery off the lows, with profit quickly being realized by those with optimal entries at the liquidity inflection point. 4. Short-Term Distribution & Mean Reversion As price recovered toward the mid-range, order flow signals showed long participants reducing exposure while new short accounts entered near resistance. With most short interest exhausted at the higher bands and new entries clustering, a potential setup emerged for further upside acceleration if short covering persisted, especially on a break above $111,800–113,000. Profit-taking in the mid-range has so far induced mild retracement. 5. Technical Structure (4h View) The current 4-hour chart reflects this entire process: after a disciplined liquidity sweep and reversal from structural demand, price is cycling between the lower support and historical supply around $113,000. Should current support continue to hold with firm absorption, the probability for continued mean reversion or an upward squeeze remains elevated. Breakdown confirmation would only arise with a new wave of forced liquidations and capitulation beneath current lows. Summary Table Phase ZoneInstitutional FlowMarket Outcome Stop-hunt$109,500–110,000Liquidation spike, block absorptionHigh-conviction long entries, reversal Recovery/Squeeze$111,000–112,000Short neutralization, OI riseRapid bounce, shorts liquidated Distribution/Profit$111,800–113,000Reduced longs, new short clustersConsolidation or squeeze setup Conclusion: Recent price action has followed an institutional playbook—targeting liquidity, executing sweeping reversals, and exploiting passive and aggressive flows across the book. Continuously monitoring OI, flow delta, and structural liquidity remains critical for anticipating the next high-conviction trade as the market oscillates from one liquidity pocket to the next. This approach ensures entries and exits are based on where the largest players actually transact—not retail-driven indicators or price-only signals
crypto_Rida
پیشبینی انفجاری SNX: تله نهنگها و فرصت خرید دیپ (سقوط) برای کسب سودهای بزرگ!

Trade Decision Bias: Bullish (after shakeout)—buy the dip for squeeze play. Why: Recent long liquidations at the highs and shorts stacked below mean the setup is primed for a classic institutional trap and reversal. Price should flush to 1.90–1.80, absorb selling, then launch an up move as shorts are squeezed. 3. Execution & DCA Plan DCA Entry Zones: 1st: 1.92–1.88 (initial trap flush, start small) Main: 1.85–1.80 (largest cluster, size up here) Final: 1.77 (lowest cluster, only size here if panic wick appears) Stop Loss/Invalidation: Below 1.76 daily close/wick, or after failed absorption and no short squeeze reversal. 4. Take Profit Targets scalpers: 1.95 2 2.2 2.3 Swings Primary: 2.20 (where prior longs entered, first bounce target) Secondary: 2.36–2.40 (recent liquidation highs and stop clusters, likely resistance/supply zones for full squeeze target) Optional trailing: If aggressive momentum persists, trail stops above those for additional upside leg.
crypto_Rida
خرید هیجانانگیز dYdX: فرصت طلایی ورود در محدوده 0.34 با اهداف صعودی جذاب

Longs are in control overall. The major clusters below (heavy long stacks) mean any dip to 0.34 presents a high-conviction buy opportunity—institutions and big players are likely defending that zone. Short-term, recent shorts could cause a brief flush if price moves down, but any move to 0.34 will likely be absorbed and reverse strongly upward. entry RANGE 0.33-0.35 Tp 0.365 0.38 0.39 0.4 stop loss 0.325
crypto_Rida
احتمال سقوط سنگین قیمت ZEC: آماده شکار نقدینگی در این محدوده باشید!

High Probability of Liquidity Hunt: The market structure strongly suggests a high probability of price being drawn into a "liquidity hunt" to the downside. Large market participants are likely incentivized to push price into the 218.00-216.00 range to trigger stop-losses and liquidations, allowing them to fill large orders at more favorable prices or to capitalize on the ensuing volatility. Potential for Cascade Effect: Should the 220.00 level fail to hold, a rapid descent into the 218.00 and then 216.00 zones is a high probability. The sheer density of these clusters implies that if triggered, a liquidation cascade could accelerate the move, creating significant selling pressure. Long Entry 212 215.5 218 Tp 220 221.6 223 226
crypto_Rida
تحلیل سری ARB: فرصت فروش (شورت) جذاب در انتظار شکست خط مقاومت!

Chart Structure: Price action is forming a rising wedge/triangle, approaching the upper trendline (likely near 0.36–0.37). wait for price to touch the upper boundary—this is where late longs panic in, crowding the top, and a sweep or rejection at the trendline offers a prime short entry. short entry 36-38 tp 0.35 0.347 0.34 0.33 stoploss 0.44
crypto_Rida
آواکس (AVAX): راهنمای خرید و فروش آسان در سطوح کلیدی ۲۰ تا ۲۴ دلار

Full Edge in Simple Terms Buy dips toward your “This Price” (20.5–21.0 zone). Target 23.0–23.8 (first the trendline/confluence, then above for squeeze into liquidation cluster). However you can Take your profit bit by Bit on this levels as wel 21.3 21.6 22 22.6 23 stop 19.5
crypto_Rida
Bitcoin

Here's the setup on Bitcoin's 4H chart: We've got a clear RSI bullish divergence forming, which typically signals an incoming upside reversal in price action. That said, don't front-run it—divergences often precede a final shakeout, like a retest of lower support or a quick dip to flush out weak hands before the real pump kicks in. Based on historical patterns I've traded through, expect resolution within 3-6 days, possibly sooner. Stay vigilant for a clean breakout above key resistance; that's your confirmation to position long. Risk manage accordingly—stops below the divergence low.
crypto_Rida
BTC

rend & Technicals Trend: Neutral/bearish short term, but still inside rangebound action. Support Zones: Key support at 111,463 (recent Lows). Resistance Zones: Short-term resistance near the 112,199—112,248 region. Indicators: Bollinger Bands: Price near lower band, indicating possible oversold or breakdown risk. MACD: Likely turning negative; watch for cross confirmation. RSI: Mildly oversold conditions, but not extreme. EMA (Exponential Moving Average): Price near the EMA; a loss below may escalate selling. Trading Setups & Recommendations Bullish Case: If price holds above 111,463 and reclaims 112,199 on a closing basis, a move toward 112,750 (next supply) is probable. Watch for RSI/MACD divergences for early reversal signals. Bearish Case: Loss of 111,463 opens up for more liquidations and strong downside momentum. Volume spikes or sell-side clusters could trigger sharp moves to lower supports. long entry 111,500 112,000 profit 112,400 112,700 113,000 stoploss: 111,200
Disclaimer
Any content and materials included in Sahmeto's website and official communication channels are a compilation of personal opinions and analyses and are not binding. They do not constitute any recommendation for buying, selling, entering or exiting the stock market and cryptocurrency market. Also, all news and analyses included in the website and channels are merely republished information from official and unofficial domestic and foreign sources, and it is obvious that users of the said content are responsible for following up and ensuring the authenticity and accuracy of the materials. Therefore, while disclaiming responsibility, it is declared that the responsibility for any decision-making, action, and potential profit and loss in the capital market and cryptocurrency market lies with the trader.