
controllinghand
@t_controllinghand

What symbols does the trader recommend buying?
Purchase History
پیام های تریدر
Filter
controllinghand
Bitcoin Income: STRK vs IBIT – Dividends, Covered Calls *Update
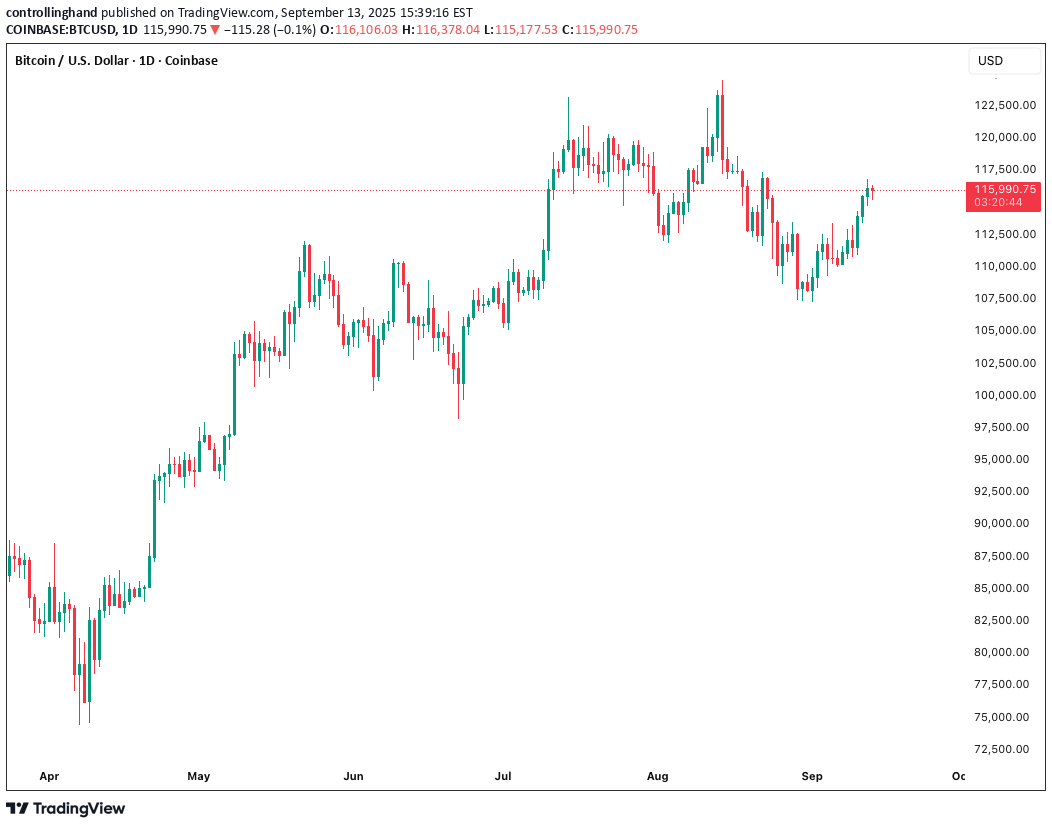
Join me as I dive into my investment journey comparing MSTR, STRK (with dividend offerings), and IBIT (with covered calls) since January 31, 2025! Initially, STRK was outperforming IBIT with covered calls, but as of September 13, 2025, IBIT with CC has taken the lead. Check out the detailed breakdown: STRK: Bought at $81.00, now at $95.65, with a 24.5% gain and 6.47% yield. MSTR: Bought at $334.79, now at $331.44, with a 0.0% yield and -1.0% loss. IBIT: Bought at $58, now at $66, with a 27% gain and a 12.79% yield. BTC: Bought at $102K, now at $115K, with a 13.2% gain. QQQ: Bought at $522.00, now at $596.66, with a 12.7% gain and 0.36% yield. From Jan 31st to now, IBIT with covered calls has outperformed STRK, flipping the early trend. Learn how these strategies played out, my takeaways, and what this means for my portfolio. Drop your thoughts in the comments—would you adjust your strategy based on this?
controllinghand
Kaspa Technology Review & Investment Insights

In this video, I share my review of Kaspa’s technology and offer some thoughts on its potential as an investment opportunity. I walk through a live demonstration of DAGKnight in production, and highlight key aspects of Kaspa’s speed, security, and scalability—three pillars that set it apart from traditional blockchain architectures. If you’d like to dive deeper, here are some great resources to explore: 📄 Whitepaper: eprint.iacr.org/2022/1494.pdf 🧠 DAGKnight Production Graph Inspector: kgi.kaspad.net/ 📊 Kaspa Key Stats Dashboard: kas.fyi/
controllinghand
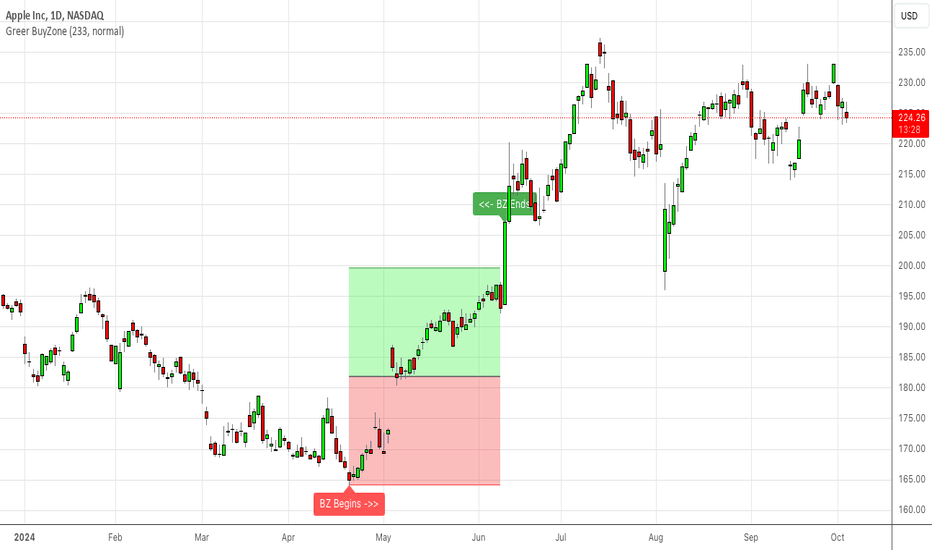
Why Greer Buy Zone is so powerful
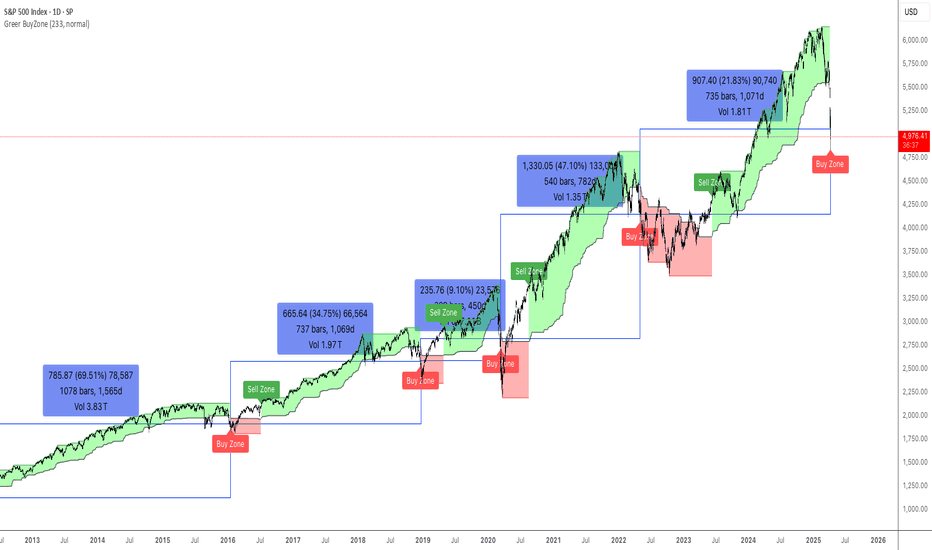
SPY has just entered the Buy Zone. Historically, buying at this point has led to positive returns over the past few decades. Check out the video and let me know what you think!if you would have followed the Greer BuyZone you would be up 20% as of today
controllinghand
Year to date Bitcoin vs Gold vs NASDAQ (End of Year Update)
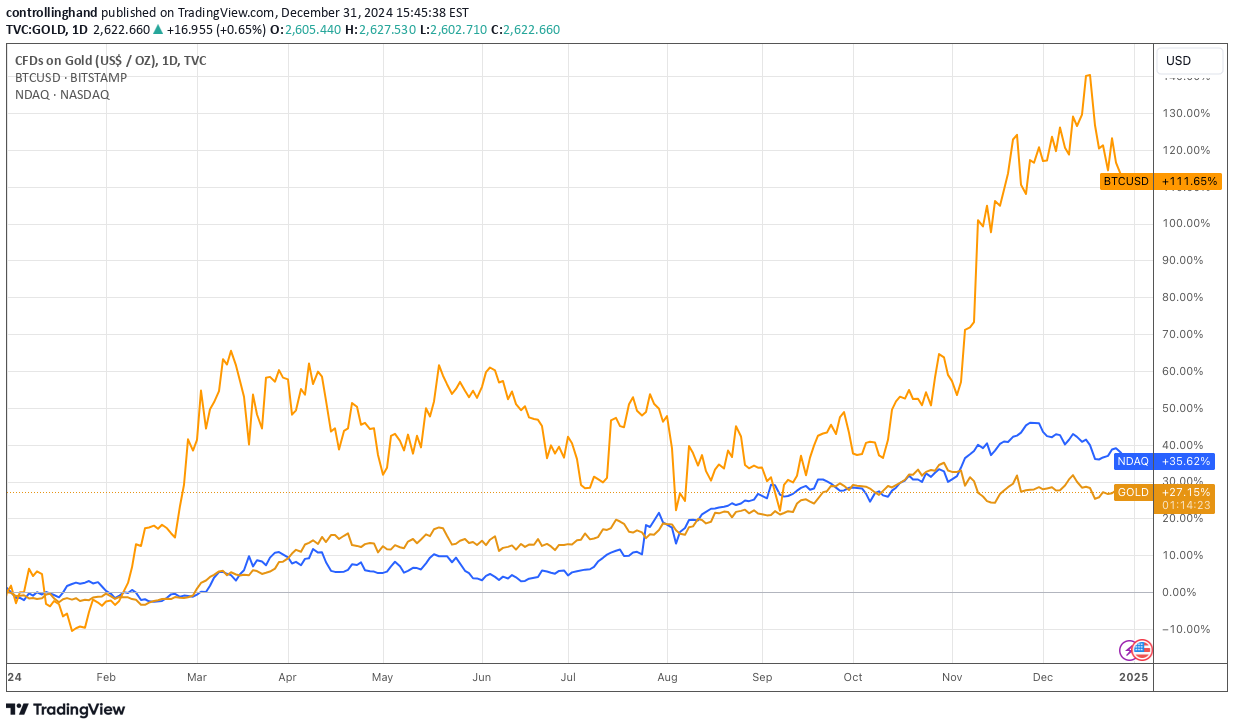
Happy New Year! Especially to those Bitcoin HODLers and even to those NASDAQ believers. Sorry GOLD you lost this year :-(.
controllinghand
The Overlooked Indicator Outstanding Shares
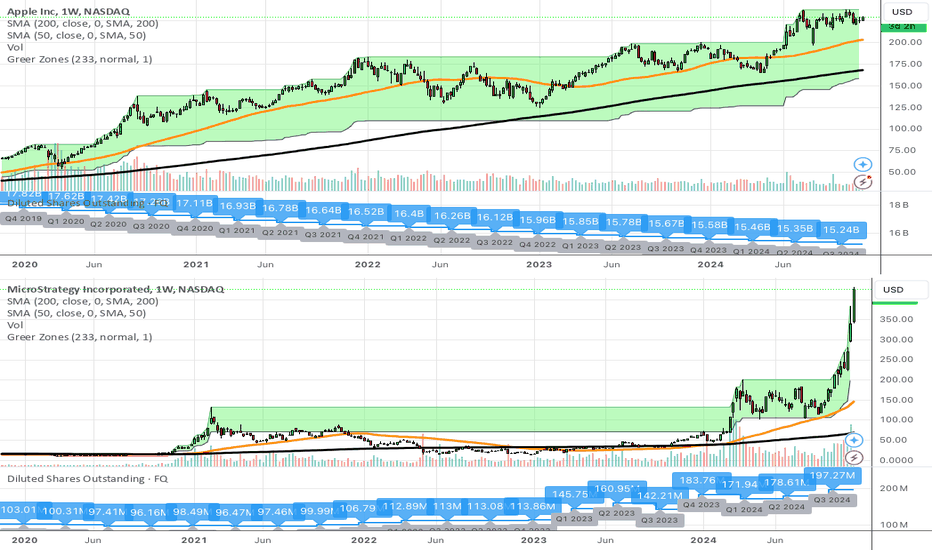
The Overlooked Indicator: How Changes in Outstanding Shares Impact Long-Term Investments When evaluating a company for long-term investment, most investors focus on familiar metrics such as revenue growth, earnings per share (EPS), and price-to-earnings (P/E) ratios. However, one crucial indicator often overlooked or misunderstood is the change in a company's outstanding shares over time. This variable plays a significant role in determining the market capitalization and, ultimately, the shareholder's stake in the company. Understanding Outstanding Shares and Market Capitalization Outstanding shares represent the total number of shares a company has issued and are held by all shareholders, including institutional investors, retail investors, and insiders. These shares are a key component in calculating a company’s market capitalization, which is simply: Market Capitalization = Outstanding Shares × Share Price Market Capitalization=Outstanding Shares×Share Price While market capitalization is widely referenced, changes in outstanding shares are often neglected, even though they can significantly influence the per-share value of a company. Issuing and Repurchasing Shares: A Tale of Two Strategies Companies can increase or decrease the number of outstanding shares for various reasons: Issuing New Shares: When companies issue additional shares, often to raise capital or fund growth initiatives, they dilute existing shareholders' ownership. This dilution can have a material impact on the value of each share, as the same company’s equity is now spread over a larger number of shares. Share Buybacks: Conversely, when companies repurchase their own shares, they reduce the number of outstanding shares, effectively concentrating ownership among the remaining shareholders. This often boosts metrics like earnings per share (EPS), making the company appear more attractive to investors. Case Study: Microsoft and MicroStrategy To illustrate the impact of changes in outstanding shares, let’s examine two contrasting examples: Microsoft (MSFT) and MicroStrategy (MSTR). Microsoft (MSFT): In 2020, Microsoft had 17.8 billion outstanding shares. By 2024, this number had been reduced to 15.2 billion—a 15% reduction. This significant buyback program demonstrates Microsoft’s commitment to returning value to shareholders. Reducing outstanding shares enhances per-share metrics and can indicate confidence in the company’s financial health and future. MicroStrategy (MSTR): In stark contrast, MicroStrategy increased its outstanding shares from 100 million in 2020 to 197.2 million in 2024—a staggering 97% increase. This massive share issuance reflects a dilution of shareholder value. While the additional capital raised might have been used to fund growth or acquisitions, existing shareholders now own a smaller percentage of the company. The accompanying charts vividly illustrate these trends, highlighting how these strategies can dramatically alter the ownership landscape over time. Why This Matters for Long-Term Investors As a long-term investor, it’s essential to look beyond surface-level metrics and consider how changes in outstanding shares affect your investment. For example: Dilution Risk: A company that frequently issues new shares may struggle to generate sufficient internal capital, signaling potential financial challenges or aggressive expansion strategies that could dilute shareholder value. Share Buybacks: While buybacks can enhance per-share metrics, they are not inherently positive. Investors should ensure the buybacks are funded by strong free cash flow rather than debt, which could jeopardize the company’s financial stability. Impact on Valuation: Adjusting for changes in outstanding shares provides a more accurate picture of a company’s valuation and its ability to generate returns for shareholders. Conclusion Changes in outstanding shares are a critical but often overlooked factor in evaluating a company’s long-term potential. By understanding the implications of share issuance and buybacks, investors can make more informed decisions and avoid common pitfalls in their investment journey. The examples of Microsoft and MicroStrategy serve as a reminder that not all changes in outstanding shares are created equal. For long-term investors, keeping an eye on this overlooked indicator can be the difference between a growing stake in a thriving company and an increasingly diluted piece of the pie.
controllinghand

controllinghand
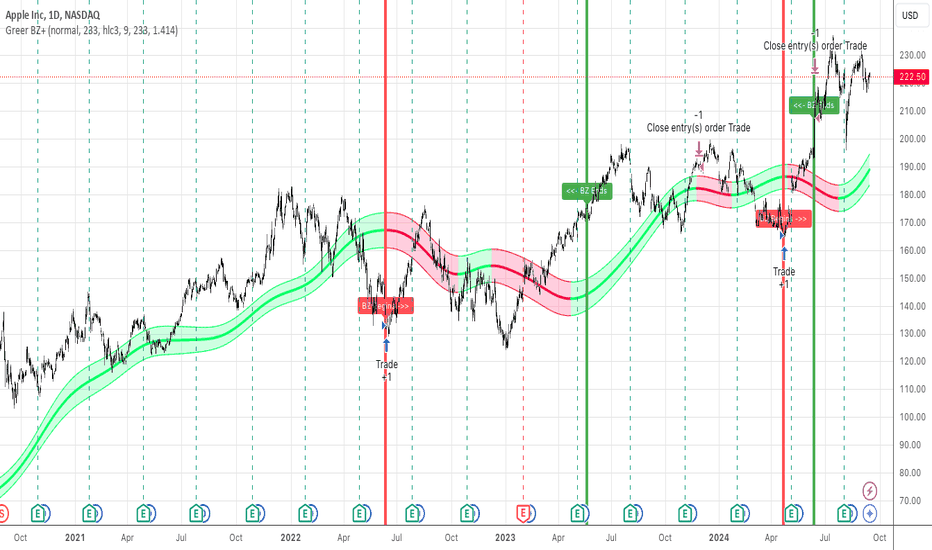
Greer BuyZone Release Updates
In this video I explain the updates to the Greer Buyzone Indicator Release Notes: 9/12/24: Clean-up of options so vertical lines are removed by default but can be added if desired. Improved text readability by adjusting the text size. 9/29/24: Adjusted the "BuyZone Begins" text to appear below the price bar for better readability. 9/30/24: Added an optional BuyZone Box to better visualize buy periods, along with the ability to toggle text labels on or off. 10/3/24: Introduced alert capability to notify users when BuyZone periods begin and end.
controllinghand
Greer Time
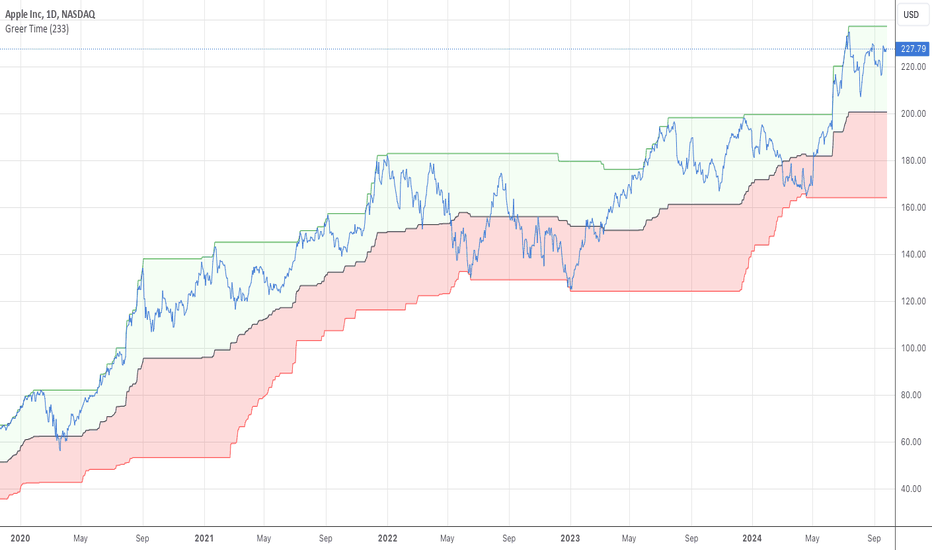
This script is designed to help traders visualize key price levels over a customizable look-back period (default set to 233 bars/days). The script calculates the highest, lowest, and midpoint prices during this period and shades the chart to highlight price zones. In addition to showing these important price levels, this script provides visual guidance for investment decisions: Green Section (Upper Zone): When prices approach the upper green zone (near the highest point), it might be a good opportunity to take profits or perform investment management. This zone often indicates that the asset is trading near its recent high, a possible signal of overbought conditions. Red Section (Lower Zone): When prices approach the lower red zone (near the lowest point), it may present a potential opportunity to dollar-cost average (DCA) into the investment. This zone can signal that the asset is trading near its recent low, which could be favorable for accumulating more shares at a discounted price. Important Note: New Trend Indication: When the price hits the bottom of the red line or the top of the green line, this signifies a new low or new high for the current look-back period. This often signals a potential new trend emerging in the market, as these points indicate the breaking of previous resistance (green line) or support (red line). Pay close attention to these movements, as they can serve as early indicators for trend reversals or trend continuation.
controllinghand
A Video Explaining how to use the Greer Invest Strategy
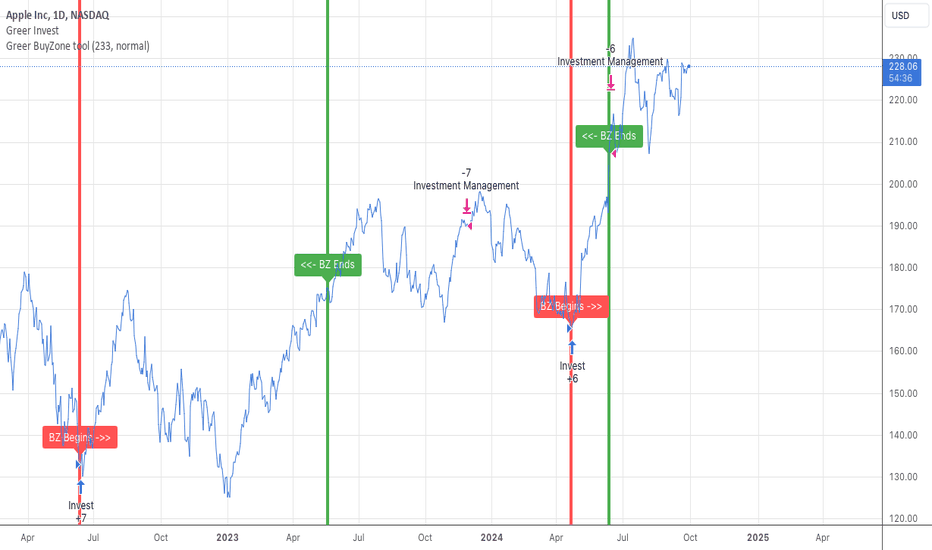
Greer Invest Strategy Overview: The Greer Invest strategy is designed to assist investors in making long-term investment decisions through a structured approach to buying and managing investments over time. Key Features: Invest: Indicator to pinpoint optimal entry points for investments. Investment Management: Includes an additional feature for strategic selling, allowing investors to rebalance their portfolio or generate cash for other purposes without full liquidation. Precision and Alerts: Offers precise buy signals within BuyZones and customizable alerts for proactive investment management. Purpose: This tool aims to simplify the decision-making process for when to enter or adjust positions in stocks, ETFs, cryptocurrencies, or other assets, focusing on long-term wealth accumulation rather than short-term speculation. Usage: Backtesting: Investors can use TradingView's strategy tester to evaluate the performance of this strategy over historical data. Alerts: Set up notifications to be alerted on potential buy or sell opportunities across your watchlist. Backtesting Results: The Greer Invest Strategy was backtested against the top 50 companies in the U.S. by market capitalization. Here are the key results from this comprehensive test: Total number of trades: 470 trades were executed. Total invested over time: $470,000, with each trade amounting to $1,000. Total Net Profit: The strategy yielded a profit of $162,344.59. Total Net Profit %: Overall, the strategy achieved a 35% return on the total investment. % Trade wins: A notable 82.33% of all trades ended profitably. % Trade loss: 17.67% of trades resulted in losses. Average Max Draw Down per $1000: The strategy experienced an average maximum drawdown of $550.74 per $1,000 invested, indicating potential risk levels. Average Trade Profit per $1000: Each trade, on average, profited $497.93 per $1,000. Average # bars in trade: Trades were held for an average of 396 bars, reflecting a medium-term to long-term trade duration. Detailed Results for Selected Companies: Apple (AAPL): Profit of $6,752 (67.53% return) from 10 trades. Microsoft (MSFT): Profit of $3,294.13 (32.94% return) from 8 trades. NVIDIA (NVDA): Profit of $7,743.43 (77.43% return) from 5 trades. Alphabet (GOOG): Profit of $338.22 (3.38% return) from 2 trades. Amazon (AMZN): Profit of $3,580.17 (35.80% return) from 6 trades. Meta Platforms (META): Profit of $731.04 (7.31% return) from 2 trades. Berkshire Hathaway (BRK.B): Profit of $1,902.01 (19.02% return) from 4 trades. Broadcom (AVGO): Profit of $1,089.64 (10.89% return) from 2 trades. Eli Lilly (LLY): Profit of $1,408.76 (14.09% return) from 12 trades. Tesla (TSLA): Profit of $10,263.41 (102.63% return) from 2 trades. Key Observations: High Win Rate: An impressive 82.33% of trades were winners, suggesting the strategy was effective in picking winning trades. Profitability: The strategy was profitable across various companies, with some like TSLA, NVDA, and AAPL showing particularly high returns. Drawdown: The average maximum drawdown of $550.74 per $1,000 could be a concern for risk management, indicating significant fluctuations in equity. Trade Duration: With an average of 396 bars in trade, the strategy seems to hold positions for a considerable duration, suggesting a medium to long-term approach. This analysis indicates that the strategy performs well across a diversified set of top U.S. companies by market cap, with some standout performers. However, the drawdown and long trade duration might require careful risk management and could impact liquidity or opportunity cost considerations. Credit: Credit to Tushar Chande who invented the Aroon indicator. Credit to Carl Friedrich Gauss who invented the Gaussian process. Credit to Donovan Wall who created the script that has the math for the Gaussian Channel. Disclaimer: The Greer Invest strategy is for educational and informational use only. It does not constitute financial or investment advice. Users should perform their due diligence and consider consulting a financial advisor. There's no guarantee of profit or protection against loss. The creator of this script is not liable for any outcomes from its use.
controllinghand
How to get more out of the Greer Buyzone Tool
If you have found value in the Greer Buyzone Tool and are interested in exploring additional strategies to leverage its capabilities, I invite you to view my latest video presentation. In this session, I discuss methodologies for profit-taking utilizing the Greer Buyzone Tool in conjunction with other key indicators. I have also developed an exclusive script based on this study, available for those who express interest. I am eager to receive feedback from the community regarding this approach, to further refine and share insights on its application.
Disclaimer
Any content and materials included in Sahmeto's website and official communication channels are a compilation of personal opinions and analyses and are not binding. They do not constitute any recommendation for buying, selling, entering or exiting the stock market and cryptocurrency market. Also, all news and analyses included in the website and channels are merely republished information from official and unofficial domestic and foreign sources, and it is obvious that users of the said content are responsible for following up and ensuring the authenticity and accuracy of the materials. Therefore, while disclaiming responsibility, it is declared that the responsibility for any decision-making, action, and potential profit and loss in the capital market and cryptocurrency market lies with the trader.