
citsvar
@t_citsvar

What symbols does the trader recommend buying?
Purchase History
پیام های تریدر
Filter
citsvar
سقف قیمتی ۱.۶ فیبوناچی: آیا اصلاح بزرگ بازار سهام در نوامبر و دسامبر در راه است؟
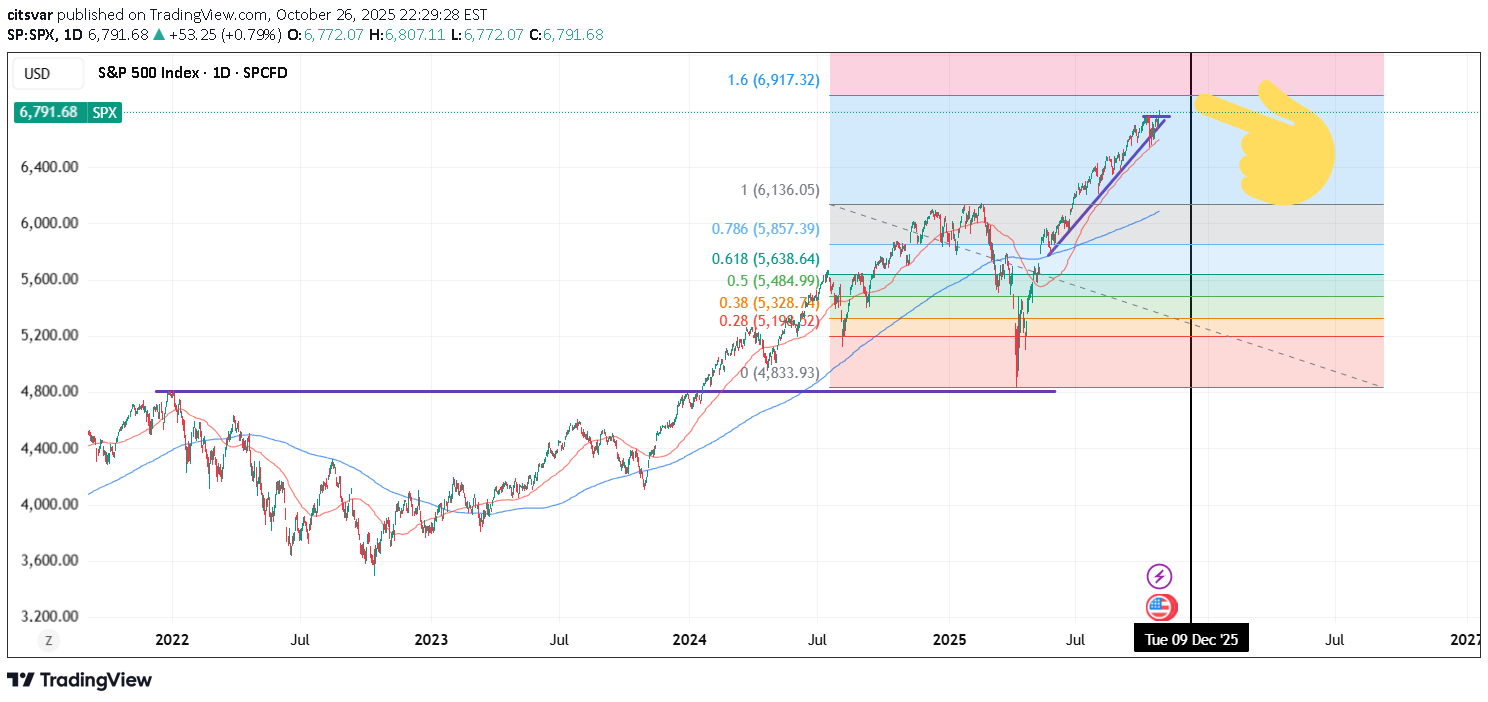
You can apply 1.6 FIB to FAANG or QQQ for high probability ceilings. VIX "structure" (pattern) or setup also indicates it. Stocks forming a sharp "wedge drop", extension from 50dma. Bullish near term (probably?), correction in NOV/DEC. I wonder if the first 5 (monthly) trading days in NOV are not volatile AF. 😂It's game theory. 👍
citsvar
چرخه قیمت الیور کل: راز سودآوری بلندمدت با استفاده از میانگین متحرک 50 روزه
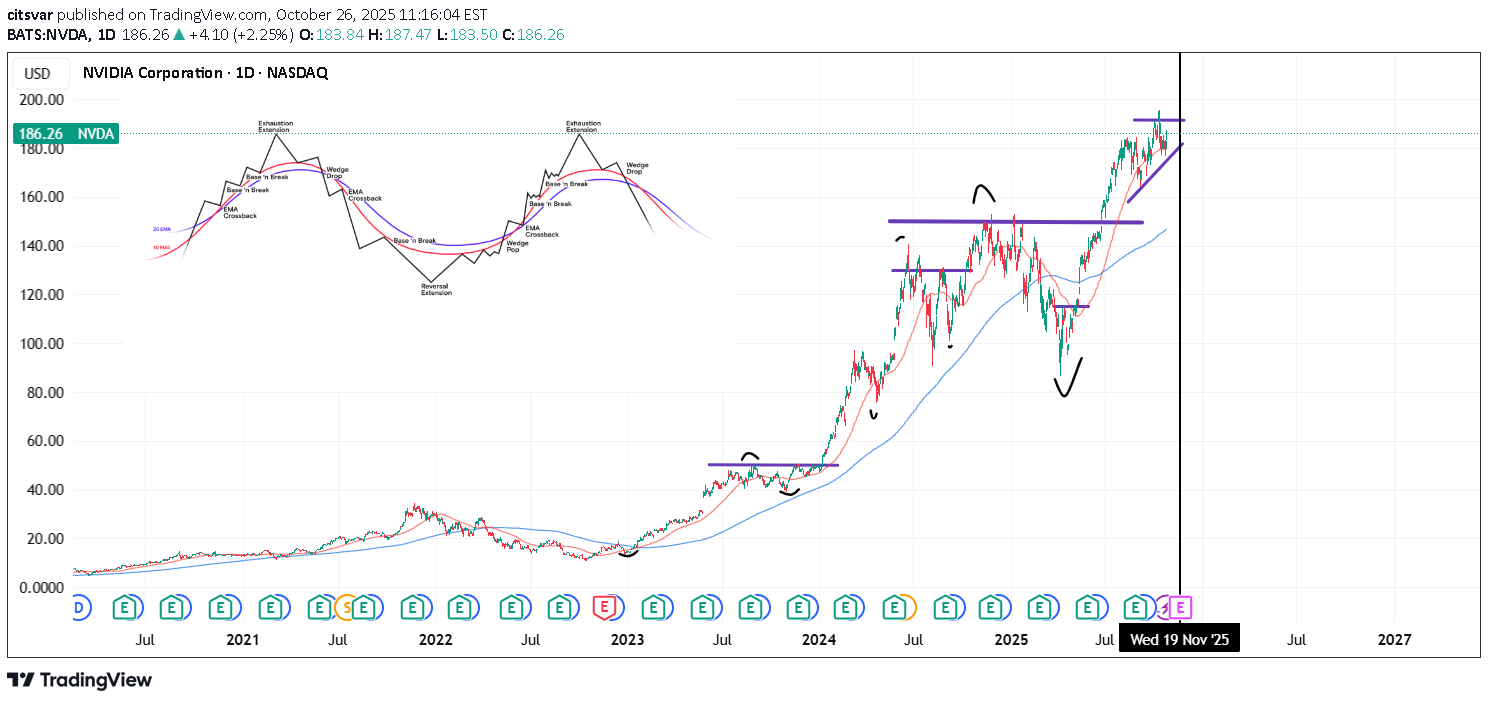
Oliver Kell is a legend swing trader and I thought his price cycle concept makes a lot of sense. I would intuitively use 50dma cycle for price swings. His concept give depth to an idea. Longterm for less variance outcomes. #GoldenCross #DeathCross.a hypothetical cycle or "regime", where one side is in the lead. Call it market force or whatever. Using "markov chains" - only one regime is possible. And market is always in the flow, movement. Identifying the regime, where it starts and ends, gives you the best odds. Besides that bond market is the king.Kell says he uses 200dma, 50dma and 10/20 EMA. But his concept can be applied to longterm I think. I like his idea.
citsvar
رمزگشایی کانالهای بازار: راز نوسانات و روانشناسی حرکت قیمت
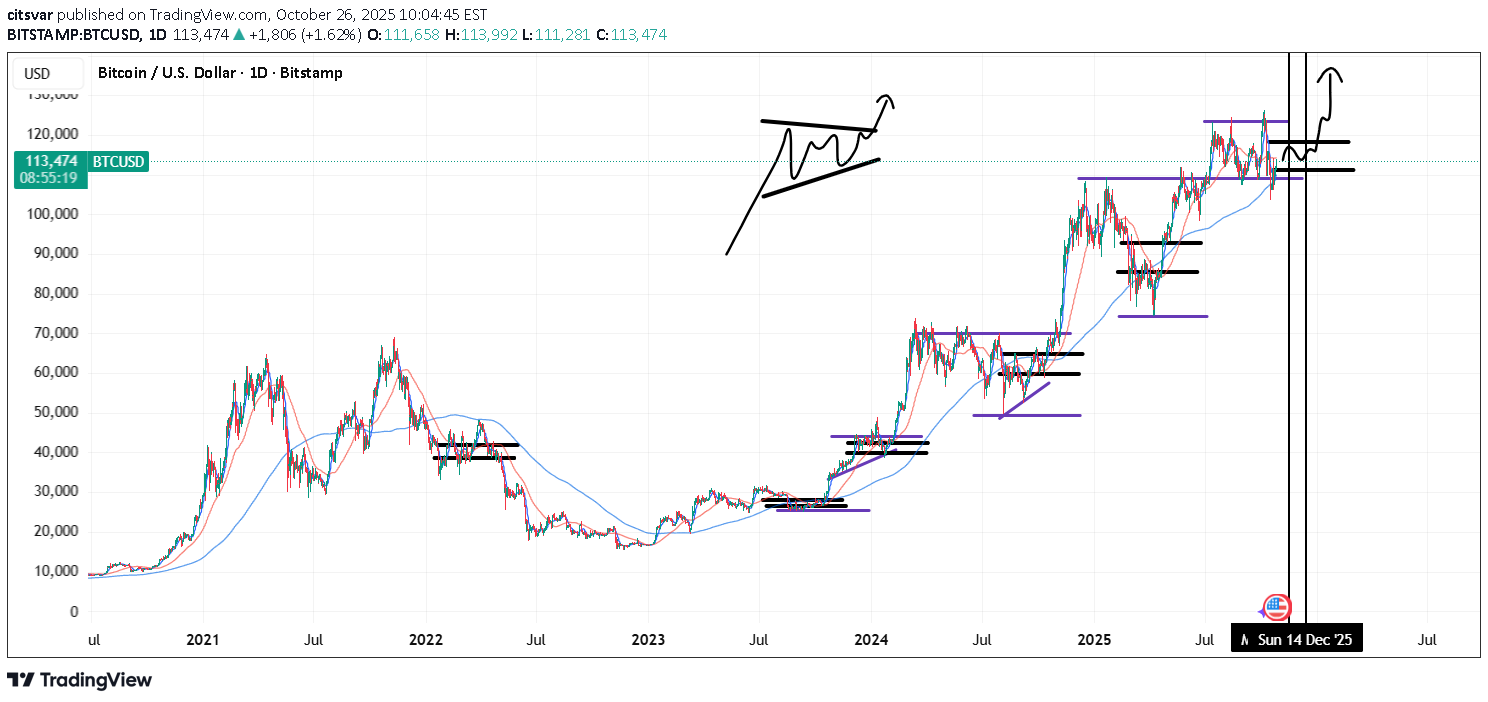
If you look at market patterns and Bollinger bands, price always goes from high volatility to price discovery, tightens. Market shows clear direction, ie 🟢 or 🔴. The same when using longterm charts, they fluctuate and you can almost find where the important channel gonna be. It's psychology. 85% bullish. 15% it fails, imo.:)
citsvar
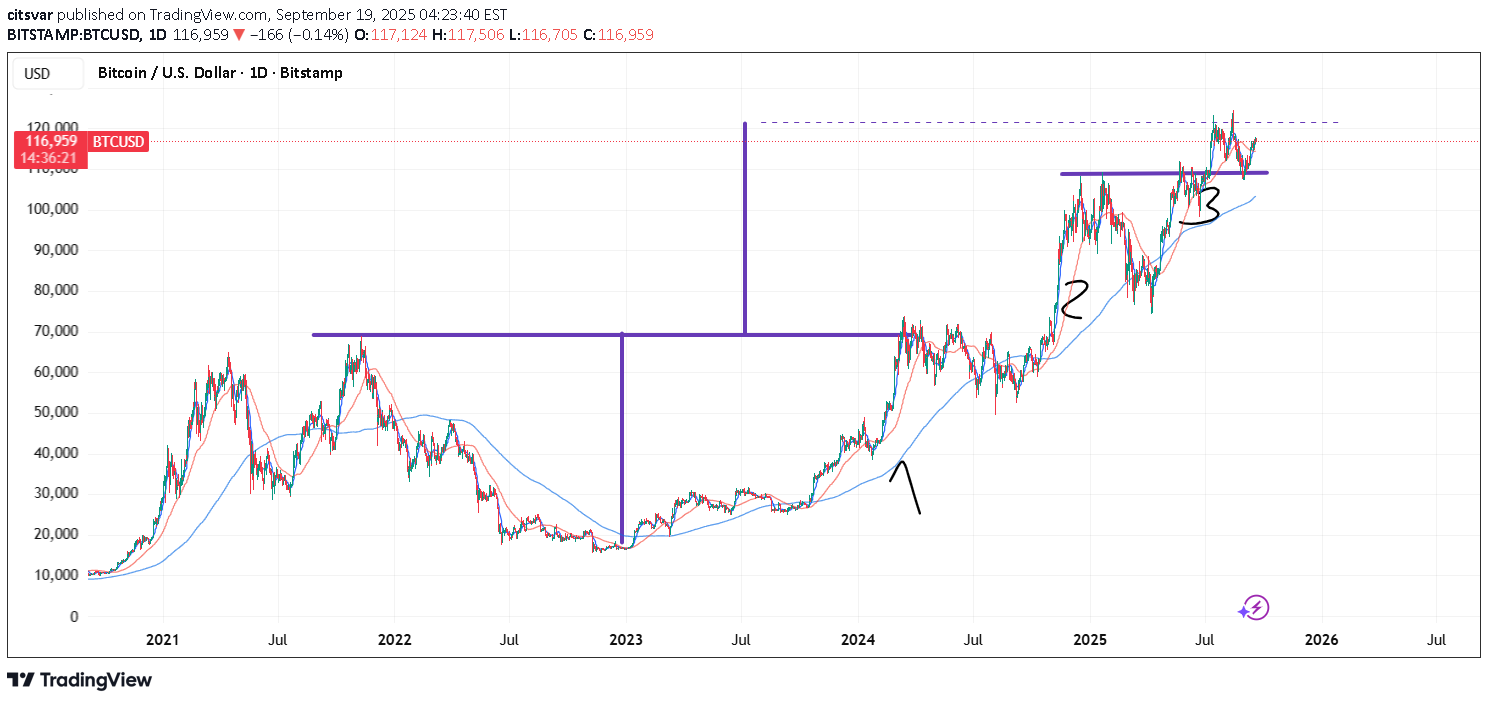
I read that this recent BTC strength was caused by retail investor wave and that whales are sleeping. If we look from a longterm perspective -> we forget initial CUP n HANDLE pattern, and where it's next PEAK was. this was also a 3rd wave. Still bullish longterm tho.
citsvar

Typical liquidity cycle is 5-6 years long (65m). Buy bitcoin before an upswing (or end of QT) and sell when liquidity tightens. Macro is the best way to analyze markets?Adjust your stakes based on position of the cycle. Markets can have risk-on, risk-off episodes. Where Bitcoin is a risk-on asset.Use 10Y-02Y for guidance.ndx (log) using 10Y-02Ystocks move based on QE/QT, economic growth. Cant ignore the liquidity cycle?
citsvar

It's obviously easy looking backwards. Using 3mos trend and longterm cycles, customized macd. Lowest risk with best reward.It's probably what the smart money is using anyway.Trend is 45 degrees, so you dont need re-tests.hindsight appl. super cycle.
citsvar

During public euphoria, bitcoin needs a sustainable high to maintain it's trend.
citsvar

Markets move in cycles and based on game theory. Everyone is risk averse and everyone jumps in when it appears "risk free". This is how prices would be bid up.Stocks work like auction. During Bull runs -> Highest payer - bids up the prices and the averages increase.During Bears -> it's a fire sale. BUYER has an upper hand and takes the lower prices available.It's human nature... Game theory states you buy whilst you can else you will be left behind. during "ATH" prices fly because prices are relative. Where the driver is the credit condition cycle (loose is good) and ofcourse ETFs.***If everyone wants and thinks 150k price. then there do be no or less buyers above 70k.; Majority of people put their PT at a logical level and most likely it's the same for everyone (ie the 150k). A smart trader sells their asset at 70-80% ish value based on resistance level? A level above trader knows game theory - and knows the leveling. If everyone knows about the 70% level, then they level to 50% price. 30% price, etc. If you follow price action during cycles, that's how it worked. High flying stock returns decrease, with volatility increasing.
citsvar

citsvar

A scenario where it gets to 100k by end of year. Just saving this up there)) needs to be led by the important moving averages (50ma, 200ma...). lets go!Comment: ---> Halving end of April ---> summers usually bullish for tech (lack of news) ---> presidential election volatility in autumn. and bullish post November. trade based on log graph.
Disclaimer
Any content and materials included in Sahmeto's website and official communication channels are a compilation of personal opinions and analyses and are not binding. They do not constitute any recommendation for buying, selling, entering or exiting the stock market and cryptocurrency market. Also, all news and analyses included in the website and channels are merely republished information from official and unofficial domestic and foreign sources, and it is obvious that users of the said content are responsible for following up and ensuring the authenticity and accuracy of the materials. Therefore, while disclaiming responsibility, it is declared that the responsibility for any decision-making, action, and potential profit and loss in the capital market and cryptocurrency market lies with the trader.