
chefa
@t_chefa

What symbols does the trader recommend buying?
Purchase History
پیام های تریدر
Filter
Signal Type
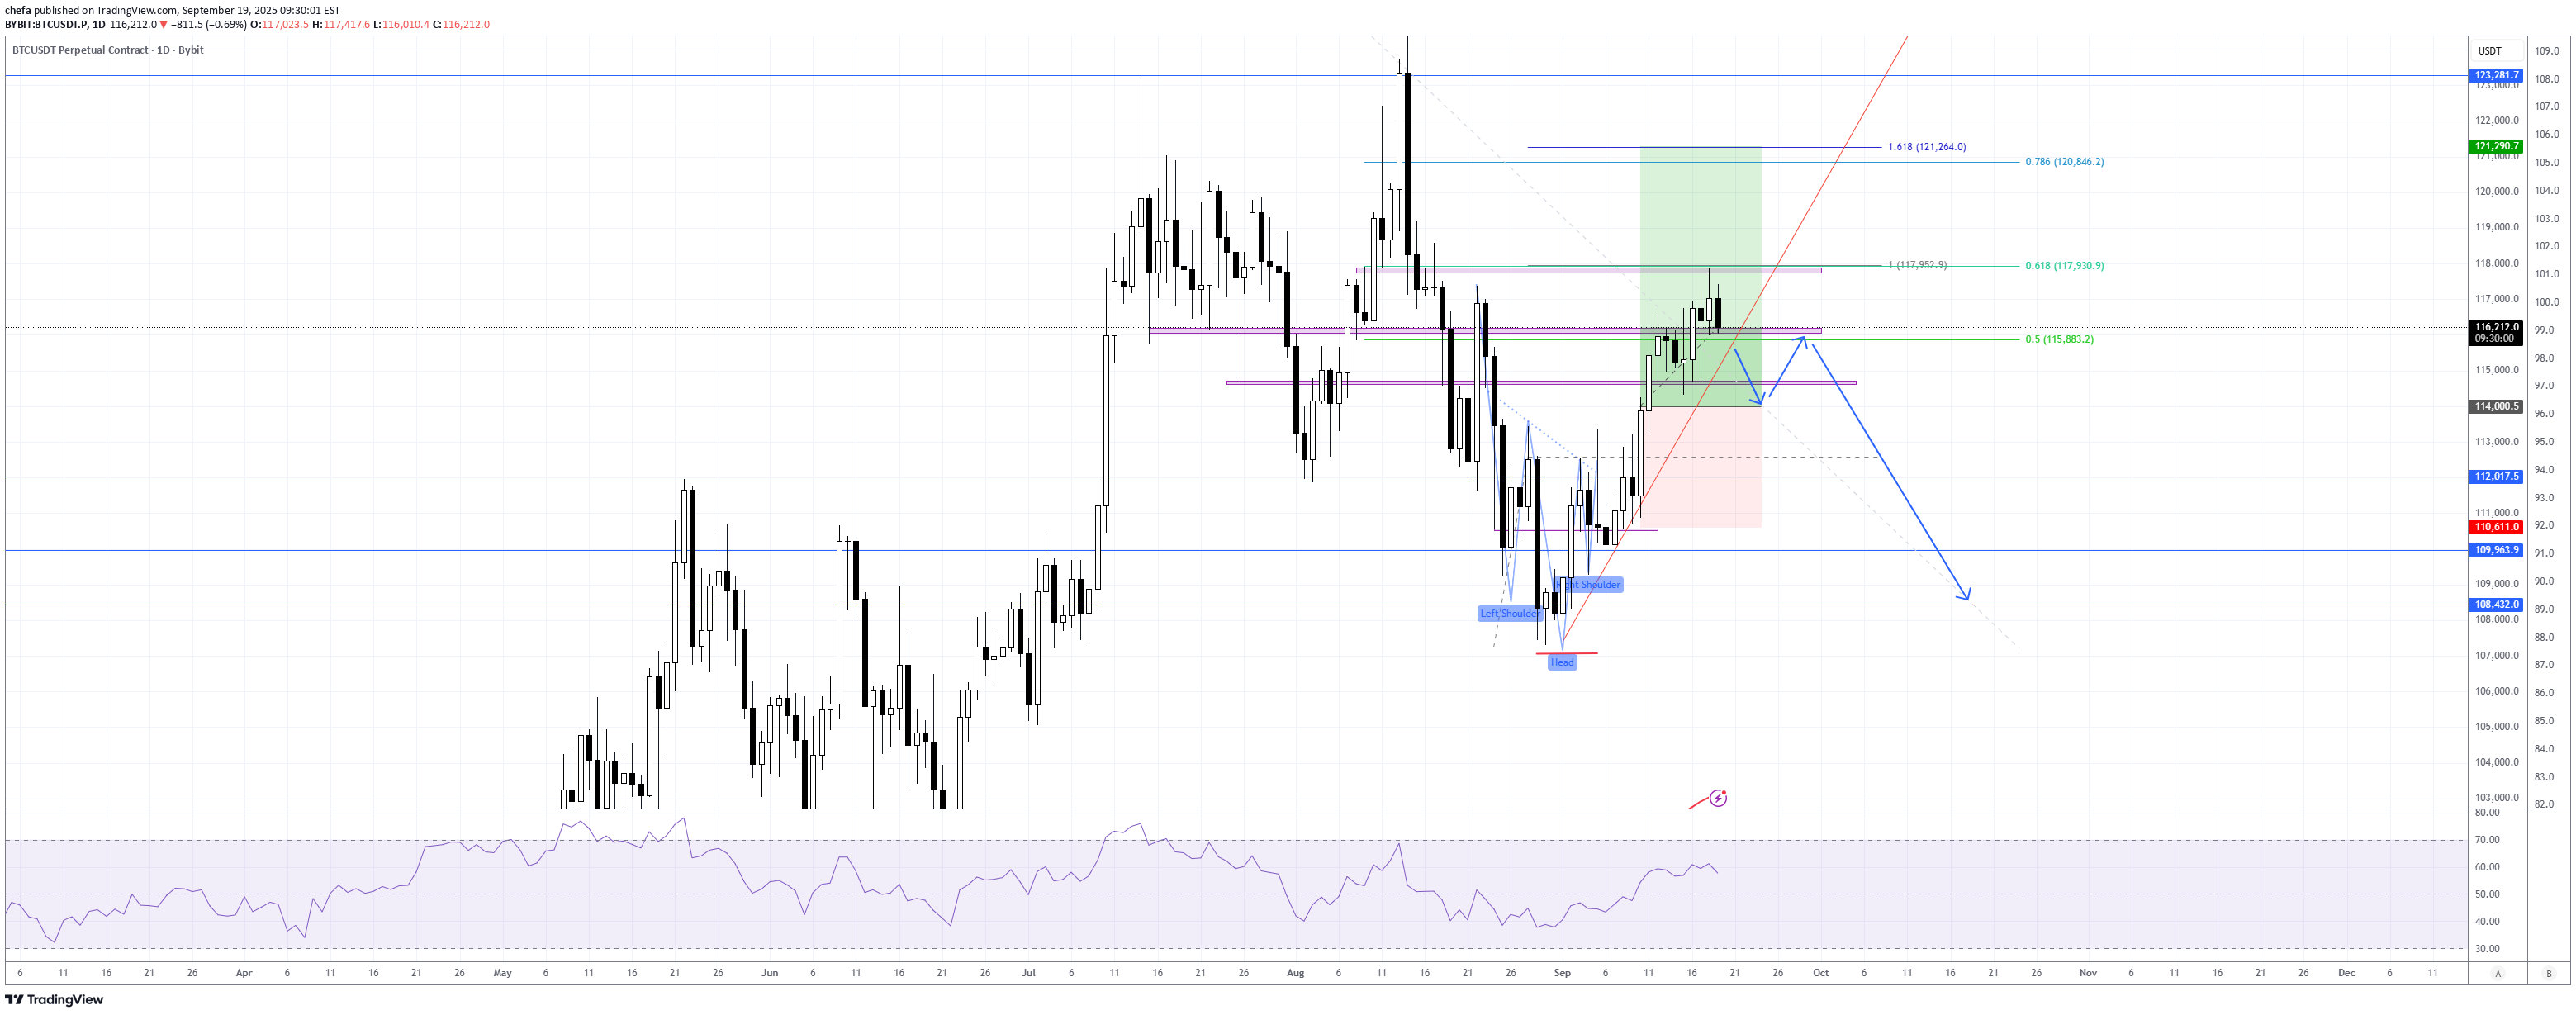
Pattern Recognition: A Head and Shoulders (H&S) reversal structure formed on the daily chart. The 1:1 measured move target has already been achieved, confirming the pattern’s validity. Confluence Zone: That 1:1 target aligns closely with the 0.618 retracement of the previous down leg (124,610 → 107,211). This adds weight to the idea that the move is corrective in nature rather than a fresh bullish leg. Market Structure: Even though price rallied strongly, the bigger picture shows a lower low was created when the 112,017 support level was broken. This keeps the macro trend bearish until proven otherwise. Bearish Scenario: Price is currently respecting the rising trendline. A break below this trendline followed by a retest could trigger continuation to the downside. Potential supports to watch: 112,017 (previous broken support, could flip resistance). 110,681 / 109,363 (structural levels). 108,432 (major demand zone). RSI: Momentum has cooled off without reaching overbought levels, suggesting that upside pressure is weakening.
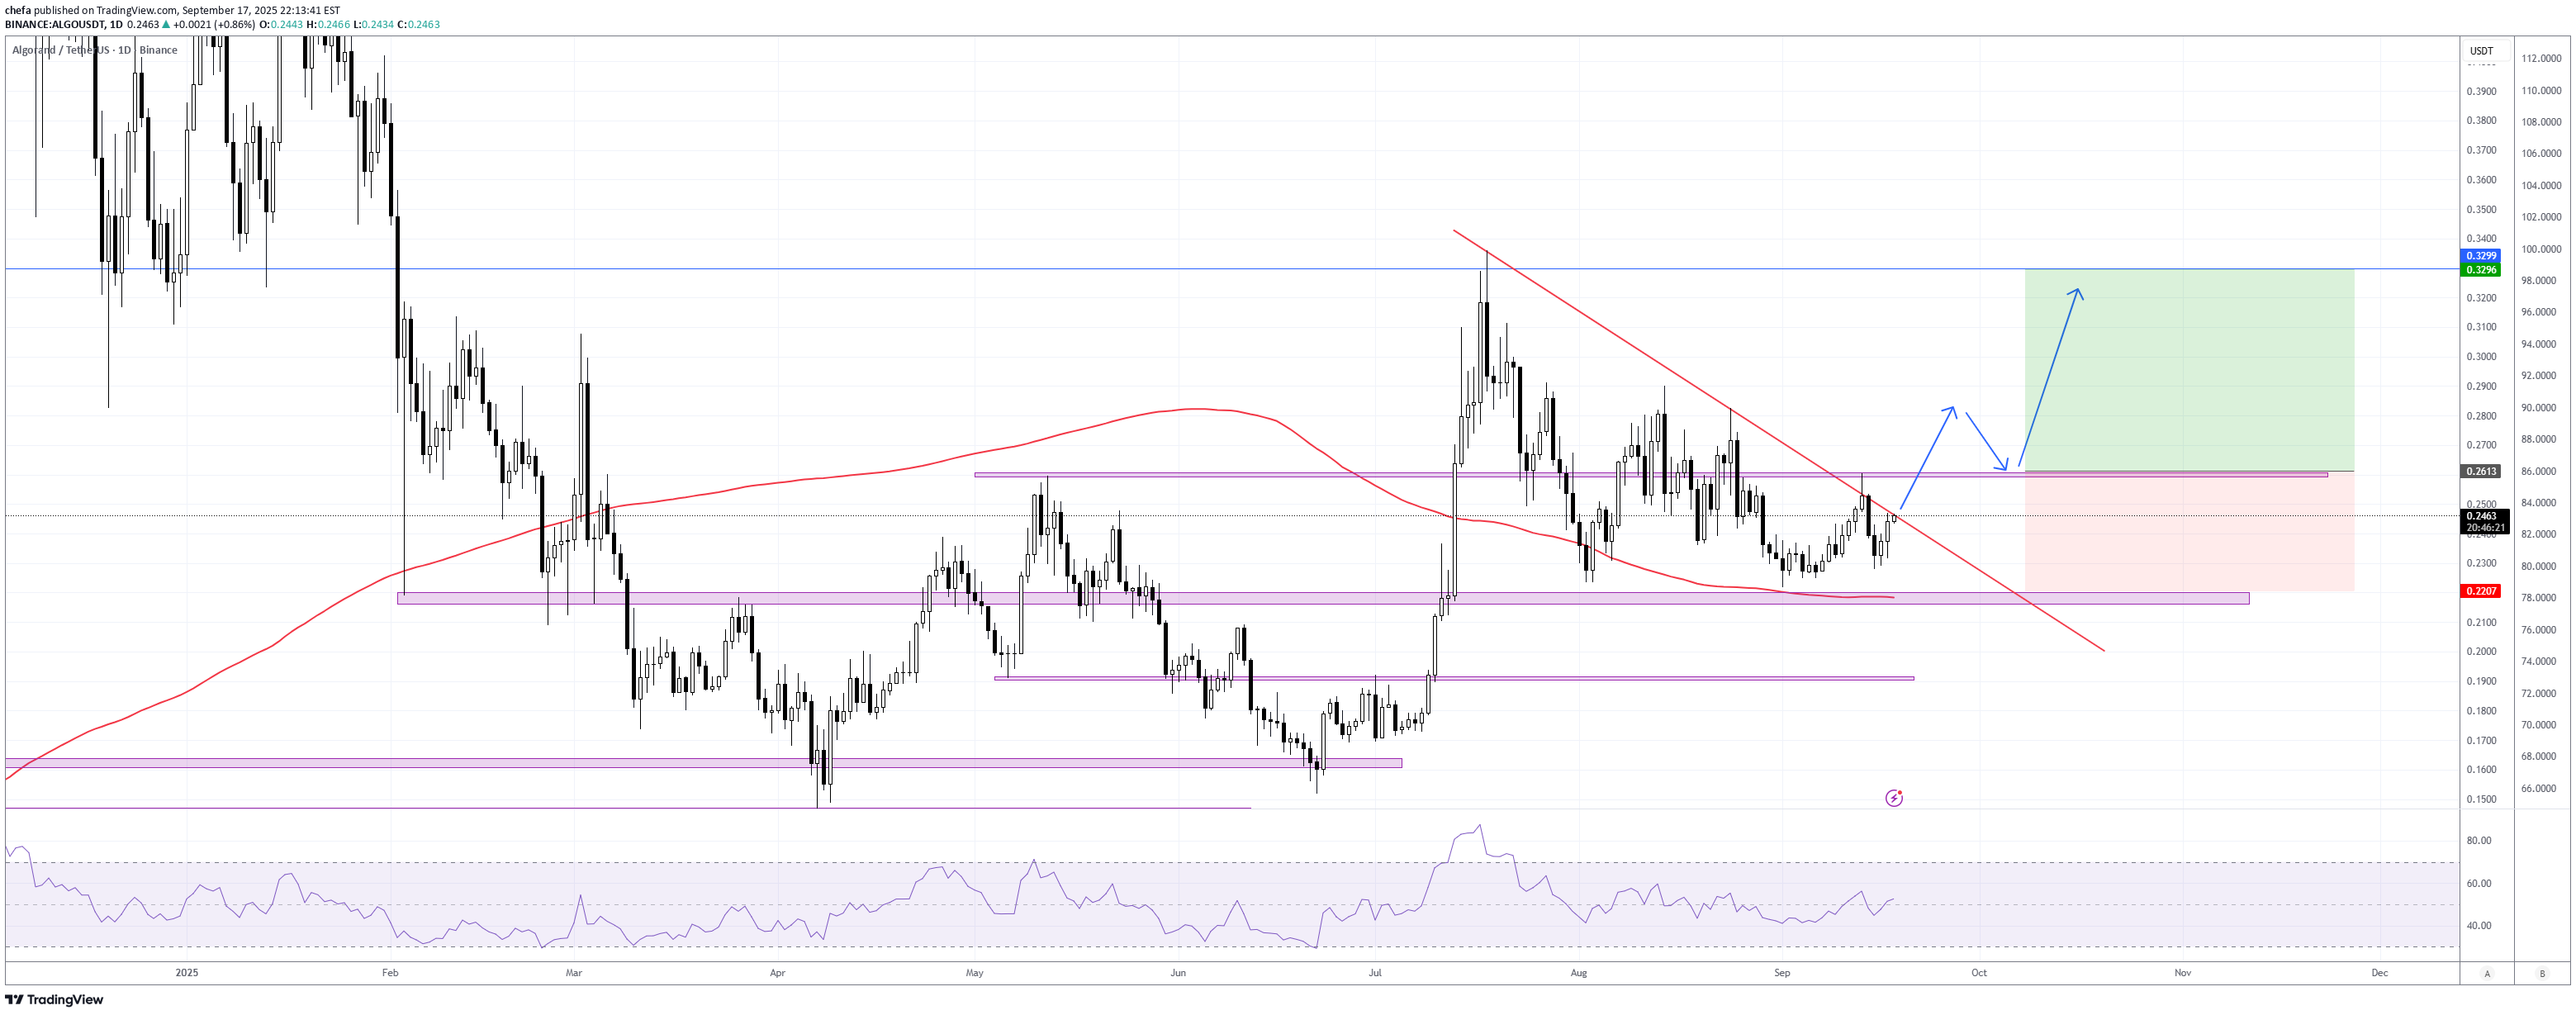
Algo formed a bullish wedge and it's about to break the trend line. Wait for it to break the resistance and when it established above we can enter. Stops at 0.22.
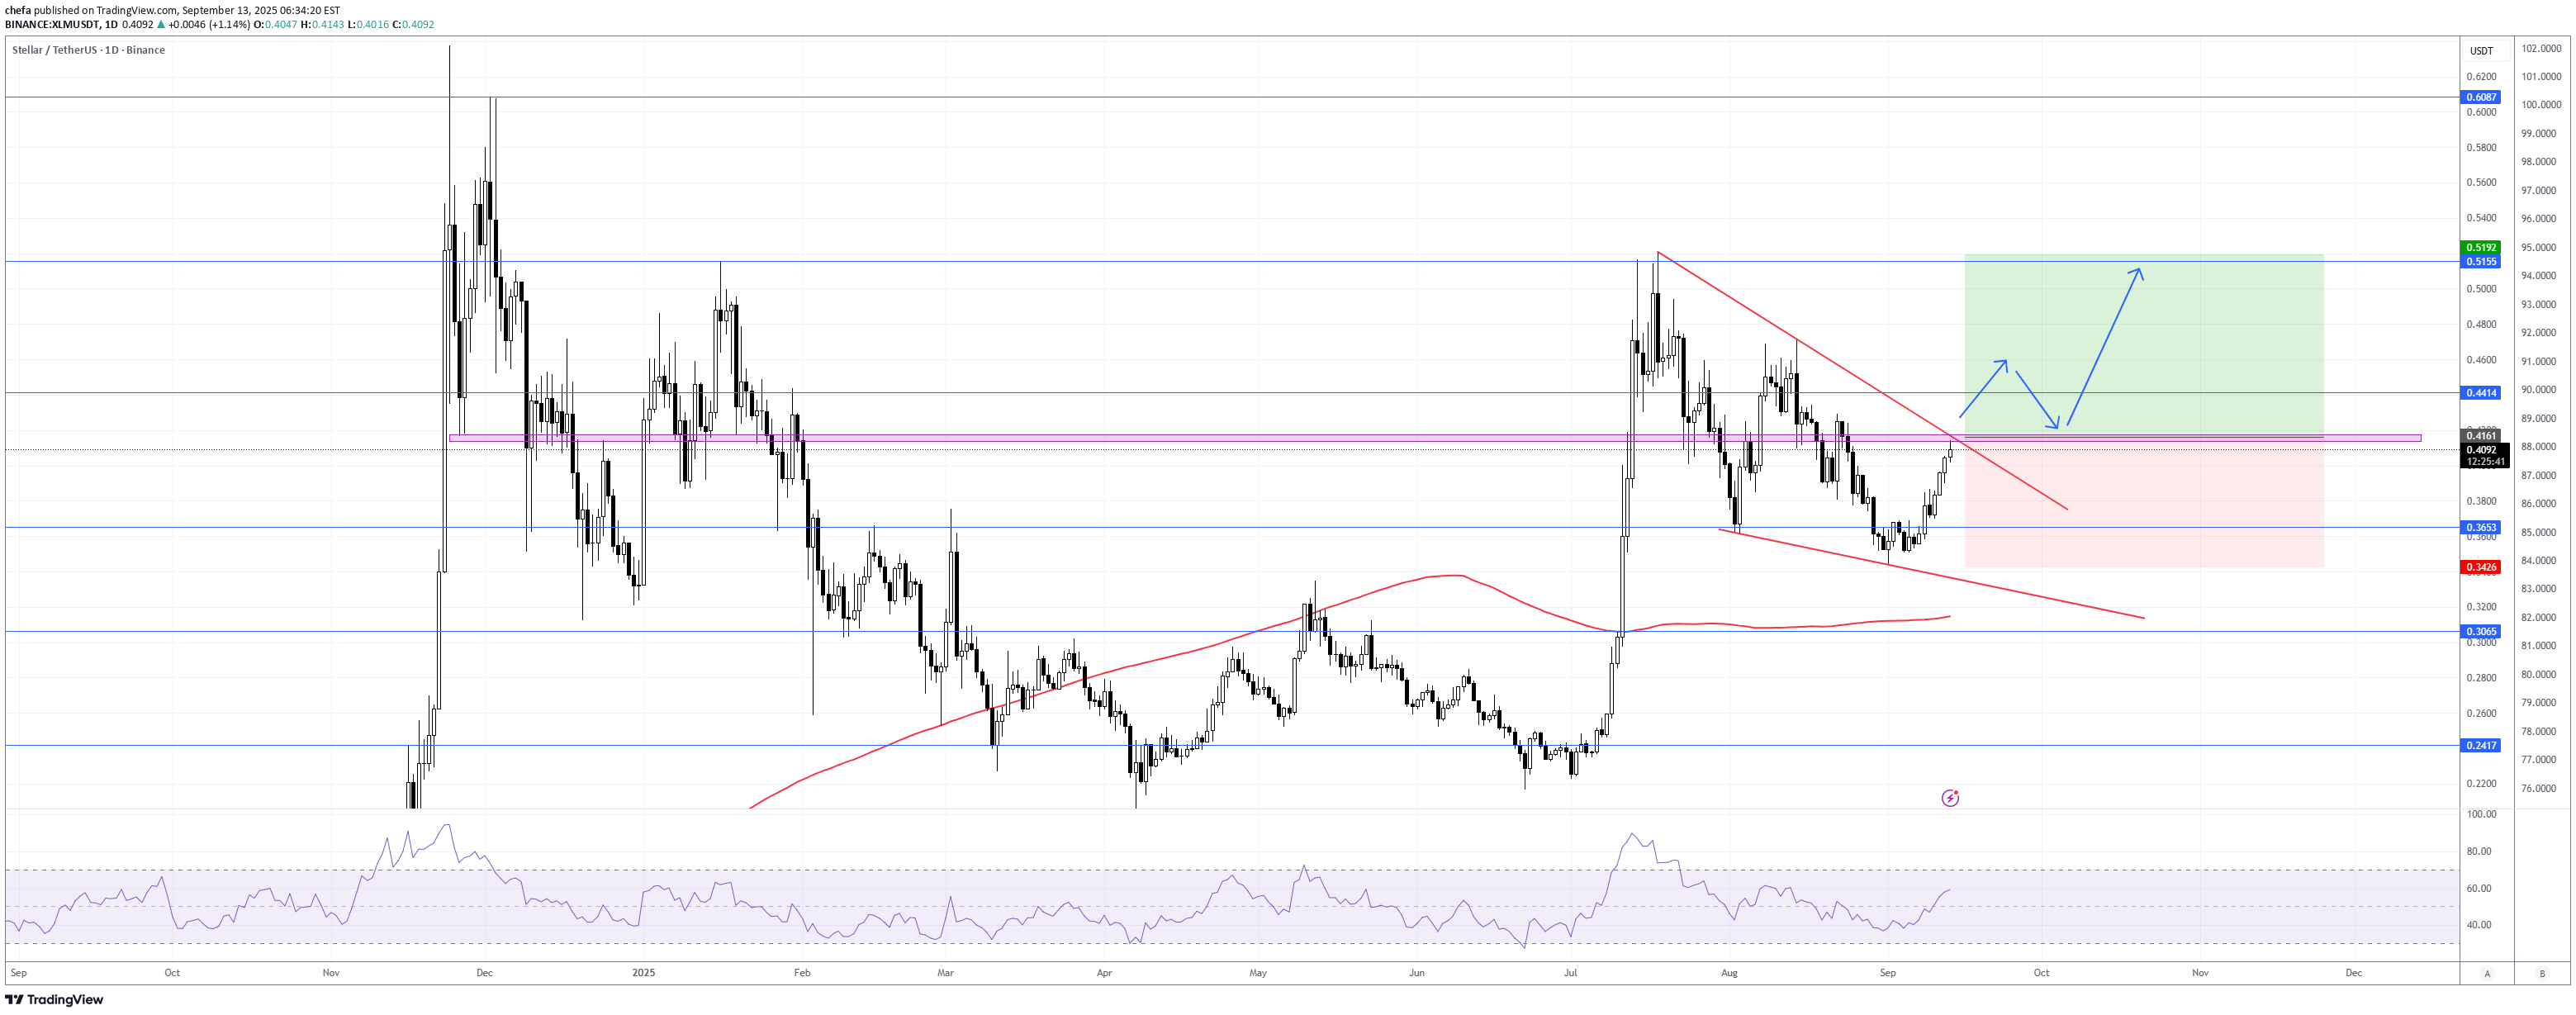
XLM/USDT formed a bullish falling wedge and is now approaching resistance. Breakout confirmation above 0.4161 opens the path to 0.5155, with potential extension to 0.6087. Wait for the breakout and the retest. Stop loss below 0.3425.
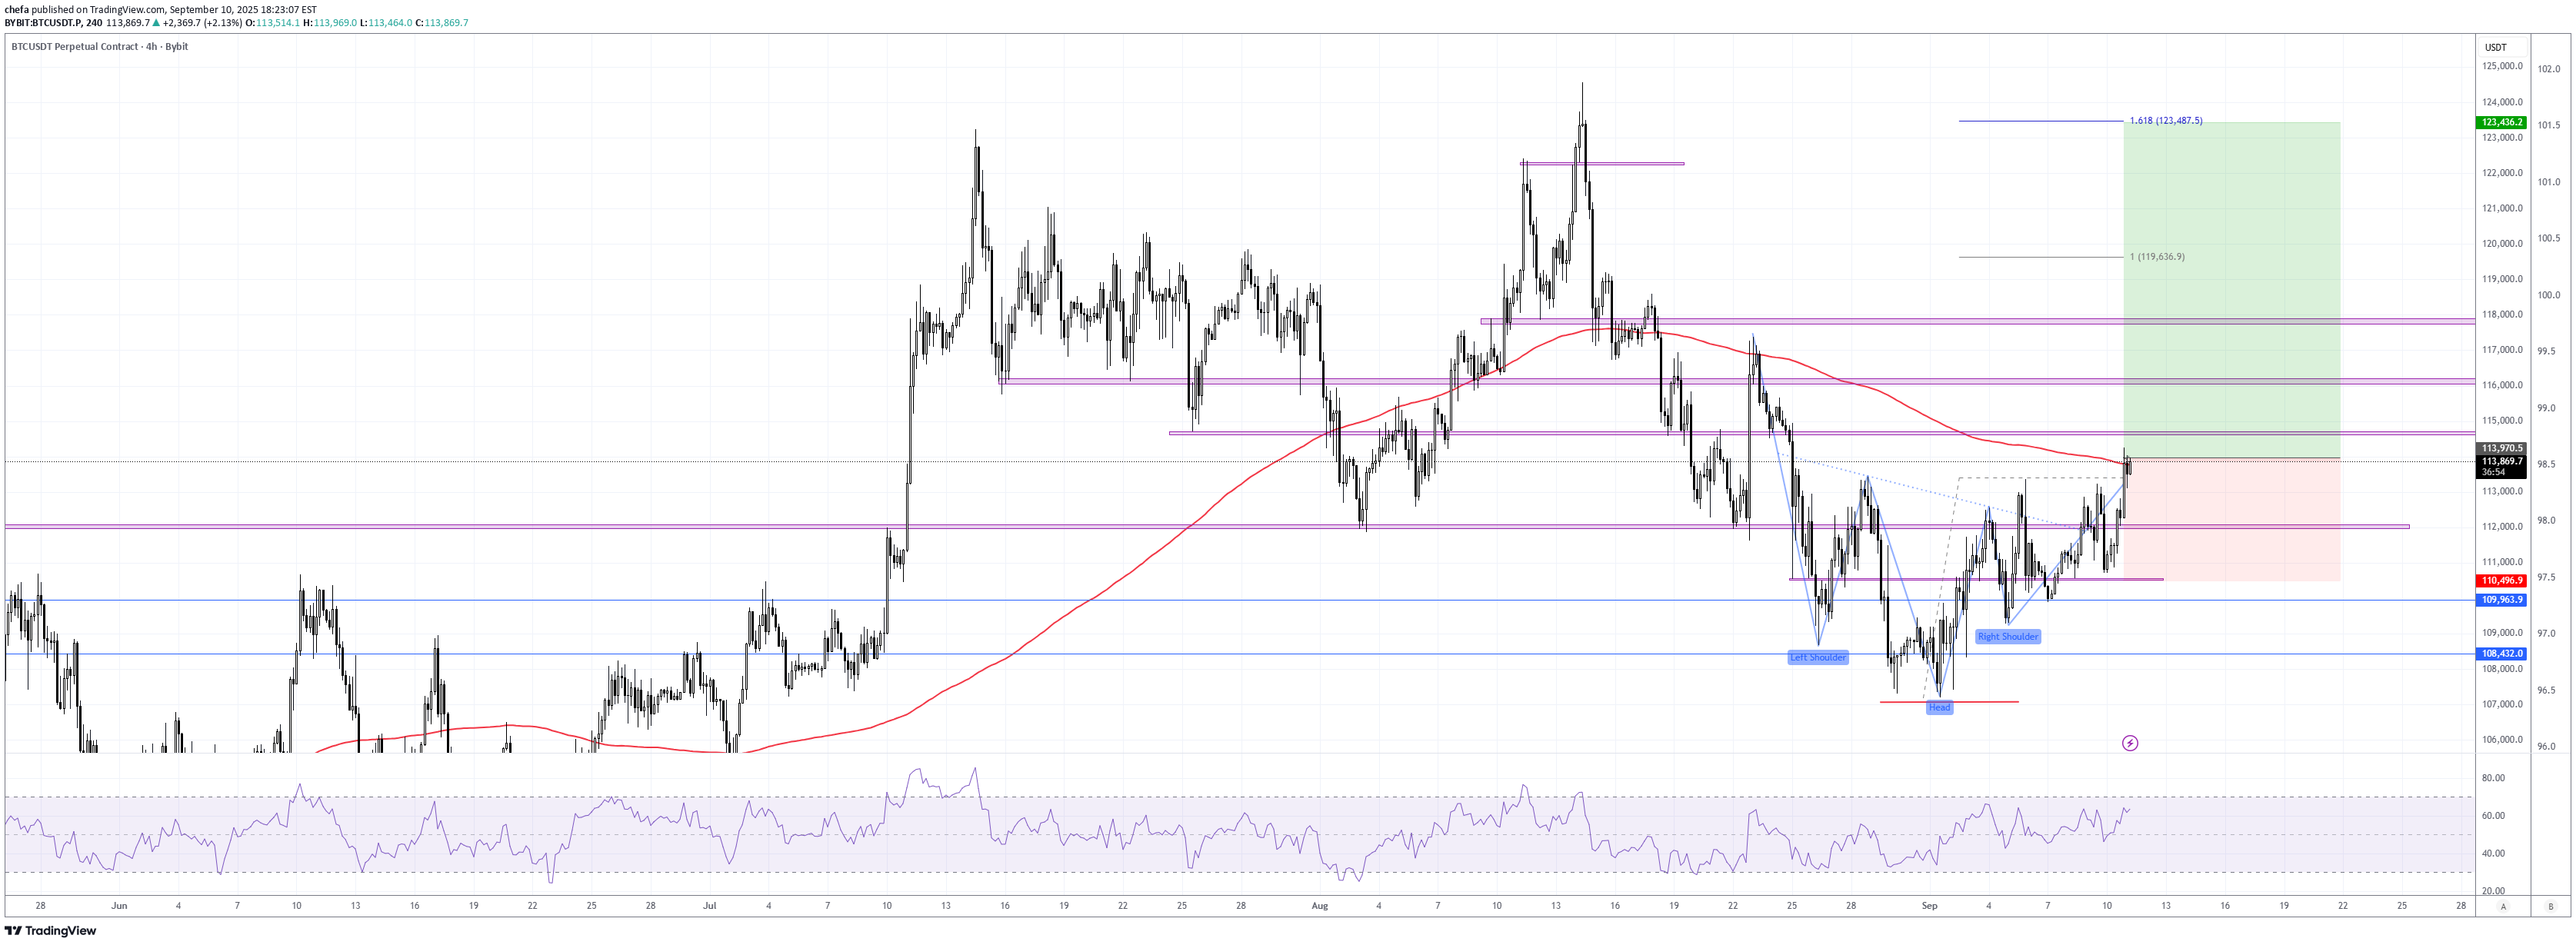
The chart clearly shows an inverse head and shoulders formation: Left Shoulder: ~Aug 26 low. Head: ~Aug 29 low. Right Shoulder: ~Sep 5-7 low. This is a bullish reversal pattern after a prolonged downtrend. The breakout above the neckline (around 113,200 – 113,500) confirms the bullish bias. Fib & Extension Targets : Immediate target: Fibonacci 1.0 extension ~119,600. Extended target: 1.618 extension ~123,500. These align well with previous resistance levels (early August highs).
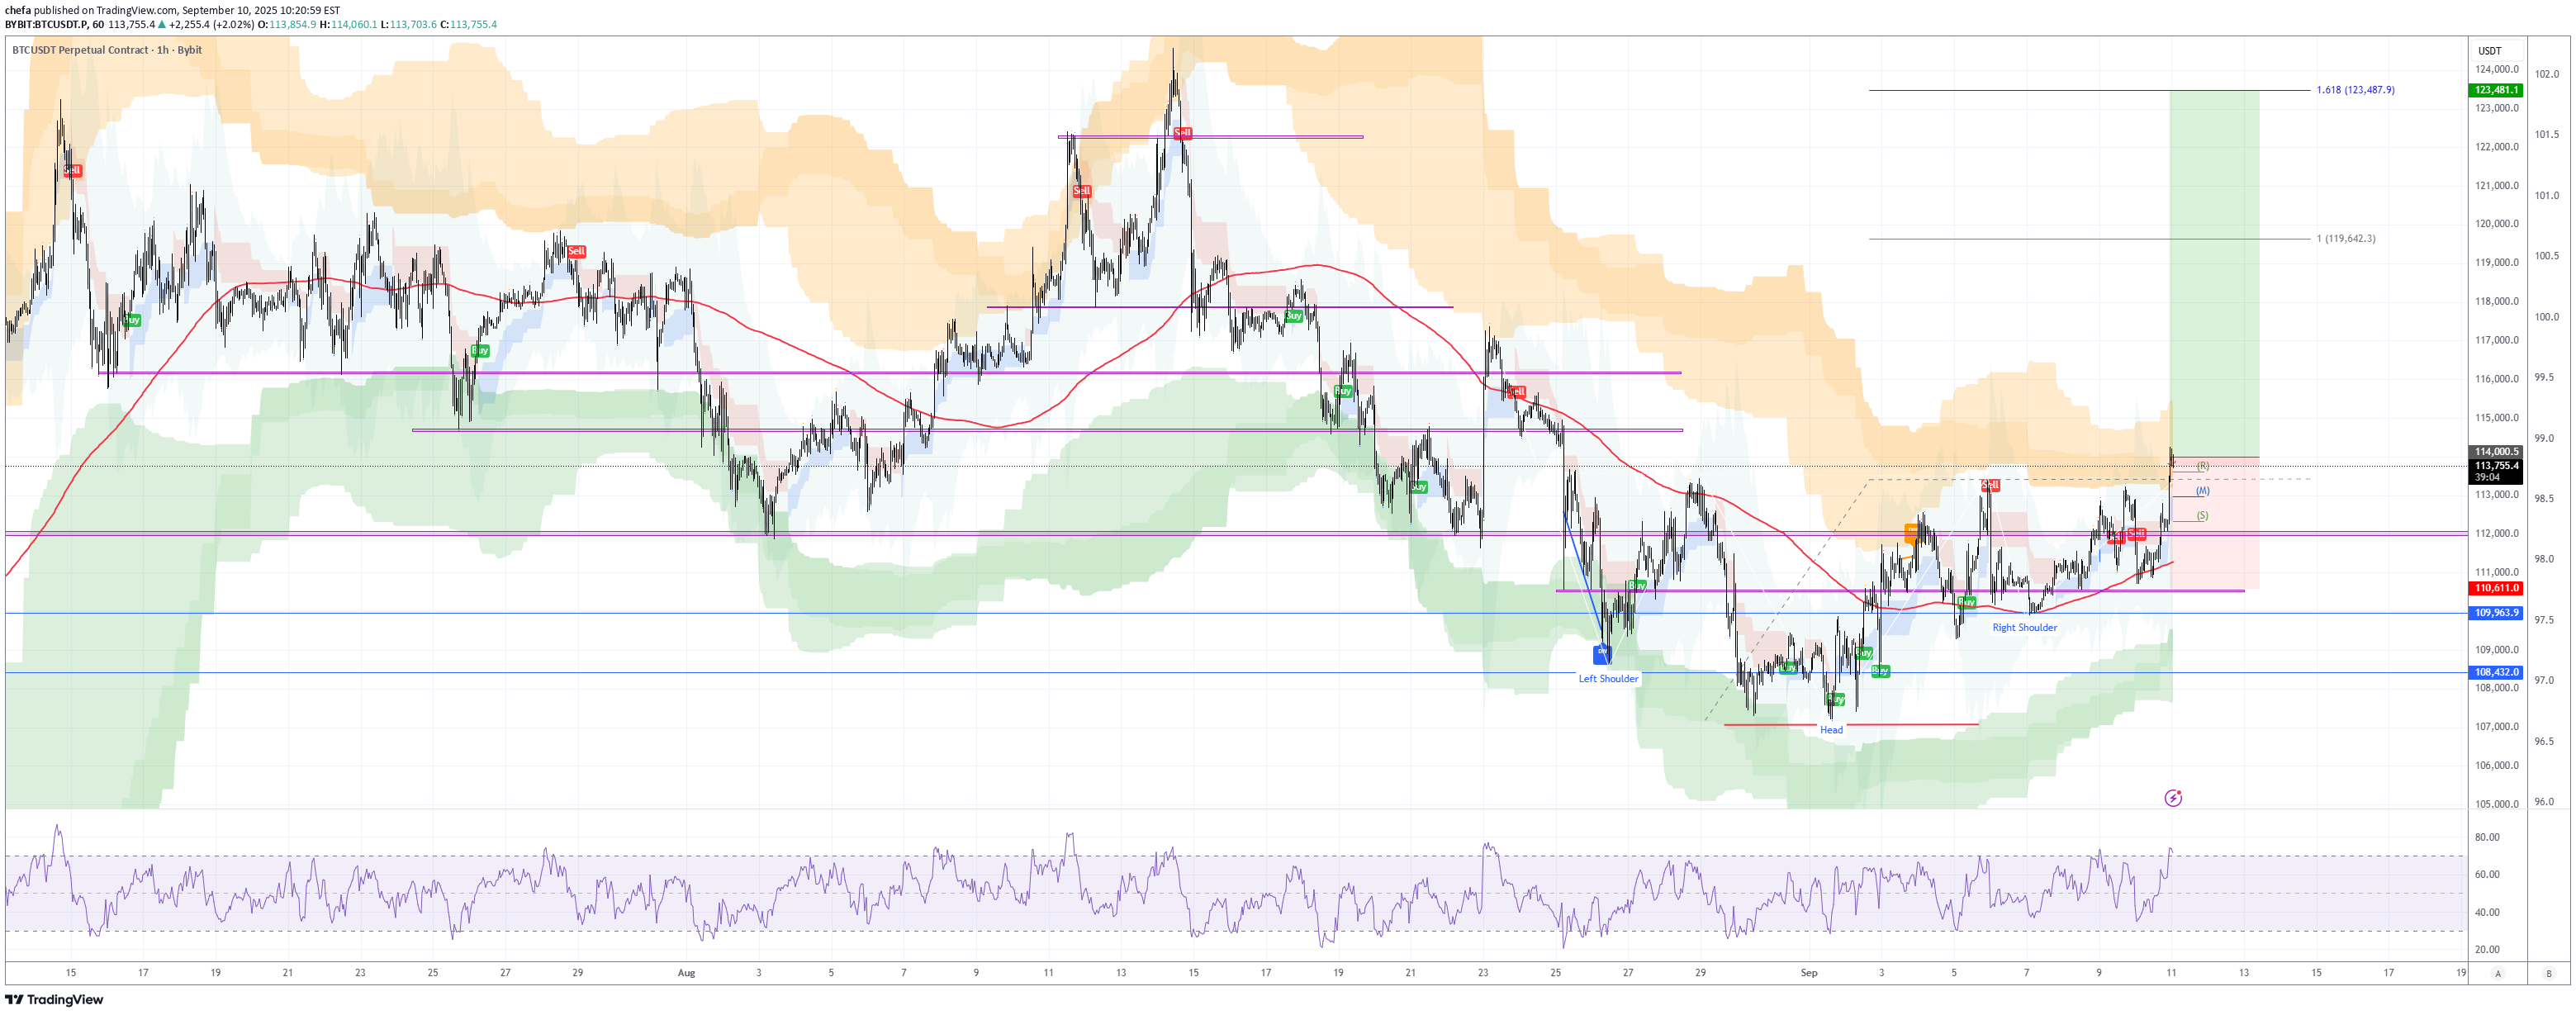
The chart clearly shows an inverse head and shoulders formation: Left Shoulder: ~Aug 25 low. Head: ~Aug 29 low. Right Shoulder: ~Sep 5-7 low. This is a bullish reversal pattern after a prolonged downtrend. The breakout above the neckline (around 113,200 – 113,500) confirms the bullish bias. Fib & Extension Targets : Immediate target: Fibonacci 1.0 extension ~119,600. Extended target: 1.618 extension ~123,500. These align well with previous resistance levels (early August highs).
Disclaimer
Any content and materials included in Sahmeto's website and official communication channels are a compilation of personal opinions and analyses and are not binding. They do not constitute any recommendation for buying, selling, entering or exiting the stock market and cryptocurrency market. Also, all news and analyses included in the website and channels are merely republished information from official and unofficial domestic and foreign sources, and it is obvious that users of the said content are responsible for following up and ensuring the authenticity and accuracy of the materials. Therefore, while disclaiming responsibility, it is declared that the responsibility for any decision-making, action, and potential profit and loss in the capital market and cryptocurrency market lies with the trader.